

Key Insights
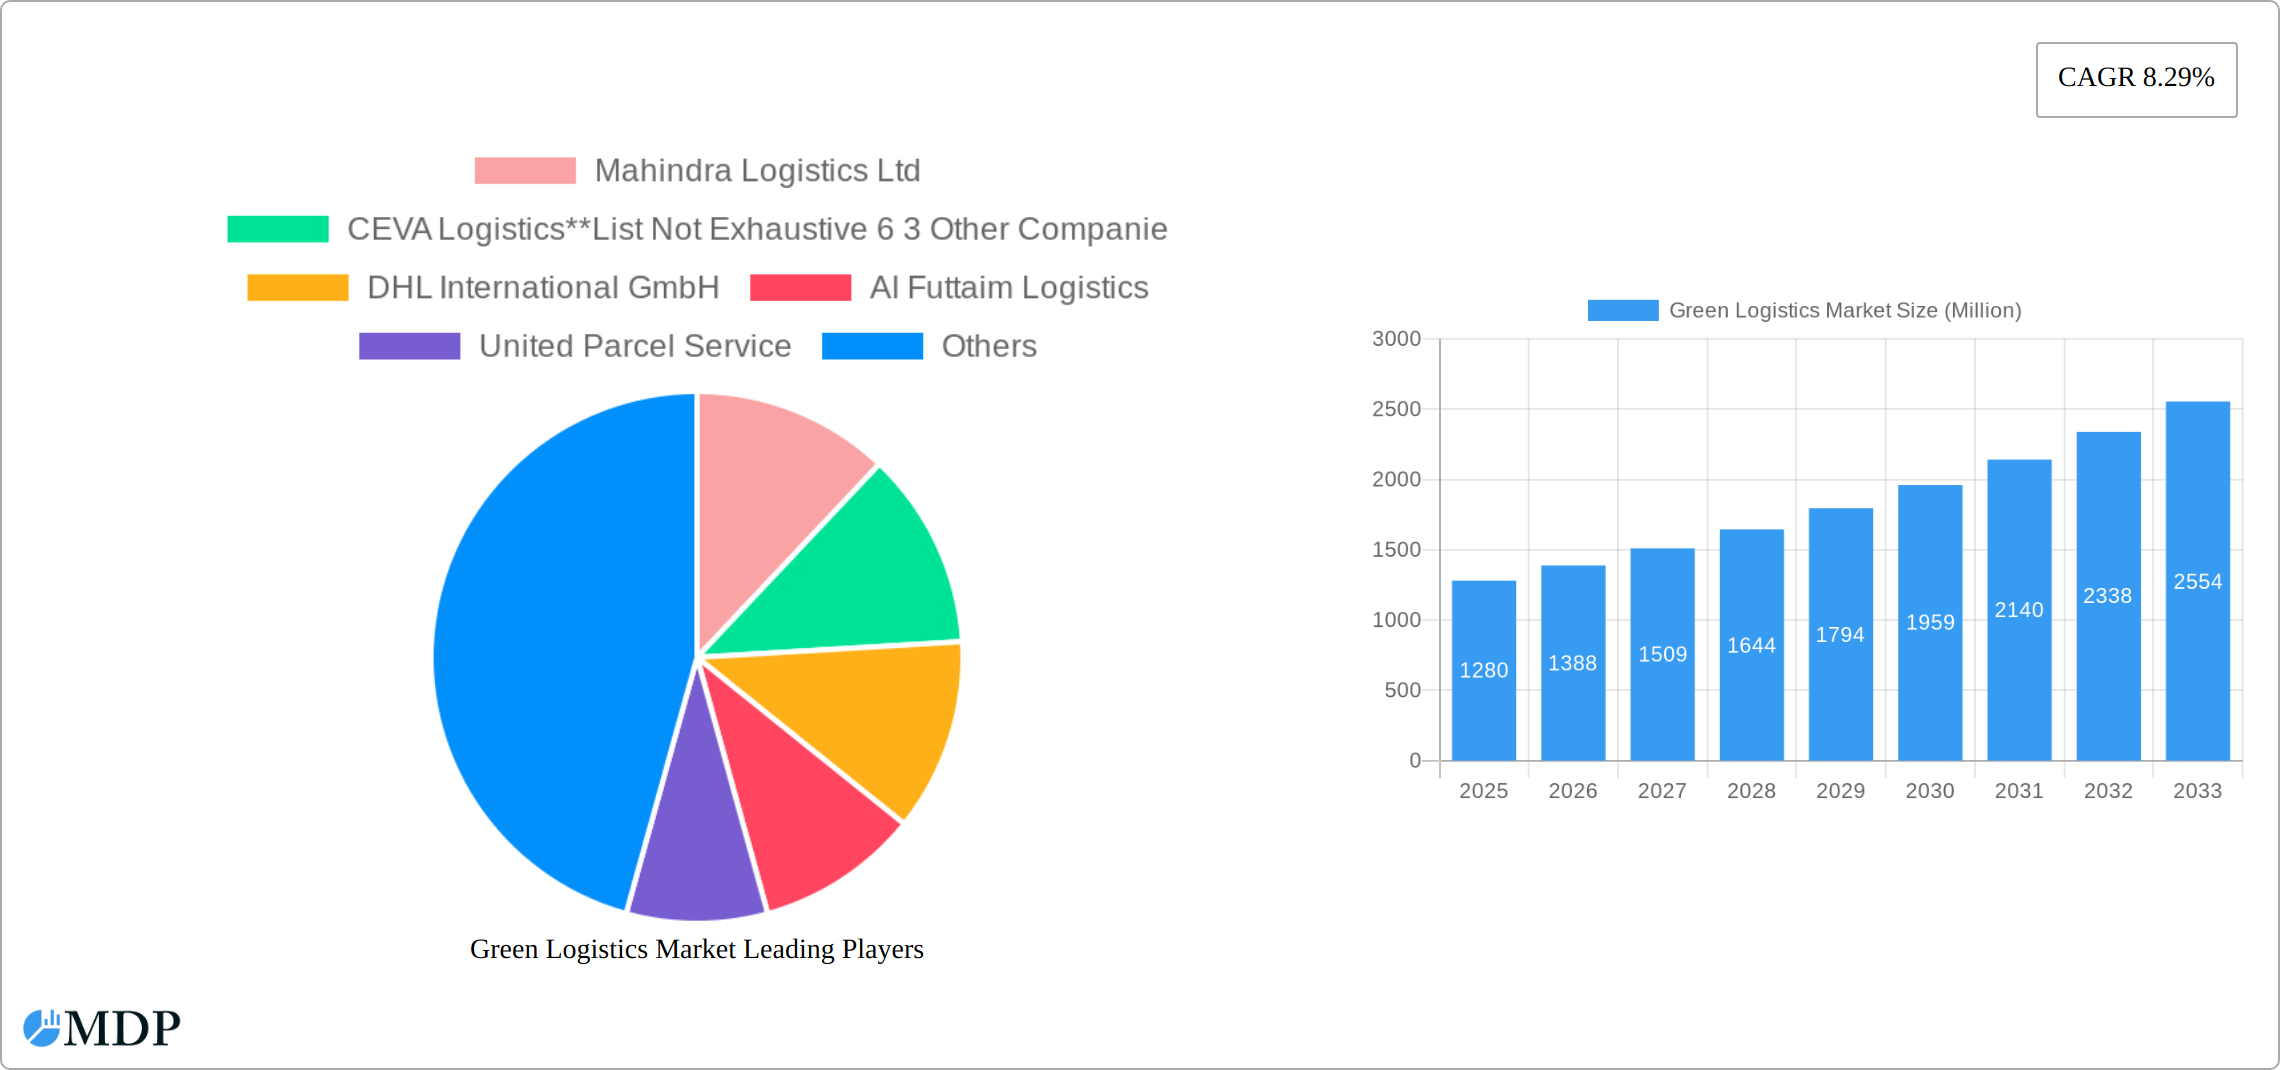
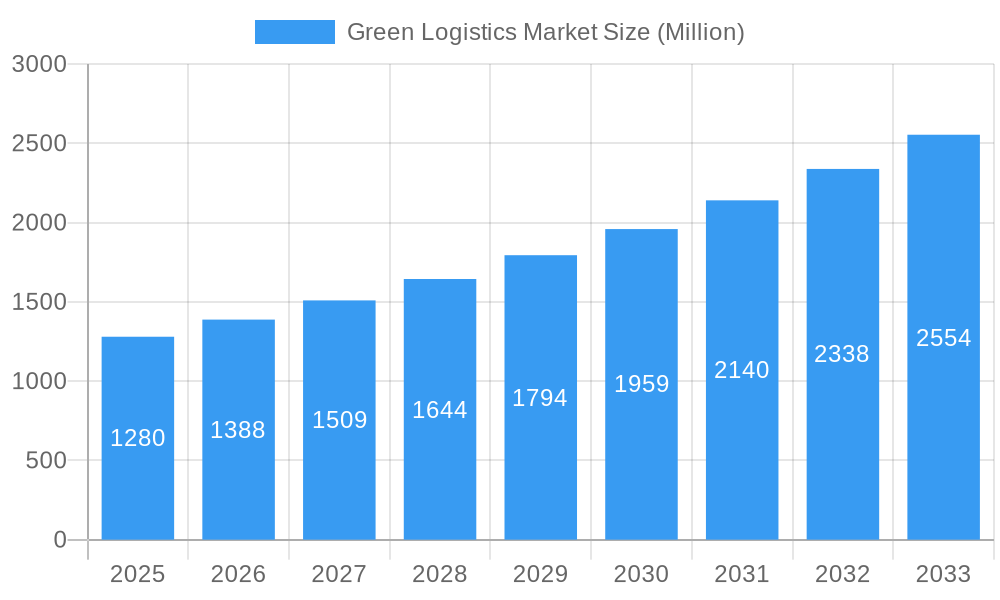
The global green logistics market, valued at $1.28 billion in 2025, is projected to experience robust growth, driven by increasing environmental regulations, heightened consumer awareness of sustainability, and the burgeoning e-commerce sector. A Compound Annual Growth Rate (CAGR) of 8.29% from 2025 to 2033 indicates a significant expansion of this market. Key drivers include the rising adoption of electric vehicles and alternative fuels in transportation, investments in green infrastructure (such as eco-friendly warehouses and distribution centers), and the implementation of innovative technologies like route optimization software to minimize fuel consumption and emissions. Growth is further fueled by corporate social responsibility (CSR) initiatives, with many companies prioritizing environmentally friendly supply chains to enhance their brand image and attract environmentally conscious consumers. While initial investment costs for green technologies may present a restraint, long-term cost savings and government incentives are steadily mitigating this challenge.
Green Logistics Market Market Size (In Billion)
Market segmentation reveals significant opportunities across various end-users. The healthcare sector, driven by the need for temperature-controlled and efficient transportation of pharmaceuticals, is a major growth area. Similarly, the e-commerce and retail sectors, with their high reliance on last-mile delivery, are actively seeking sustainable logistics solutions. The warehousing and distribution segments within the business type category are poised for considerable growth, as companies invest in green warehousing practices and adopt efficient distribution strategies. Geographically, North America and Europe currently hold significant market shares, but the Asia-Pacific region is expected to experience rapid growth driven by increasing industrialization and urbanization in countries like India and China. This presents substantial opportunities for logistics providers to establish a presence in rapidly developing markets and capitalize on the increasing demand for green logistics solutions.
Green Logistics Market Company Market Share
Green Logistics Market: A Comprehensive Report (2019-2033)
This comprehensive report provides an in-depth analysis of the Green Logistics Market, offering invaluable insights for stakeholders across the supply chain. With a study period spanning 2019-2033, a base year of 2025, and a forecast period of 2025-2033, this report utilizes rigorous data analysis to project market growth and identify key trends. The market is segmented by end-user (Healthcare, Manufacturing, Automotive, Banking & Financial Services, Retail & E-commerce, Others), business type (Warehousing, Distribution, Value-Added Services), and mode of operation (Storage, Roadways Distribution, Seaways Distribution, Others). The report values the market at xx Million in 2025 and projects a CAGR of xx% during the forecast period, reaching xx Million by 2033. Key players analyzed include Mahindra Logistics Ltd, CEVA Logistics, DHL International GmbH, Al Futtaim Logistics, United Parcel Service, Yusen Logistics Co Ltd, GEODIS, XPO Logistics, Agility Public Warehousing Company K S C P, Bollore Logistics, and Bowling Green Logistics, with a further 63 other companies considered.
Green Logistics Market Market Dynamics & Concentration
The Green Logistics market is characterized by a moderately concentrated landscape, featuring a few prominent players who hold a substantial portion of the market share. While the exact market share of the top 5 players is subject to ongoing shifts, it indicates a degree of consolidation. Nevertheless, the market remains dynamic, offering fertile ground for smaller, specialized companies that focus on niche segments or introduce innovative solutions. The continuous drive for innovation is fueled by a confluence of factors, including increasingly stringent environmental regulations, a burgeoning consumer demand for sustainable business practices, and the rapid adoption of advanced technological solutions.
Regulatory frameworks, particularly those concerning carbon emission standards and comprehensive waste management, exert a significant influence on market dynamics. These regulations, while presenting challenges, also create compelling opportunities, compelling companies to allocate resources towards sustainable technologies and operational practices. The market is further shaped by the emergence and increasing traction of product substitutes, such as electric vehicles and diverse alternative fuels, which actively impact the competitive landscape. Moreover, Mergers and Acquisitions (M&A) are a prevalent strategic tool within this sector. The historical period (2019-2024) has seen a notable number of M&A transactions, often driven by strategic objectives to broaden market reach, augment technological capabilities, and refine operational efficiencies.
- Key Market Dynamics:
- Escalating environmental regulations driving sustainable practices.
- Growing consumer preference and demand for ethically sourced and sustainably delivered products.
- Technological advancements, including the widespread adoption of electric vehicles, automation, and smart logistics solutions.
- M&A activity serving as a catalyst for market consolidation and strategic expansion.
- Fluctuations in global fuel prices impacting operational costs and the attractiveness of alternative solutions.
- Increasing awareness and mitigation of supply chain disruptions through resilient and greener strategies.
Green Logistics Market Industry Trends & Analysis
The Green Logistics market is experiencing robust and sustained growth, primarily propelled by heightened environmental consciousness and the implementation of increasingly stringent government regulations designed to curtail carbon emissions. This has catalyzed a profound shift towards sustainable logistics, marked by the widespread adoption of electric vehicles (EVs), the exploration and utilization of alternative fuels, and the deployment of sophisticated optimized routing algorithms. Technological disruptions, notably the integration of the Internet of Things (IoT) for enhanced visibility and control, and AI-powered optimization tools for unparalleled efficiency, are fundamentally transforming supply chain operations and their environmental footprint. Consumer preferences are increasingly aligning with brands demonstrating a commitment to environmental responsibility, thereby compelling companies to embrace greener logistics practices to maintain and enhance their competitive standing.
The competitive landscape is characterized by intense rivalry among established industry players and the dynamic emergence of innovative startups offering cutting-edge sustainable solutions. The market penetration of green technologies within the logistics sector is on a steady upward trajectory, though adoption rates may vary across different segments and geographical regions. The overarching market outlook remains highly positive, with projections indicating continued expansion, further fueled by ongoing technological advancements and the unwavering support of favorable regulatory frameworks.
Leading Markets & Segments in Green Logistics Market
The Retail and E-commerce segment stands out as the dominant force in the Green Logistics market, largely attributed to the imperative for rapid, efficient, and environmentally sound last-mile delivery solutions demanded by the booming online retail sector. By mode of operation, the Roadways Distribution segment commands leadership due to its extensive accessibility and comparatively lower initial investment requirements when contrasted with sea or air freight alternatives. In terms of business type, the Warehousing segment is a significant player, reflecting the critical need for advanced, efficient, and environmentally responsible storage and inventory management facilities. Geographically, [mention dominant region/country – e.g., North America/United States] currently holds the largest market share, a position fortified by a combination of influential factors.
- Key Drivers in Dominant Regions/Segments:
- Stringent environmental regulations and policy mandates (e.g., EU Emission Standards) are compelling greener operational choices.
- Robust and accelerating e-commerce growth is directly fueling the demand for sustainable and efficient last-mile delivery solutions.
- Government incentives, subsidies, and supportive policies are actively encouraging investment in and adoption of green logistics initiatives.
- The presence of well-developed infrastructure facilitates efficient and optimized logistics operations, supporting greener alternatives.
- Strong and evolving consumer demand for sustainable products and services is a powerful market influencer.
Green Logistics Market Product Developments
Recent product innovations focus on electric vehicles, alternative fuels, and optimized route planning software. These advancements aim to minimize carbon emissions, improve fuel efficiency, and reduce overall environmental impact. The integration of IoT devices and AI-powered analytics allows for real-time monitoring and optimization of logistics operations, further enhancing efficiency and sustainability. These products offer several competitive advantages, including reduced operational costs, improved brand reputation, and enhanced customer satisfaction. Market fit is strong, especially within environmentally conscious segments, highlighting the growing demand for sustainable logistics solutions.
Key Drivers of Green Logistics Market Growth
The growth trajectory of the Green Logistics market is being significantly propelled by several interconnected factors. Paramount among these are the stringent government regulations implemented with the explicit aim of curbing carbon emissions and championing overall sustainability, thereby creating substantial demand for eco-friendly logistics solutions. The escalating consumer preference for brands that demonstrably prioritize environmental consciousness is another pivotal driver, influencing corporate strategy and operational choices. Technological advancements continue to play a crucial role, with the development and deployment of electric vehicles, a wider array of alternative fuels, and sophisticated route optimization software fundamentally enhancing operational efficiency while concurrently reducing the environmental impact of logistics activities. Economic considerations, including the rising costs associated with traditional fossil fuels and a heightened awareness of the broader environmental and social externalities associated with conventional logistics practices, are collectively incentivizing the transition towards greener methodologies.
Challenges in the Green Logistics Market Market
Several challenges hinder the growth of the Green Logistics market. High initial investment costs associated with adopting green technologies, such as electric vehicles and renewable energy infrastructure, can be a significant barrier for smaller companies. Regulatory hurdles and complexities in obtaining necessary permits and approvals can also create obstacles. Supply chain disruptions and the limited availability of certain sustainable materials can impact the market's growth. Intense competition from traditional logistics providers, who may not have fully embraced green practices, creates further challenges.
Emerging Opportunities in Green Logistics Market
The Green Logistics market is brimming with emerging opportunities ripe for exploitation. Technological breakthroughs are continuously opening new avenues, particularly in the development of more efficient and cost-effective electric vehicles, advancements in battery technology, and the exploration of novel alternative fuels, all of which are poised to accelerate the adoption of green technologies. The formation of strategic partnerships between established logistics companies and innovative technology providers holds immense potential to foster collaborative innovation and expedite the widespread integration of sustainable solutions across the industry. Furthermore, expanding market reach into developing economies, where the demand for environmentally responsible logistics is steadily rising, presents a significant and promising avenue for sustained growth and market leadership.
Leading Players in the Green Logistics Market Sector
- Mahindra Logistics Ltd
- CEVA Logistics
- DHL International GmbH
- Al Futtaim Logistics
- United Parcel Service
- Yusen Logistics Co Ltd
- GEODIS
- XPO Logistics
- Agility Public Warehousing Company K S C P
- Bollore Logistics
- Bowling Green Logistics
- 63 Other Companies
Key Milestones in Green Logistics Market Industry
- 2020: Increased focus on sustainable packaging and delivery solutions.
- 2021: Significant investments in electric vehicle fleets by major logistics companies.
- 2022: Launch of several innovative green logistics technologies.
- 2023: Government policies supporting the transition to sustainable logistics intensify.
- 2024: Increased adoption of carbon offsetting schemes within the industry.
Strategic Outlook for Green Logistics Market Market
The Green Logistics market is poised for significant growth in the coming years, driven by technological advancements, stringent environmental regulations, and increasing consumer demand for sustainable practices. Companies that invest in innovative technologies, optimize their operations for efficiency, and build strong partnerships will be well-positioned to capitalize on the market's growth potential. A strategic focus on reducing carbon emissions, improving fuel efficiency, and adopting sustainable supply chain practices will be crucial for success in this evolving landscape.
Green Logistics Market Segmentation
-
1. End User
- 1.1. Healthcare
- 1.2. Manufacturing
- 1.3. Automotive
- 1.4. Banking and Financial services
- 1.5. Retail and E-commerce
- 1.6. Others
-
2. Business Type
- 2.1. Warehousing
- 2.2. Distribution
- 2.3. Value-Added Services
-
3. Mode of Operation
- 3.1. Storage
- 3.2. Roadways Distribution
- 3.3. Seaways Distribution
- 3.4. Others
Green Logistics Market Segmentation By Geography
-
1. North America
- 1.1. US
- 1.2. Canada
- 1.3. Mexico
-
2. Europe
- 2.1. Germany
- 2.2. UK
- 2.3. France
- 2.4. Russia
- 2.5. Spain
- 2.6. Rest of Europe
-
3. Asia Pacific
- 3.1. India
- 3.2. China
- 3.3. Japan
- 3.4. South Korea
- 3.5. Rest of Asia Pacific
-
4. LAMEA
- 4.1. Latin America
- 4.2. Middle East
- 4.3. Africa
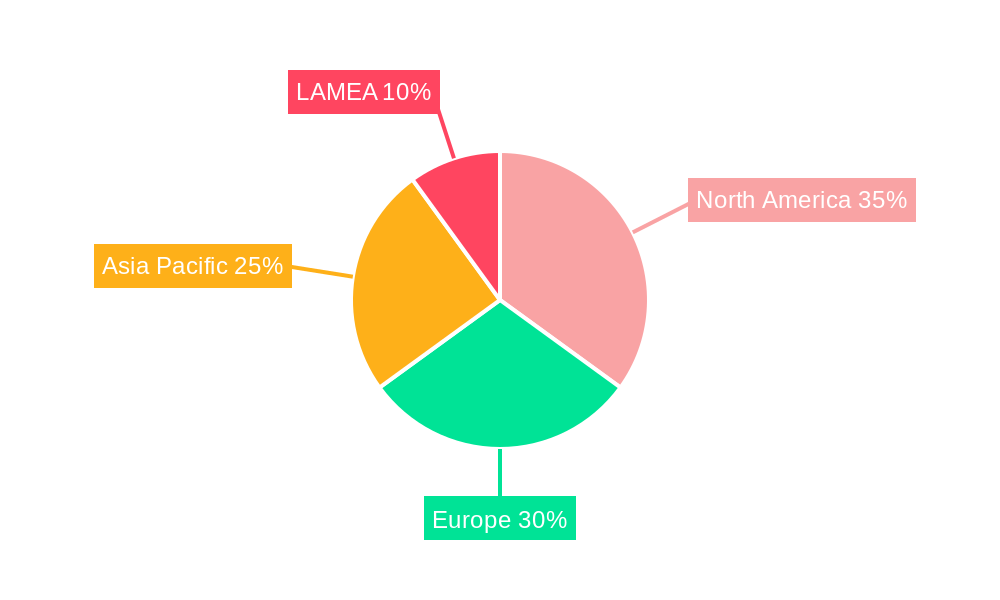
Green Logistics Market Regional Market Share
Geographic Coverage of Green Logistics Market
Green Logistics Market REPORT HIGHLIGHTS
| Aspects | Details |
|---|---|
| Study Period | 2020-2034 |
| Base Year | 2025 |
| Estimated Year | 2026 |
| Forecast Period | 2026-2034 |
| Historical Period | 2020-2025 |
| Growth Rate | CAGR of 8.29% from 2020-2034 |
| Segmentation |
|
Table of Contents
- 1. Introduction
- 1.1. Research Scope
- 1.2. Market Segmentation
- 1.3. Research Objective
- 1.4. Definitions and Assumptions
- 2. Executive Summary
- 2.1. Market Snapshot
- 3. Market Dynamics
- 3.1. Market Drivers
- 3.2. Market Restrains
- 3.3. Market Trends
- 3.4. Market Opportunities
- 4. Market Factor Analysis
- 4.1. Porters Five Forces
- 4.1.1. Bargaining Power of Suppliers
- 4.1.2. Bargaining Power of Buyers
- 4.1.3. Threat of New Entrants
- 4.1.4. Threat of Substitutes
- 4.1.5. Competitive Rivalry
- 4.2. PESTEL analysis
- 4.3. BCG Analysis
- 4.3.1. Stars (High Growth, High Market Share)
- 4.3.2. Cash Cows (Low Growth, High Market Share)
- 4.3.3. Question Mark (High Growth, Low Market Share)
- 4.3.4. Dogs (Low Growth, Low Market Share)
- 4.4. Ansoff Matrix Analysis
- 4.5. Supply Chain Analysis
- 4.6. Regulatory Landscape
- 4.7. Current Market Potential and Opportunity Assessment (TAM–SAM–SOM Framework)
- 4.8. MDP Analyst Note
- 4.1. Porters Five Forces
- 5. Market Analysis, Insights and Forecast 2021-2033
- 5.1. Market Analysis, Insights and Forecast - by End User
- 5.1.1. Healthcare
- 5.1.2. Manufacturing
- 5.1.3. Automotive
- 5.1.4. Banking and Financial services
- 5.1.5. Retail and E-commerce
- 5.1.6. Others
- 5.2. Market Analysis, Insights and Forecast - by Business Type
- 5.2.1. Warehousing
- 5.2.2. Distribution
- 5.2.3. Value-Added Services
- 5.3. Market Analysis, Insights and Forecast - by Mode of Operation
- 5.3.1. Storage
- 5.3.2. Roadways Distribution
- 5.3.3. Seaways Distribution
- 5.3.4. Others
- 5.4. Market Analysis, Insights and Forecast - by Region
- 5.4.1. North America
- 5.4.2. Europe
- 5.4.3. Asia Pacific
- 5.4.4. LAMEA
- 5.1. Market Analysis, Insights and Forecast - by End User
- 6. Green Logistics Market Analysis, Insights and Forecast, 2021-2033
- 6.1. Market Analysis, Insights and Forecast - by End User
- 6.1.1. Healthcare
- 6.1.2. Manufacturing
- 6.1.3. Automotive
- 6.1.4. Banking and Financial services
- 6.1.5. Retail and E-commerce
- 6.1.6. Others
- 6.2. Market Analysis, Insights and Forecast - by Business Type
- 6.2.1. Warehousing
- 6.2.2. Distribution
- 6.2.3. Value-Added Services
- 6.3. Market Analysis, Insights and Forecast - by Mode of Operation
- 6.3.1. Storage
- 6.3.2. Roadways Distribution
- 6.3.3. Seaways Distribution
- 6.3.4. Others
- 6.1. Market Analysis, Insights and Forecast - by End User
- 7. North America Green Logistics Market Analysis, Insights and Forecast, 2020-2032
- 7.1. Market Analysis, Insights and Forecast - by End User
- 7.1.1. Healthcare
- 7.1.2. Manufacturing
- 7.1.3. Automotive
- 7.1.4. Banking and Financial services
- 7.1.5. Retail and E-commerce
- 7.1.6. Others
- 7.2. Market Analysis, Insights and Forecast - by Business Type
- 7.2.1. Warehousing
- 7.2.2. Distribution
- 7.2.3. Value-Added Services
- 7.3. Market Analysis, Insights and Forecast - by Mode of Operation
- 7.3.1. Storage
- 7.3.2. Roadways Distribution
- 7.3.3. Seaways Distribution
- 7.3.4. Others
- 7.1. Market Analysis, Insights and Forecast - by End User
- 8. Europe Green Logistics Market Analysis, Insights and Forecast, 2020-2032
- 8.1. Market Analysis, Insights and Forecast - by End User
- 8.1.1. Healthcare
- 8.1.2. Manufacturing
- 8.1.3. Automotive
- 8.1.4. Banking and Financial services
- 8.1.5. Retail and E-commerce
- 8.1.6. Others
- 8.2. Market Analysis, Insights and Forecast - by Business Type
- 8.2.1. Warehousing
- 8.2.2. Distribution
- 8.2.3. Value-Added Services
- 8.3. Market Analysis, Insights and Forecast - by Mode of Operation
- 8.3.1. Storage
- 8.3.2. Roadways Distribution
- 8.3.3. Seaways Distribution
- 8.3.4. Others
- 8.1. Market Analysis, Insights and Forecast - by End User
- 9. Asia Pacific Green Logistics Market Analysis, Insights and Forecast, 2020-2032
- 9.1. Market Analysis, Insights and Forecast - by End User
- 9.1.1. Healthcare
- 9.1.2. Manufacturing
- 9.1.3. Automotive
- 9.1.4. Banking and Financial services
- 9.1.5. Retail and E-commerce
- 9.1.6. Others
- 9.2. Market Analysis, Insights and Forecast - by Business Type
- 9.2.1. Warehousing
- 9.2.2. Distribution
- 9.2.3. Value-Added Services
- 9.3. Market Analysis, Insights and Forecast - by Mode of Operation
- 9.3.1. Storage
- 9.3.2. Roadways Distribution
- 9.3.3. Seaways Distribution
- 9.3.4. Others
- 9.1. Market Analysis, Insights and Forecast - by End User
- 10. LAMEA Green Logistics Market Analysis, Insights and Forecast, 2020-2032
- 10.1. Market Analysis, Insights and Forecast - by End User
- 10.1.1. Healthcare
- 10.1.2. Manufacturing
- 10.1.3. Automotive
- 10.1.4. Banking and Financial services
- 10.1.5. Retail and E-commerce
- 10.1.6. Others
- 10.2. Market Analysis, Insights and Forecast - by Business Type
- 10.2.1. Warehousing
- 10.2.2. Distribution
- 10.2.3. Value-Added Services
- 10.3. Market Analysis, Insights and Forecast - by Mode of Operation
- 10.3.1. Storage
- 10.3.2. Roadways Distribution
- 10.3.3. Seaways Distribution
- 10.3.4. Others
- 10.1. Market Analysis, Insights and Forecast - by End User
- 11. Competitive Analysis
- 11.1. Company Profiles
- 11.1.1 Mahindra Logistics Ltd
- 11.1.1.1. Company Overview
- 11.1.1.2. Products
- 11.1.1.3. Company Financials
- 11.1.1.4. SWOT Analysis
- 11.1.2 CEVA Logistics**List Not Exhaustive 6 3 Other Companie
- 11.1.2.1. Company Overview
- 11.1.2.2. Products
- 11.1.2.3. Company Financials
- 11.1.2.4. SWOT Analysis
- 11.1.3 DHL International GmbH
- 11.1.3.1. Company Overview
- 11.1.3.2. Products
- 11.1.3.3. Company Financials
- 11.1.3.4. SWOT Analysis
- 11.1.4 AI Futtaim Logistics
- 11.1.4.1. Company Overview
- 11.1.4.2. Products
- 11.1.4.3. Company Financials
- 11.1.4.4. SWOT Analysis
- 11.1.5 United Parcel Service
- 11.1.5.1. Company Overview
- 11.1.5.2. Products
- 11.1.5.3. Company Financials
- 11.1.5.4. SWOT Analysis
- 11.1.6 Yusen Logistics Co Ltd
- 11.1.6.1. Company Overview
- 11.1.6.2. Products
- 11.1.6.3. Company Financials
- 11.1.6.4. SWOT Analysis
- 11.1.7 GEODIS
- 11.1.7.1. Company Overview
- 11.1.7.2. Products
- 11.1.7.3. Company Financials
- 11.1.7.4. SWOT Analysis
- 11.1.8 XPO Logistics
- 11.1.8.1. Company Overview
- 11.1.8.2. Products
- 11.1.8.3. Company Financials
- 11.1.8.4. SWOT Analysis
- 11.1.9 Agility Public Warehousing Company K S C P
- 11.1.9.1. Company Overview
- 11.1.9.2. Products
- 11.1.9.3. Company Financials
- 11.1.9.4. SWOT Analysis
- 11.1.10 Bollore Logistics
- 11.1.10.1. Company Overview
- 11.1.10.2. Products
- 11.1.10.3. Company Financials
- 11.1.10.4. SWOT Analysis
- 11.1.11 Bowling Green Logistics
- 11.1.11.1. Company Overview
- 11.1.11.2. Products
- 11.1.11.3. Company Financials
- 11.1.11.4. SWOT Analysis
- 11.1.1 Mahindra Logistics Ltd
- 11.2. Market Entropy
- 11.2.1 Company's Key Areas Served
- 11.2.2 Recent Developments
- 11.3. Company Market Share Analysis 2025
- 11.3.1 Top 5 Companies Market Share Analysis
- 11.3.2 Top 3 Companies Market Share Analysis
- 11.4. List of Potential Customers
- 12. Research Methodology
List of Figures
- Figure 1: Green Logistics Market Revenue Breakdown (Million, %) by Product 2025 & 2033
- Figure 2: Green Logistics Market Share (%) by Company 2025
List of Tables
- Table 1: Green Logistics Market Revenue Million Forecast, by End User 2020 & 2033
- Table 2: Green Logistics Market Revenue Million Forecast, by Business Type 2020 & 2033
- Table 3: Green Logistics Market Revenue Million Forecast, by Mode of Operation 2020 & 2033
- Table 4: Green Logistics Market Revenue Million Forecast, by Region 2020 & 2033
- Table 5: Green Logistics Market Revenue Million Forecast, by End User 2020 & 2033
- Table 6: Green Logistics Market Revenue Million Forecast, by Business Type 2020 & 2033
- Table 7: Green Logistics Market Revenue Million Forecast, by Mode of Operation 2020 & 2033
- Table 8: Green Logistics Market Revenue Million Forecast, by Country 2020 & 2033
- Table 9: US Green Logistics Market Revenue (Million) Forecast, by Application 2020 & 2033
- Table 10: Canada Green Logistics Market Revenue (Million) Forecast, by Application 2020 & 2033
- Table 11: Mexico Green Logistics Market Revenue (Million) Forecast, by Application 2020 & 2033
- Table 12: Green Logistics Market Revenue Million Forecast, by End User 2020 & 2033
- Table 13: Green Logistics Market Revenue Million Forecast, by Business Type 2020 & 2033
- Table 14: Green Logistics Market Revenue Million Forecast, by Mode of Operation 2020 & 2033
- Table 15: Green Logistics Market Revenue Million Forecast, by Country 2020 & 2033
- Table 16: Germany Green Logistics Market Revenue (Million) Forecast, by Application 2020 & 2033
- Table 17: UK Green Logistics Market Revenue (Million) Forecast, by Application 2020 & 2033
- Table 18: France Green Logistics Market Revenue (Million) Forecast, by Application 2020 & 2033
- Table 19: Russia Green Logistics Market Revenue (Million) Forecast, by Application 2020 & 2033
- Table 20: Spain Green Logistics Market Revenue (Million) Forecast, by Application 2020 & 2033
- Table 21: Rest of Europe Green Logistics Market Revenue (Million) Forecast, by Application 2020 & 2033
- Table 22: Green Logistics Market Revenue Million Forecast, by End User 2020 & 2033
- Table 23: Green Logistics Market Revenue Million Forecast, by Business Type 2020 & 2033
- Table 24: Green Logistics Market Revenue Million Forecast, by Mode of Operation 2020 & 2033
- Table 25: Green Logistics Market Revenue Million Forecast, by Country 2020 & 2033
- Table 26: India Green Logistics Market Revenue (Million) Forecast, by Application 2020 & 2033
- Table 27: China Green Logistics Market Revenue (Million) Forecast, by Application 2020 & 2033
- Table 28: Japan Green Logistics Market Revenue (Million) Forecast, by Application 2020 & 2033
- Table 29: South Korea Green Logistics Market Revenue (Million) Forecast, by Application 2020 & 2033
- Table 30: Rest of Asia Pacific Green Logistics Market Revenue (Million) Forecast, by Application 2020 & 2033
- Table 31: Green Logistics Market Revenue Million Forecast, by End User 2020 & 2033
- Table 32: Green Logistics Market Revenue Million Forecast, by Business Type 2020 & 2033
- Table 33: Green Logistics Market Revenue Million Forecast, by Mode of Operation 2020 & 2033
- Table 34: Green Logistics Market Revenue Million Forecast, by Country 2020 & 2033
- Table 35: Latin America Green Logistics Market Revenue (Million) Forecast, by Application 2020 & 2033
- Table 36: Middle East Green Logistics Market Revenue (Million) Forecast, by Application 2020 & 2033
- Table 37: Africa Green Logistics Market Revenue (Million) Forecast, by Application 2020 & 2033
Frequently Asked Questions
1. What is the projected Compound Annual Growth Rate (CAGR) of the Green Logistics Market?
The projected CAGR is approximately 8.29%.
2. Which companies are prominent players in the Green Logistics Market?
Key companies in the market include Mahindra Logistics Ltd, CEVA Logistics**List Not Exhaustive 6 3 Other Companie, DHL International GmbH, AI Futtaim Logistics, United Parcel Service, Yusen Logistics Co Ltd, GEODIS, XPO Logistics, Agility Public Warehousing Company K S C P, Bollore Logistics, Bowling Green Logistics.
3. What are the main segments of the Green Logistics Market?
The market segments include End User, Business Type, Mode of Operation.
4. Can you provide details about the market size?
The market size is estimated to be USD 1.28 Million as of 2022.
5. What are some drivers contributing to market growth?
Growing adoption of EVs in the logistics industry; Increase in adoption of artificial intelligence (AI) in the global logistics industry.
6. What are the notable trends driving market growth?
The Demand for Green Warehouses is Rising.
7. Are there any restraints impacting market growth?
Dependency on fossil fuels. majority for transportation; The high costs of implementing green procurement practices discourage potential investors.
8. Can you provide examples of recent developments in the market?
N/A
9. What pricing options are available for accessing the report?
Pricing options include single-user, multi-user, and enterprise licenses priced at USD 3800, USD 4500, and USD 5800 respectively.
10. Is the market size provided in terms of value or volume?
The market size is provided in terms of value, measured in Million.
11. Are there any specific market keywords associated with the report?
Yes, the market keyword associated with the report is "Green Logistics Market," which aids in identifying and referencing the specific market segment covered.
12. How do I determine which pricing option suits my needs best?
The pricing options vary based on user requirements and access needs. Individual users may opt for single-user licenses, while businesses requiring broader access may choose multi-user or enterprise licenses for cost-effective access to the report.
13. Are there any additional resources or data provided in the Green Logistics Market report?
While the report offers comprehensive insights, it's advisable to review the specific contents or supplementary materials provided to ascertain if additional resources or data are available.
14. How can I stay updated on further developments or reports in the Green Logistics Market?
To stay informed about further developments, trends, and reports in the Green Logistics Market, consider subscribing to industry newsletters, following relevant companies and organizations, or regularly checking reputable industry news sources and publications.
Methodology
Step 1 - Identification of Relevant Samples Size from Population Database


Step 2 - Approaches for Defining Global Market Size (Value, Volume* & Price*)

Note*: In applicable scenarios
Step 3 - Data Sources
Primary Research
- Web Analytics
- Survey Reports
- Research Institute
- Latest Research Reports
- Opinion Leaders
Secondary Research
- Annual Reports
- White Paper
- Latest Press Release
- Industry Association
- Paid Database
- Investor Presentations

Step 4 - Data Triangulation
Involves using different sources of information in order to increase the validity of a study
These sources are likely to be stakeholders in a program - participants, other researchers, program staff, other community members, and so on.
Then we put all data in single framework & apply various statistical tools to find out the dynamic on the market.
During the analysis stage, feedback from the stakeholder groups would be compared to determine areas of agreement as well as areas of divergence