

Key Insights
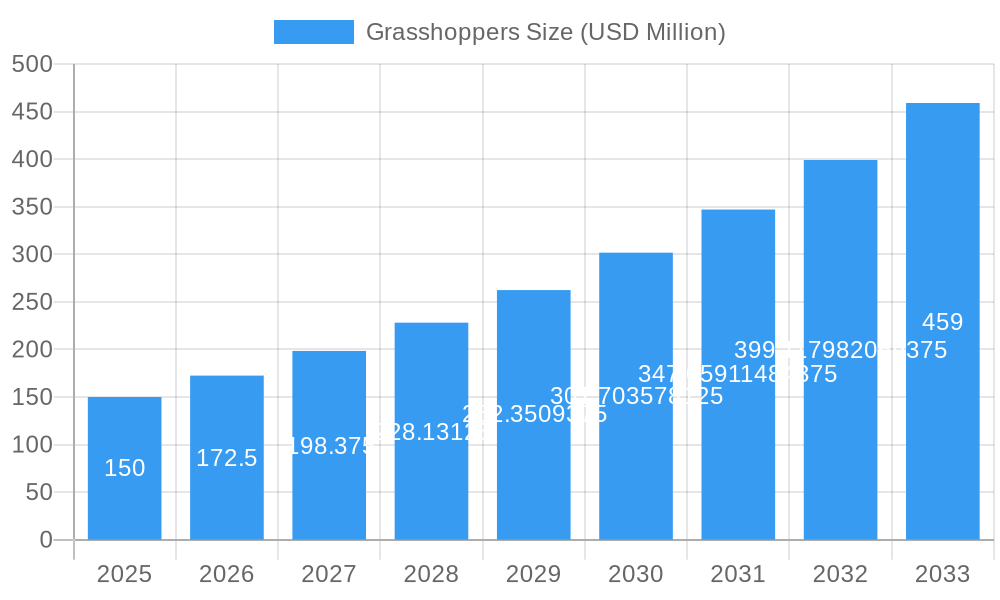
The global grasshopper market is poised for substantial growth, projected to reach an estimated $150 million in 2025, with a compelling Compound Annual Growth Rate (CAGR) of 15% during the forecast period of 2025-2033. This remarkable expansion is primarily fueled by the escalating demand for sustainable and protein-rich food sources. As global populations continue to rise and traditional protein sources face environmental pressures, insects, particularly grasshoppers, are emerging as a viable and attractive alternative. The inherent nutritional benefits of grasshoppers, including high protein content, essential amino acids, and a lower environmental footprint compared to conventional livestock, are driving consumer adoption and industry investment. Furthermore, innovative processing techniques and the development of diverse product applications, ranging from snack foods and protein powders to animal feed, are creating new avenues for market penetration and revenue generation. The increasing awareness among consumers about the environmental and health benefits of entomophagy (insect consumption) is a significant catalyst for this market's ascent.
Grasshoppers Market Size (In Million)
The market's trajectory is further supported by ongoing research and development focused on optimizing grasshopper farming practices and expanding their culinary appeal. While the market is experiencing robust growth, certain restraints, such as consumer perception and regulatory hurdles in some regions, need to be addressed to unlock its full potential. However, the strong underlying drivers of sustainability, nutrition, and innovation are expected to overcome these challenges. Key players in the market are actively investing in research, expanding production capabilities, and forging strategic partnerships to capitalize on this burgeoning opportunity. The Asia Pacific region, particularly China and India, is anticipated to be a significant contributor to market growth, driven by established cultural acceptance of insect consumption and a large, growing population. North America and Europe are also witnessing a surge in interest, propelled by health-conscious consumers and a growing acceptance of novel food products.
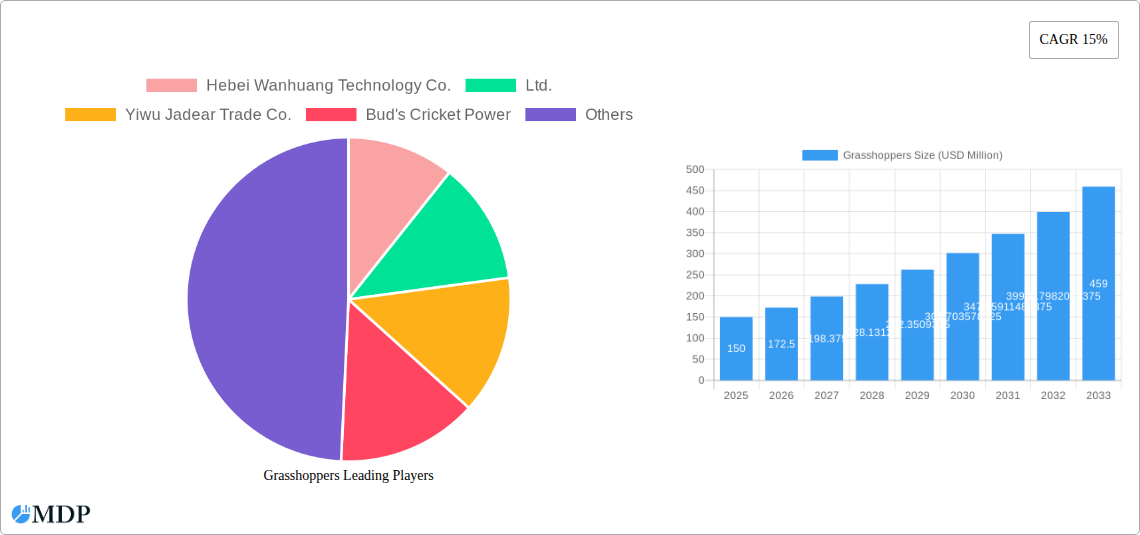
Grasshoppers Company Market Share
Grasshoppers Market Report: In-depth Analysis and Future Outlook (2019–2033)
This comprehensive report delves deep into the burgeoning global grasshoppers market, offering an unparalleled analysis of its dynamics, trends, and future potential. Designed for industry stakeholders, investors, and researchers, this report provides actionable insights and data-driven forecasts to navigate this rapidly evolving sector. The study covers a detailed Study Period: 2019–2033, with Base Year: 2025 and an Estimated Year: 2025, projecting a robust Forecast Period: 2025–2033 based on the Historical Period: 2019–2024. Expect to uncover critical information on market size, growth drivers, competitive landscapes, and emerging opportunities within the edible insects and alternative protein industries.
Grasshoppers Market Dynamics & Concentration
The global grasshoppers market, a significant segment within the broader alternative protein industry, exhibits moderate to high concentration, with key players increasingly investing in research and development. Innovation drivers are primarily fueled by the growing demand for sustainable and nutritious food sources, coupled with advancements in insect farming technologies. Regulatory frameworks are gradually evolving to support the commercialization of entomophagy, though variations exist across different regions, impacting market entry and scalability. Product substitutes, including other edible insects and plant-based proteins, pose a competitive challenge, necessitating strategic differentiation and market education. End-user trends showcase a growing acceptance of grasshoppers as a food ingredient, particularly in protein bars, snacks, and as a flour substitute. Merger and acquisition (M&A) activities are anticipated to increase as larger food corporations recognize the potential of this market. Market share within specific niches is dynamic, with early-mover advantage being crucial. We anticipate approximately 45 M&A deal counts within the forecast period, signifying consolidation and strategic expansion efforts from leading companies.
Grasshoppers Industry Trends & Analysis
The grasshoppers industry is poised for significant expansion, driven by a confluence of factors that are reshaping the global food landscape. The Compound Annual Growth Rate (CAGR) for the grasshoppers market is projected to be a remarkable 22.5% between 2025 and 2033, a testament to its increasing mainstream appeal. Market penetration is steadily rising, moving beyond niche markets into broader consumer segments. This growth is underpinned by heightened consumer awareness regarding the environmental benefits of insect farming, such as significantly lower land and water usage compared to traditional livestock. Furthermore, the nutritional profile of grasshoppers, rich in protein, essential amino acids, and micronutrients, aligns perfectly with the growing demand for health-conscious food options. Technological disruptions in insect farming, including automated rearing systems, improved feed formulations, and efficient processing techniques, are crucial in driving down production costs and enhancing scalability. Consumer preferences are shifting towards novel food experiences and sustainable choices, with grasshoppers offering a unique proposition. Competitive dynamics are intensifying, with both established food giants and agile startups vying for market share. The development of palatable and appealing grasshopper-based products, such as seasoned snacks and protein powders, is instrumental in overcoming traditional aversions and fostering wider adoption.
Leading Markets & Segments in Grasshoppers
The North America region currently dominates the global grasshoppers market, with the United States leading in terms of consumption and product innovation. This dominance is fueled by strong economic policies that support novel food technologies and a well-developed research infrastructure. The Application: Food & Beverage segment holds the largest market share, accounting for over 70% of the total market value. Within this segment, Types: Whole Insects are popular for snacks, while Types: Insect Powders/Flours are gaining traction as versatile ingredients in processed foods.
- Key Drivers for North American Dominance:
- Government Support & Funding: Significant research grants and supportive policies for alternative protein development.
- Consumer Acceptance: A higher level of openness to entomophagy compared to other regions, driven by health and sustainability consciousness.
- Investment Landscape: Robust venture capital funding flowing into insect farming and food tech startups.
- Technological Advancements: Leading in the development and implementation of advanced insect farming technologies.
The Europe market follows closely, with countries like the Netherlands and the UK showing substantial growth. The Application: Animal Feed segment is also a significant contributor, particularly in aquaculture and pet food, driven by the need for sustainable and protein-rich feed alternatives. Types: Insect Protein Concentrates are gaining prominence in this segment due to their ease of integration into existing feed formulations.
- Key Drivers for European Growth:
- Strict Environmental Regulations: Driving demand for sustainable food and feed solutions.
- EU Food Safety Standards: Providing a clear regulatory pathway for edible insects.
- Growing Demand for Sustainable Pet Food: A significant driver for the animal feed segment.
The Asia-Pacific region, while historically having traditional consumption, is witnessing a surge in commercialization, particularly in countries like Thailand and Vietnam, driven by a combination of cultural acceptance and increasing export opportunities.
Grasshoppers Product Developments
Product development in the grasshoppers sector is characterized by innovation aimed at enhancing palatability, convenience, and nutritional value. Companies are increasingly focusing on creating diverse product formats, from seasoned whole-roasted grasshoppers for snacking to finely milled grasshopper powders used as protein fortification in baked goods, pasta, and protein bars. These innovations leverage the inherent nutritional benefits of grasshoppers, such as high protein content and essential fatty acids, while addressing consumer taste preferences through various flavor profiles and culinary applications. The competitive advantage lies in creating products that are both novel and accessible, effectively bridging the gap between traditional entomophagy and modern food markets.
Key Drivers of Grasshoppers Growth
The grasshoppers market's growth is propelled by several interconnected factors. Technological advancements in insect farming, including automation and optimized rearing environments, are crucial for scaling production and reducing costs. Economic factors such as the rising global demand for protein, coupled with the need for sustainable food systems, are significant market drivers. Regulatory support, with evolving food safety standards and approvals for edible insects in key markets, is also a critical enabler. For instance, recent approvals in countries like the United States and Canada have opened up new avenues for market expansion. The increasing consumer awareness of environmental sustainability and the lower ecological footprint of insect farming compared to traditional livestock is also a powerful catalyst.
Challenges in the Grasshoppers Market
Despite its promising outlook, the grasshoppers market faces several challenges. Regulatory hurdles remain a significant restraint, with varying and sometimes restrictive legislation across different countries creating complexities for market entry and international trade. Supply chain issues, including the need for standardized and efficient rearing, harvesting, and processing infrastructure, can impact scalability and cost-effectiveness. Consumer perception and acceptance, often rooted in cultural taboos and aversions, require substantial market education and product innovation to overcome. Competitive pressures from established alternative protein sources, such as plant-based proteins and conventional meat, necessitate continuous differentiation and value proposition development. The estimated cost of scaling production while maintaining competitive pricing is a key challenge, potentially increasing market entry barriers by 15%.
Emerging Opportunities in Grasshoppers
Emerging opportunities in the grasshoppers market are abundant, driven by innovation and evolving consumer demands. Technological breakthroughs in areas like precision fermentation for insect protein isolates and the development of AI-driven insect farming management systems present significant growth potential. Strategic partnerships between insect farming companies and major food manufacturers, as well as retailers, are crucial for market penetration and product distribution. Furthermore, the expansion into new geographic markets with growing interest in sustainable food solutions and the exploration of novel applications in the pharmaceutical and cosmetic industries represent promising long-term growth catalysts. The development of specialized grasshopper strains for enhanced nutritional profiles could also unlock new market segments.
Leading Players in the Grasshoppers Sector
- Hebei Wanhuang Technology Co.,Ltd.
- Yiwu Jadear Trade Co.,Ltd.
- Bud's Cricket Power
- Crunchy Critters
- Shandong Danqing Agricultural Development Co.,Ltd.
- Hargol FoodTech
Key Milestones in Grasshoppers Industry
- 2019: Increased investment in insect farming startups, signaling growing industry confidence.
- 2020: Development of novel grasshopper protein bar formulations gaining consumer traction.
- 2021: Expansion of regulatory approvals for edible insects in several European countries.
- 2022: Introduction of grasshopper flour as a sustainable ingredient in gluten-free baking.
- 2023: Significant advancements in automated insect farming technologies for commercial scalability.
- 2024: Launch of a major consumer awareness campaign to demystify entomophagy in North America.
Strategic Outlook for Grasshoppers Market
The strategic outlook for the grasshoppers market is overwhelmingly positive, driven by a sustained increase in demand for sustainable and nutritious protein alternatives. Growth accelerators include continued technological innovation in insect farming efficiency and product development, leading to wider consumer acceptance and market penetration. Strategic opportunities lie in fostering collaborations between insect producers and established food brands, thereby leveraging existing distribution networks and brand trust. Expansion into new international markets with supportive regulatory environments and growing consumer interest in novel foods will be crucial. Furthermore, the development of diverse applications beyond food, such as in animal feed and potentially in nutraceuticals, will contribute to long-term market resilience and value creation.
Grasshoppers Segmentation
- 1. Application
- 2. Types
Grasshoppers Segmentation By Geography
-
1. North America
- 1.1. United States
- 1.2. Canada
- 1.3. Mexico
-
2. South America
- 2.1. Brazil
- 2.2. Argentina
- 2.3. Rest of South America
-
3. Europe
- 3.1. United Kingdom
- 3.2. Germany
- 3.3. France
- 3.4. Italy
- 3.5. Spain
- 3.6. Russia
- 3.7. Benelux
- 3.8. Nordics
- 3.9. Rest of Europe
-
4. Middle East & Africa
- 4.1. Turkey
- 4.2. Israel
- 4.3. GCC
- 4.4. North Africa
- 4.5. South Africa
- 4.6. Rest of Middle East & Africa
-
5. Asia Pacific
- 5.1. China
- 5.2. India
- 5.3. Japan
- 5.4. South Korea
- 5.5. ASEAN
- 5.6. Oceania
- 5.7. Rest of Asia Pacific
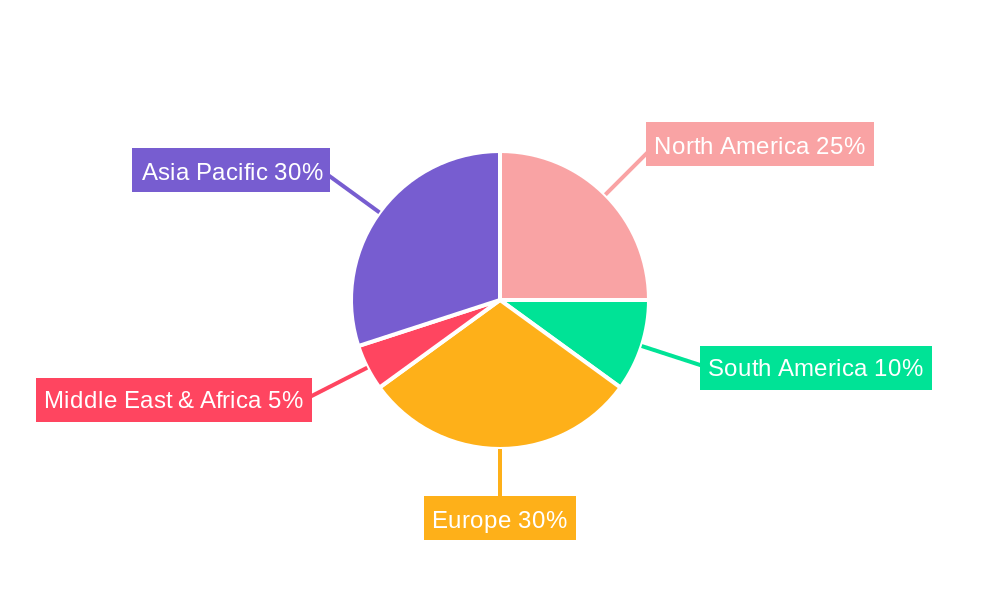
Grasshoppers Regional Market Share
Geographic Coverage of Grasshoppers
Grasshoppers REPORT HIGHLIGHTS
| Aspects | Details |
|---|---|
| Study Period | 2020-2034 |
| Base Year | 2025 |
| Estimated Year | 2026 |
| Forecast Period | 2026-2034 |
| Historical Period | 2020-2025 |
| Growth Rate | CAGR of 23.07% from 2020-2034 |
| Segmentation |
|
Table of Contents
- 1. Introduction
- 1.1. Research Scope
- 1.2. Market Segmentation
- 1.3. Research Methodology
- 1.4. Definitions and Assumptions
- 2. Executive Summary
- 2.1. Introduction
- 3. Market Dynamics
- 3.1. Introduction
- 3.2. Market Drivers
- 3.3. Market Restrains
- 3.4. Market Trends
- 4. Market Factor Analysis
- 4.1. Porters Five Forces
- 4.2. Supply/Value Chain
- 4.3. PESTEL analysis
- 4.4. Market Entropy
- 4.5. Patent/Trademark Analysis
- 5. Global Grasshoppers Analysis, Insights and Forecast, 2020-2032
- 5.1. Market Analysis, Insights and Forecast - by Application
- 5.2. Market Analysis, Insights and Forecast - by Types
- 5.3. Market Analysis, Insights and Forecast - by Region
- 5.3.1. North America
- 5.3.2. South America
- 5.3.3. Europe
- 5.3.4. Middle East & Africa
- 5.3.5. Asia Pacific
- 5.1. Market Analysis, Insights and Forecast - by Application
- 6. North America Grasshoppers Analysis, Insights and Forecast, 2020-2032
- 6.1. Market Analysis, Insights and Forecast - by Application
- 6.2. Market Analysis, Insights and Forecast - by Types
- 6.1. Market Analysis, Insights and Forecast - by Application
- 7. South America Grasshoppers Analysis, Insights and Forecast, 2020-2032
- 7.1. Market Analysis, Insights and Forecast - by Application
- 7.2. Market Analysis, Insights and Forecast - by Types
- 7.1. Market Analysis, Insights and Forecast - by Application
- 8. Europe Grasshoppers Analysis, Insights and Forecast, 2020-2032
- 8.1. Market Analysis, Insights and Forecast - by Application
- 8.2. Market Analysis, Insights and Forecast - by Types
- 8.1. Market Analysis, Insights and Forecast - by Application
- 9. Middle East & Africa Grasshoppers Analysis, Insights and Forecast, 2020-2032
- 9.1. Market Analysis, Insights and Forecast - by Application
- 9.2. Market Analysis, Insights and Forecast - by Types
- 9.1. Market Analysis, Insights and Forecast - by Application
- 10. Asia Pacific Grasshoppers Analysis, Insights and Forecast, 2020-2032
- 10.1. Market Analysis, Insights and Forecast - by Application
- 10.2. Market Analysis, Insights and Forecast - by Types
- 10.1. Market Analysis, Insights and Forecast - by Application
- 11. Competitive Analysis
- 11.1. Global Market Share Analysis 2025
- 11.2. Company Profiles
- 11.2.1 Hebei Wanhuang Technology Co.
- 11.2.1.1. Overview
- 11.2.1.2. Products
- 11.2.1.3. SWOT Analysis
- 11.2.1.4. Recent Developments
- 11.2.1.5. Financials (Based on Availability)
- 11.2.2 Ltd.
- 11.2.2.1. Overview
- 11.2.2.2. Products
- 11.2.2.3. SWOT Analysis
- 11.2.2.4. Recent Developments
- 11.2.2.5. Financials (Based on Availability)
- 11.2.3 Yiwu Jadear Trade Co.
- 11.2.3.1. Overview
- 11.2.3.2. Products
- 11.2.3.3. SWOT Analysis
- 11.2.3.4. Recent Developments
- 11.2.3.5. Financials (Based on Availability)
- 11.2.4 Ltd.
- 11.2.4.1. Overview
- 11.2.4.2. Products
- 11.2.4.3. SWOT Analysis
- 11.2.4.4. Recent Developments
- 11.2.4.5. Financials (Based on Availability)
- 11.2.5 Bud's Cricket Power
- 11.2.5.1. Overview
- 11.2.5.2. Products
- 11.2.5.3. SWOT Analysis
- 11.2.5.4. Recent Developments
- 11.2.5.5. Financials (Based on Availability)
- 11.2.6 Crunchy Critters
- 11.2.6.1. Overview
- 11.2.6.2. Products
- 11.2.6.3. SWOT Analysis
- 11.2.6.4. Recent Developments
- 11.2.6.5. Financials (Based on Availability)
- 11.2.7 Shandong Danqing Agricultural Development Co.
- 11.2.7.1. Overview
- 11.2.7.2. Products
- 11.2.7.3. SWOT Analysis
- 11.2.7.4. Recent Developments
- 11.2.7.5. Financials (Based on Availability)
- 11.2.8 Ltd.
- 11.2.8.1. Overview
- 11.2.8.2. Products
- 11.2.8.3. SWOT Analysis
- 11.2.8.4. Recent Developments
- 11.2.8.5. Financials (Based on Availability)
- 11.2.9 Hargol FoodTech
- 11.2.9.1. Overview
- 11.2.9.2. Products
- 11.2.9.3. SWOT Analysis
- 11.2.9.4. Recent Developments
- 11.2.9.5. Financials (Based on Availability)
- 11.2.1 Hebei Wanhuang Technology Co.
List of Figures
- Figure 1: Global Grasshoppers Revenue Breakdown (undefined, %) by Region 2025 & 2033
- Figure 2: North America Grasshoppers Revenue (undefined), by Application 2025 & 2033
- Figure 3: North America Grasshoppers Revenue Share (%), by Application 2025 & 2033
- Figure 4: North America Grasshoppers Revenue (undefined), by Types 2025 & 2033
- Figure 5: North America Grasshoppers Revenue Share (%), by Types 2025 & 2033
- Figure 6: North America Grasshoppers Revenue (undefined), by Country 2025 & 2033
- Figure 7: North America Grasshoppers Revenue Share (%), by Country 2025 & 2033
- Figure 8: South America Grasshoppers Revenue (undefined), by Application 2025 & 2033
- Figure 9: South America Grasshoppers Revenue Share (%), by Application 2025 & 2033
- Figure 10: South America Grasshoppers Revenue (undefined), by Types 2025 & 2033
- Figure 11: South America Grasshoppers Revenue Share (%), by Types 2025 & 2033
- Figure 12: South America Grasshoppers Revenue (undefined), by Country 2025 & 2033
- Figure 13: South America Grasshoppers Revenue Share (%), by Country 2025 & 2033
- Figure 14: Europe Grasshoppers Revenue (undefined), by Application 2025 & 2033
- Figure 15: Europe Grasshoppers Revenue Share (%), by Application 2025 & 2033
- Figure 16: Europe Grasshoppers Revenue (undefined), by Types 2025 & 2033
- Figure 17: Europe Grasshoppers Revenue Share (%), by Types 2025 & 2033
- Figure 18: Europe Grasshoppers Revenue (undefined), by Country 2025 & 2033
- Figure 19: Europe Grasshoppers Revenue Share (%), by Country 2025 & 2033
- Figure 20: Middle East & Africa Grasshoppers Revenue (undefined), by Application 2025 & 2033
- Figure 21: Middle East & Africa Grasshoppers Revenue Share (%), by Application 2025 & 2033
- Figure 22: Middle East & Africa Grasshoppers Revenue (undefined), by Types 2025 & 2033
- Figure 23: Middle East & Africa Grasshoppers Revenue Share (%), by Types 2025 & 2033
- Figure 24: Middle East & Africa Grasshoppers Revenue (undefined), by Country 2025 & 2033
- Figure 25: Middle East & Africa Grasshoppers Revenue Share (%), by Country 2025 & 2033
- Figure 26: Asia Pacific Grasshoppers Revenue (undefined), by Application 2025 & 2033
- Figure 27: Asia Pacific Grasshoppers Revenue Share (%), by Application 2025 & 2033
- Figure 28: Asia Pacific Grasshoppers Revenue (undefined), by Types 2025 & 2033
- Figure 29: Asia Pacific Grasshoppers Revenue Share (%), by Types 2025 & 2033
- Figure 30: Asia Pacific Grasshoppers Revenue (undefined), by Country 2025 & 2033
- Figure 31: Asia Pacific Grasshoppers Revenue Share (%), by Country 2025 & 2033
List of Tables
- Table 1: Global Grasshoppers Revenue undefined Forecast, by Application 2020 & 2033
- Table 2: Global Grasshoppers Revenue undefined Forecast, by Types 2020 & 2033
- Table 3: Global Grasshoppers Revenue undefined Forecast, by Region 2020 & 2033
- Table 4: Global Grasshoppers Revenue undefined Forecast, by Application 2020 & 2033
- Table 5: Global Grasshoppers Revenue undefined Forecast, by Types 2020 & 2033
- Table 6: Global Grasshoppers Revenue undefined Forecast, by Country 2020 & 2033
- Table 7: United States Grasshoppers Revenue (undefined) Forecast, by Application 2020 & 2033
- Table 8: Canada Grasshoppers Revenue (undefined) Forecast, by Application 2020 & 2033
- Table 9: Mexico Grasshoppers Revenue (undefined) Forecast, by Application 2020 & 2033
- Table 10: Global Grasshoppers Revenue undefined Forecast, by Application 2020 & 2033
- Table 11: Global Grasshoppers Revenue undefined Forecast, by Types 2020 & 2033
- Table 12: Global Grasshoppers Revenue undefined Forecast, by Country 2020 & 2033
- Table 13: Brazil Grasshoppers Revenue (undefined) Forecast, by Application 2020 & 2033
- Table 14: Argentina Grasshoppers Revenue (undefined) Forecast, by Application 2020 & 2033
- Table 15: Rest of South America Grasshoppers Revenue (undefined) Forecast, by Application 2020 & 2033
- Table 16: Global Grasshoppers Revenue undefined Forecast, by Application 2020 & 2033
- Table 17: Global Grasshoppers Revenue undefined Forecast, by Types 2020 & 2033
- Table 18: Global Grasshoppers Revenue undefined Forecast, by Country 2020 & 2033
- Table 19: United Kingdom Grasshoppers Revenue (undefined) Forecast, by Application 2020 & 2033
- Table 20: Germany Grasshoppers Revenue (undefined) Forecast, by Application 2020 & 2033
- Table 21: France Grasshoppers Revenue (undefined) Forecast, by Application 2020 & 2033
- Table 22: Italy Grasshoppers Revenue (undefined) Forecast, by Application 2020 & 2033
- Table 23: Spain Grasshoppers Revenue (undefined) Forecast, by Application 2020 & 2033
- Table 24: Russia Grasshoppers Revenue (undefined) Forecast, by Application 2020 & 2033
- Table 25: Benelux Grasshoppers Revenue (undefined) Forecast, by Application 2020 & 2033
- Table 26: Nordics Grasshoppers Revenue (undefined) Forecast, by Application 2020 & 2033
- Table 27: Rest of Europe Grasshoppers Revenue (undefined) Forecast, by Application 2020 & 2033
- Table 28: Global Grasshoppers Revenue undefined Forecast, by Application 2020 & 2033
- Table 29: Global Grasshoppers Revenue undefined Forecast, by Types 2020 & 2033
- Table 30: Global Grasshoppers Revenue undefined Forecast, by Country 2020 & 2033
- Table 31: Turkey Grasshoppers Revenue (undefined) Forecast, by Application 2020 & 2033
- Table 32: Israel Grasshoppers Revenue (undefined) Forecast, by Application 2020 & 2033
- Table 33: GCC Grasshoppers Revenue (undefined) Forecast, by Application 2020 & 2033
- Table 34: North Africa Grasshoppers Revenue (undefined) Forecast, by Application 2020 & 2033
- Table 35: South Africa Grasshoppers Revenue (undefined) Forecast, by Application 2020 & 2033
- Table 36: Rest of Middle East & Africa Grasshoppers Revenue (undefined) Forecast, by Application 2020 & 2033
- Table 37: Global Grasshoppers Revenue undefined Forecast, by Application 2020 & 2033
- Table 38: Global Grasshoppers Revenue undefined Forecast, by Types 2020 & 2033
- Table 39: Global Grasshoppers Revenue undefined Forecast, by Country 2020 & 2033
- Table 40: China Grasshoppers Revenue (undefined) Forecast, by Application 2020 & 2033
- Table 41: India Grasshoppers Revenue (undefined) Forecast, by Application 2020 & 2033
- Table 42: Japan Grasshoppers Revenue (undefined) Forecast, by Application 2020 & 2033
- Table 43: South Korea Grasshoppers Revenue (undefined) Forecast, by Application 2020 & 2033
- Table 44: ASEAN Grasshoppers Revenue (undefined) Forecast, by Application 2020 & 2033
- Table 45: Oceania Grasshoppers Revenue (undefined) Forecast, by Application 2020 & 2033
- Table 46: Rest of Asia Pacific Grasshoppers Revenue (undefined) Forecast, by Application 2020 & 2033
Frequently Asked Questions
1. What is the projected Compound Annual Growth Rate (CAGR) of the Grasshoppers?
The projected CAGR is approximately 23.07%.
2. Which companies are prominent players in the Grasshoppers?
Key companies in the market include Hebei Wanhuang Technology Co., Ltd., Yiwu Jadear Trade Co., Ltd., Bud's Cricket Power, Crunchy Critters, Shandong Danqing Agricultural Development Co., Ltd., Hargol FoodTech.
3. What are the main segments of the Grasshoppers?
The market segments include Application, Types.
4. Can you provide details about the market size?
The market size is estimated to be USD XXX N/A as of 2022.
5. What are some drivers contributing to market growth?
N/A
6. What are the notable trends driving market growth?
N/A
7. Are there any restraints impacting market growth?
N/A
8. Can you provide examples of recent developments in the market?
N/A
9. What pricing options are available for accessing the report?
Pricing options include single-user, multi-user, and enterprise licenses priced at USD 5600.00, USD 8400.00, and USD 11200.00 respectively.
10. Is the market size provided in terms of value or volume?
The market size is provided in terms of value, measured in N/A.
11. Are there any specific market keywords associated with the report?
Yes, the market keyword associated with the report is "Grasshoppers," which aids in identifying and referencing the specific market segment covered.
12. How do I determine which pricing option suits my needs best?
The pricing options vary based on user requirements and access needs. Individual users may opt for single-user licenses, while businesses requiring broader access may choose multi-user or enterprise licenses for cost-effective access to the report.
13. Are there any additional resources or data provided in the Grasshoppers report?
While the report offers comprehensive insights, it's advisable to review the specific contents or supplementary materials provided to ascertain if additional resources or data are available.
14. How can I stay updated on further developments or reports in the Grasshoppers?
To stay informed about further developments, trends, and reports in the Grasshoppers, consider subscribing to industry newsletters, following relevant companies and organizations, or regularly checking reputable industry news sources and publications.
Methodology
Step 1 - Identification of Relevant Samples Size from Population Database


Step 2 - Approaches for Defining Global Market Size (Value, Volume* & Price*)

Note*: In applicable scenarios
Step 3 - Data Sources
Primary Research
- Web Analytics
- Survey Reports
- Research Institute
- Latest Research Reports
- Opinion Leaders
Secondary Research
- Annual Reports
- White Paper
- Latest Press Release
- Industry Association
- Paid Database
- Investor Presentations

Step 4 - Data Triangulation
Involves using different sources of information in order to increase the validity of a study
These sources are likely to be stakeholders in a program - participants, other researchers, program staff, other community members, and so on.
Then we put all data in single framework & apply various statistical tools to find out the dynamic on the market.
During the analysis stage, feedback from the stakeholder groups would be compared to determine areas of agreement as well as areas of divergence