

Key Insights
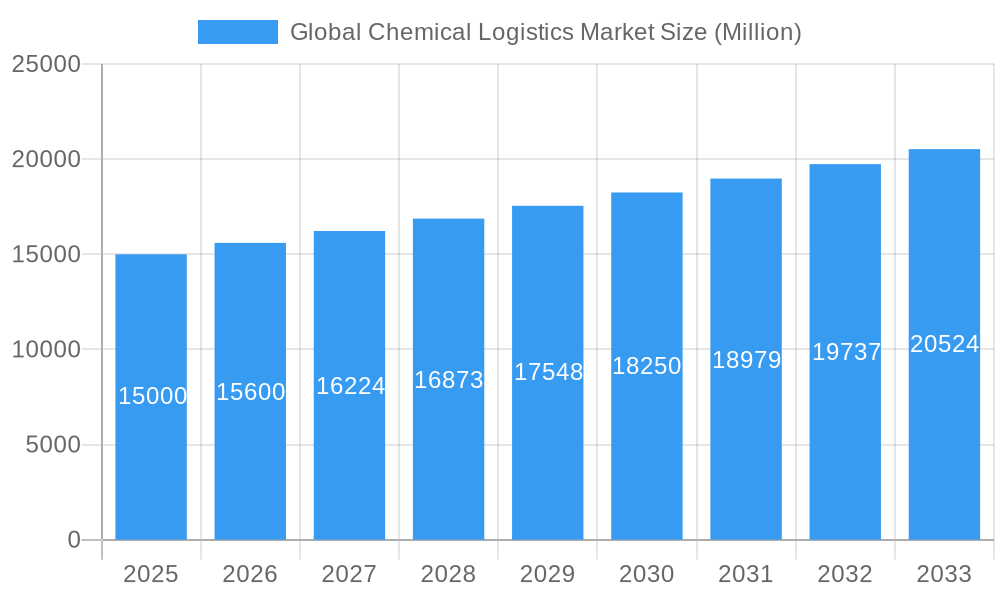
The global chemical logistics market is experiencing robust growth, driven by the expanding chemical industry and increasing demand for efficient and reliable transportation and handling of hazardous materials. The market's compound annual growth rate (CAGR) exceeding 4% indicates a consistently expanding market size, projected to reach significant value by 2033. Key drivers include the rising global demand for chemicals across various end-use sectors like pharmaceuticals, cosmetics, and oil & gas, necessitating sophisticated logistics solutions. Furthermore, the increasing focus on sustainability and the adoption of green logistics practices are creating new opportunities within the sector. Growth is further fueled by advancements in technology, such as real-time tracking and inventory management systems, enhancing supply chain visibility and efficiency. However, challenges remain, including fluctuating fuel prices, stringent regulations concerning hazardous material transportation, and potential disruptions caused by geopolitical instability. The market is segmented by service type (transportation, warehousing, consulting, etc.), mode of transportation (road, rail, air, sea, pipeline), and end-user industry, allowing for a granular understanding of market dynamics and identifying specific growth areas. North America and Europe currently hold significant market share, but the Asia-Pacific region is projected to experience substantial growth due to rapid industrialization and economic expansion. The competitive landscape is characterized by a mix of large multinational logistics providers and specialized chemical logistics companies, indicating a dynamic and evolving market.
Global Chemical Logistics Market Market Size (In Billion)
The market's segmentation allows for targeted strategies. For example, the pharmaceutical industry's stringent quality and temperature control needs drive demand for specialized transportation and warehousing services. Similarly, the oil and gas industry requires robust pipeline and tanker logistics, emphasizing safety and efficiency. Understanding these nuances is crucial for players aiming to capture significant market share. Future growth will likely be shaped by increasing automation in warehousing, advancements in transportation technology (e.g., autonomous vehicles), and greater emphasis on sustainable and environmentally responsible practices. The continued focus on optimizing supply chain efficiency and reducing operational costs will further drive market expansion. Strategic partnerships and mergers and acquisitions among market players are anticipated as companies strive to enhance their capabilities and expand their reach. Investing in cutting-edge technology and focusing on regulatory compliance will be essential for success in this growing and complex market.
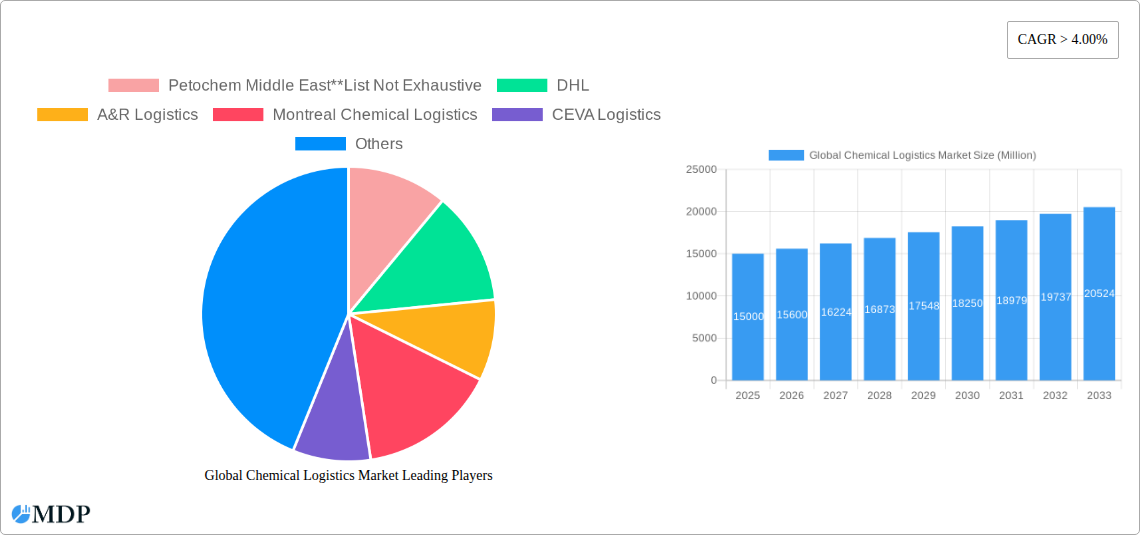
Global Chemical Logistics Market Company Market Share
Unlock Growth Potential: The Comprehensive Global Chemical Logistics Market Report (2019-2033)
This in-depth report provides a comprehensive analysis of the Global Chemical Logistics Market, offering invaluable insights for stakeholders across the chemical and logistics industries. From market dynamics and leading players to emerging opportunities and future projections, this report is your essential guide to navigating this dynamic sector. With a study period spanning 2019-2033, a base year of 2025, and a forecast period of 2025-2033, this report offers a robust historical perspective and future-focused predictions. The market is expected to reach xx Million by 2033, exhibiting a CAGR of xx% during the forecast period.
Global Chemical Logistics Market Market Dynamics & Concentration
The global chemical logistics market is characterized by a moderately concentrated landscape with key players vying for market share. Market concentration is influenced by factors such as the scale of operations, geographical reach, and specialized service offerings. The top 5 players collectively hold approximately xx% of the market share in 2025, with DHL and other multinational logistics providers dominating. Innovation is driven by the need for enhanced efficiency, improved safety, and sustainable practices. Stringent regulatory frameworks, especially concerning the handling of hazardous chemicals, significantly influence operational strategies. Product substitution is limited due to the specialized nature of chemical transportation and handling, although the increasing adoption of green logistics solutions presents a key area for innovation. End-user trends towards just-in-time inventory management and supply chain optimization are shaping demand. The past five years witnessed xx M&A deals, reflecting the industry's consolidation and expansion efforts.
- Market Share: Top 5 players: xx% (2025)
- M&A Activity: xx deals (2019-2024)
- Key Innovation Drivers: Sustainability, Automation, Digitalization
- Regulatory Impact: Stringent regulations on hazardous materials handling
Global Chemical Logistics Market Industry Trends & Analysis
The global chemical logistics market is experiencing robust growth, propelled by several key factors. The increasing demand for chemical products across various industries, including pharmaceuticals, cosmetics, and oil & gas, fuels market expansion. Technological disruptions, particularly in the form of advanced tracking systems, automation, and data analytics, are revolutionizing logistics efficiency and transparency. Consumer preferences are shifting towards sustainable and environmentally friendly logistics solutions, creating new opportunities for green logistics providers. Competitive dynamics are intensifying, with players focusing on differentiation through specialized services, technological advancements, and strategic partnerships. The market demonstrates strong regional variations, with mature markets in North America and Europe showing steady growth and emerging markets in Asia-Pacific experiencing rapid expansion. This leads to a varying market penetration rate across different geographical areas, with Asia-Pacific exhibiting the highest growth potential.
Leading Markets & Segments in Global Chemical Logistics Market
The Asia-Pacific region is currently the leading market for chemical logistics, driven by robust industrial growth and expanding infrastructure. North America and Europe follow closely, exhibiting mature yet dynamic markets.
By Service: Transportation currently commands the largest segment share followed by warehousing and distribution. Green logistics is witnessing the fastest growth due to increasing environmental concerns.
- Key Drivers (Asia-Pacific): Rapid industrialization, expanding infrastructure, growing e-commerce.
- Key Drivers (North America): Established chemical industry, advanced logistics infrastructure.
- Key Drivers (Europe): Strong regulatory frameworks, focus on sustainable practices.
By Mode of Transportation: Roadways remain the dominant mode, followed by railways and waterways. The choice of mode depends on factors such as distance, cost-efficiency, and the nature of the chemical product.
By End User: The pharmaceutical industry is a major end-user, demanding stringent safety and regulatory compliance. The oil and gas industry also contributes significantly to the market volume due to the bulk nature of their chemical logistics needs.
Global Chemical Logistics Market Product Developments
Recent product innovations focus on enhancing efficiency, safety, and sustainability. This includes the implementation of advanced tracking technologies, development of specialized containers for hazardous materials, and the increased adoption of green technologies. These developments improve supply chain visibility, reduce risks, and minimize environmental impact. The competitive advantage lies in offering customized solutions that meet the specific needs of different chemical types and end-users, ensuring the highest levels of safety and efficiency throughout the logistics chain.
Key Drivers of Global Chemical Logistics Market Growth
Several factors contribute to the growth of this market: The expanding global chemical industry, coupled with the growing need for efficient and reliable logistics solutions, is a primary driver. Technological advancements, such as real-time tracking and predictive analytics, are improving supply chain efficiency and reducing costs. Government regulations and initiatives promoting sustainability are also shaping market trends, driving the adoption of greener logistics practices. Furthermore, the rise of e-commerce and the increasing demand for specialized chemical handling are creating new opportunities for growth.
Challenges in the Global Chemical Logistics Market Market
The chemical logistics industry faces several challenges. Strict regulatory compliance, especially concerning hazardous materials, presents a significant hurdle. Supply chain disruptions, such as port congestion or geopolitical instability, can severely impact operations. Intense competition, particularly from large multinational logistics companies, puts pressure on profit margins. Fluctuations in fuel prices and rising transportation costs also affect operational efficiency. The market is estimated to experience a xx% reduction in efficiency due to supply chain disruptions in the next 5 years.
Emerging Opportunities in Global Chemical Logistics Market
The long-term growth of the chemical logistics market is fueled by several opportunities. Technological breakthroughs, such as automation and AI-driven solutions, are promising to enhance efficiency and reduce costs significantly. Strategic partnerships between chemical producers and logistics providers are creating integrated solutions optimizing the entire supply chain. Market expansion into emerging economies presents further growth potential. The increasing focus on sustainability will drive the adoption of eco-friendly transportation and packaging solutions.
Leading Players in the Global Chemical Logistics Market Sector
- Petochem Middle East
- DHL
- A&R Logistics
- Montreal Chemical Logistics
- CEVA Logistics
- Al-Futtaim Logistics
- Agility Logistics
- BDP International
- C.H. Robinson
- Rhenus Logistics
Key Milestones in Global Chemical Logistics Market Industry
- 2020: Increased adoption of digital tracking and monitoring systems.
- 2021: Several major players invested heavily in sustainable logistics solutions.
- 2022: New regulations on hazardous materials handling were implemented in several countries.
- 2023: A significant increase in mergers and acquisitions within the industry.
- 2024: Launch of several innovative warehousing solutions focused on automation.
Strategic Outlook for Global Chemical Logistics Market Market
The future of the chemical logistics market appears promising, driven by sustained growth in the chemical industry, technological advancements, and the increasing importance of sustainability. Companies focusing on innovation, strategic partnerships, and the adoption of advanced technologies will be best positioned to capitalize on future market opportunities. Expanding into emerging markets and offering specialized services catering to the specific needs of different chemical types will also be crucial for success in this competitive landscape. The market is predicted to experience significant growth over the next decade, presenting considerable investment and expansion opportunities for industry players.
Global Chemical Logistics Market Segmentation
-
1. Service
- 1.1. Transportation
- 1.2. Warehous
- 1.3. Consulting & Management Services
- 1.4. Customs & Security
- 1.5. Green Logistics
- 1.6. Others
-
2. Mode of Transportation
- 2.1. Roadways
- 2.2. Railways
- 2.3. Airways
- 2.4. Waterways
- 2.5. Pipelines
-
3. End User
- 3.1. Pharmaceutical Industry
- 3.2. Cosmetic Industry
- 3.3. Oil and Gas Industry
- 3.4. Specialty Chemicals Industry
- 3.5. Other End Users
Global Chemical Logistics Market Segmentation By Geography
-
1. North America
- 1.1. United States
- 1.2. Canada
- 1.3. Mexico
-
2. Europe
- 2.1. Germany
- 2.2. France
- 2.3. United Kingdom
- 2.4. Italy
- 2.5. Spain
- 2.6. Russia
- 2.7. Rest of Europe
-
3. Asia Pacific
- 3.1. China
- 3.2. Japan
- 3.3. India
- 3.4. Bangladesh
- 3.5. Turkey
- 3.6. South Korea
- 3.7. Australia
- 3.8. Indonesia
- 3.9. Rest of Asia Pacific
- 4. Middle East
-
5. Egypt
- 5.1. South Africa
- 5.2. Saudi Arabia
- 5.3. Rest of Middle East
-
6. South America
- 6.1. Brazil
- 6.2. Argentina
- 6.3. Rest of South America
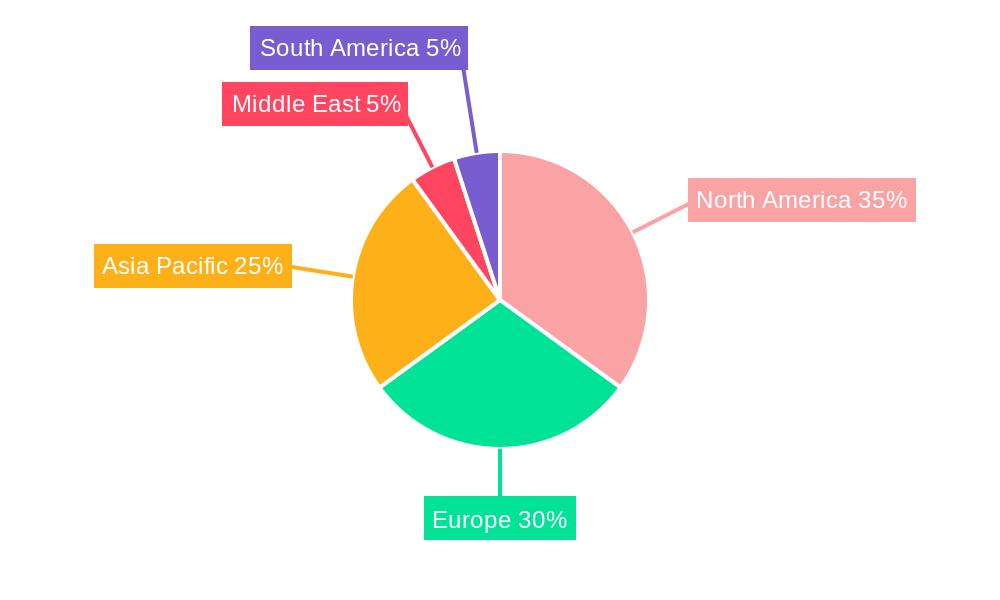
Global Chemical Logistics Market Regional Market Share
Geographic Coverage of Global Chemical Logistics Market
Global Chemical Logistics Market REPORT HIGHLIGHTS
| Aspects | Details |
|---|---|
| Study Period | 2020-2034 |
| Base Year | 2025 |
| Estimated Year | 2026 |
| Forecast Period | 2026-2034 |
| Historical Period | 2020-2025 |
| Growth Rate | CAGR of 5.2% from 2020-2034 |
| Segmentation |
|
Table of Contents
- 1. Introduction
- 1.1. Research Scope
- 1.2. Market Segmentation
- 1.3. Research Objective
- 1.4. Definitions and Assumptions
- 2. Executive Summary
- 2.1. Market Snapshot
- 3. Market Dynamics
- 3.1. Market Drivers
- 3.2. Market Restrains
- 3.3. Market Trends
- 3.4. Market Opportunities
- 4. Market Factor Analysis
- 4.1. Porters Five Forces
- 4.1.1. Bargaining Power of Suppliers
- 4.1.2. Bargaining Power of Buyers
- 4.1.3. Threat of New Entrants
- 4.1.4. Threat of Substitutes
- 4.1.5. Competitive Rivalry
- 4.2. PESTEL analysis
- 4.3. BCG Analysis
- 4.3.1. Stars (High Growth, High Market Share)
- 4.3.2. Cash Cows (Low Growth, High Market Share)
- 4.3.3. Question Mark (High Growth, Low Market Share)
- 4.3.4. Dogs (Low Growth, Low Market Share)
- 4.4. Ansoff Matrix Analysis
- 4.5. Supply Chain Analysis
- 4.6. Regulatory Landscape
- 4.7. Current Market Potential and Opportunity Assessment (TAM–SAM–SOM Framework)
- 4.8. MDP Analyst Note
- 4.1. Porters Five Forces
- 5. Market Analysis, Insights and Forecast 2021-2033
- 5.1. Market Analysis, Insights and Forecast - by Service
- 5.1.1. Transportation
- 5.1.2. Warehous
- 5.1.3. Consulting & Management Services
- 5.1.4. Customs & Security
- 5.1.5. Green Logistics
- 5.1.6. Others
- 5.2. Market Analysis, Insights and Forecast - by Mode of Transportation
- 5.2.1. Roadways
- 5.2.2. Railways
- 5.2.3. Airways
- 5.2.4. Waterways
- 5.2.5. Pipelines
- 5.3. Market Analysis, Insights and Forecast - by End User
- 5.3.1. Pharmaceutical Industry
- 5.3.2. Cosmetic Industry
- 5.3.3. Oil and Gas Industry
- 5.3.4. Specialty Chemicals Industry
- 5.3.5. Other End Users
- 5.4. Market Analysis, Insights and Forecast - by Region
- 5.4.1. North America
- 5.4.2. Europe
- 5.4.3. Asia Pacific
- 5.4.4. Middle East
- 5.4.5. Egypt
- 5.4.6. South America
- 5.1. Market Analysis, Insights and Forecast - by Service
- 6. Global Chemical Logistics Market Analysis, Insights and Forecast, 2021-2033
- 6.1. Market Analysis, Insights and Forecast - by Service
- 6.1.1. Transportation
- 6.1.2. Warehous
- 6.1.3. Consulting & Management Services
- 6.1.4. Customs & Security
- 6.1.5. Green Logistics
- 6.1.6. Others
- 6.2. Market Analysis, Insights and Forecast - by Mode of Transportation
- 6.2.1. Roadways
- 6.2.2. Railways
- 6.2.3. Airways
- 6.2.4. Waterways
- 6.2.5. Pipelines
- 6.3. Market Analysis, Insights and Forecast - by End User
- 6.3.1. Pharmaceutical Industry
- 6.3.2. Cosmetic Industry
- 6.3.3. Oil and Gas Industry
- 6.3.4. Specialty Chemicals Industry
- 6.3.5. Other End Users
- 6.1. Market Analysis, Insights and Forecast - by Service
- 7. North America Global Chemical Logistics Market Analysis, Insights and Forecast, 2020-2032
- 7.1. Market Analysis, Insights and Forecast - by Service
- 7.1.1. Transportation
- 7.1.2. Warehous
- 7.1.3. Consulting & Management Services
- 7.1.4. Customs & Security
- 7.1.5. Green Logistics
- 7.1.6. Others
- 7.2. Market Analysis, Insights and Forecast - by Mode of Transportation
- 7.2.1. Roadways
- 7.2.2. Railways
- 7.2.3. Airways
- 7.2.4. Waterways
- 7.2.5. Pipelines
- 7.3. Market Analysis, Insights and Forecast - by End User
- 7.3.1. Pharmaceutical Industry
- 7.3.2. Cosmetic Industry
- 7.3.3. Oil and Gas Industry
- 7.3.4. Specialty Chemicals Industry
- 7.3.5. Other End Users
- 7.1. Market Analysis, Insights and Forecast - by Service
- 8. Europe Global Chemical Logistics Market Analysis, Insights and Forecast, 2020-2032
- 8.1. Market Analysis, Insights and Forecast - by Service
- 8.1.1. Transportation
- 8.1.2. Warehous
- 8.1.3. Consulting & Management Services
- 8.1.4. Customs & Security
- 8.1.5. Green Logistics
- 8.1.6. Others
- 8.2. Market Analysis, Insights and Forecast - by Mode of Transportation
- 8.2.1. Roadways
- 8.2.2. Railways
- 8.2.3. Airways
- 8.2.4. Waterways
- 8.2.5. Pipelines
- 8.3. Market Analysis, Insights and Forecast - by End User
- 8.3.1. Pharmaceutical Industry
- 8.3.2. Cosmetic Industry
- 8.3.3. Oil and Gas Industry
- 8.3.4. Specialty Chemicals Industry
- 8.3.5. Other End Users
- 8.1. Market Analysis, Insights and Forecast - by Service
- 9. Asia Pacific Global Chemical Logistics Market Analysis, Insights and Forecast, 2020-2032
- 9.1. Market Analysis, Insights and Forecast - by Service
- 9.1.1. Transportation
- 9.1.2. Warehous
- 9.1.3. Consulting & Management Services
- 9.1.4. Customs & Security
- 9.1.5. Green Logistics
- 9.1.6. Others
- 9.2. Market Analysis, Insights and Forecast - by Mode of Transportation
- 9.2.1. Roadways
- 9.2.2. Railways
- 9.2.3. Airways
- 9.2.4. Waterways
- 9.2.5. Pipelines
- 9.3. Market Analysis, Insights and Forecast - by End User
- 9.3.1. Pharmaceutical Industry
- 9.3.2. Cosmetic Industry
- 9.3.3. Oil and Gas Industry
- 9.3.4. Specialty Chemicals Industry
- 9.3.5. Other End Users
- 9.1. Market Analysis, Insights and Forecast - by Service
- 10. Middle East Global Chemical Logistics Market Analysis, Insights and Forecast, 2020-2032
- 10.1. Market Analysis, Insights and Forecast - by Service
- 10.1.1. Transportation
- 10.1.2. Warehous
- 10.1.3. Consulting & Management Services
- 10.1.4. Customs & Security
- 10.1.5. Green Logistics
- 10.1.6. Others
- 10.2. Market Analysis, Insights and Forecast - by Mode of Transportation
- 10.2.1. Roadways
- 10.2.2. Railways
- 10.2.3. Airways
- 10.2.4. Waterways
- 10.2.5. Pipelines
- 10.3. Market Analysis, Insights and Forecast - by End User
- 10.3.1. Pharmaceutical Industry
- 10.3.2. Cosmetic Industry
- 10.3.3. Oil and Gas Industry
- 10.3.4. Specialty Chemicals Industry
- 10.3.5. Other End Users
- 10.1. Market Analysis, Insights and Forecast - by Service
- 11. Egypt Global Chemical Logistics Market Analysis, Insights and Forecast, 2020-2032
- 11.1. Market Analysis, Insights and Forecast - by Service
- 11.1.1. Transportation
- 11.1.2. Warehous
- 11.1.3. Consulting & Management Services
- 11.1.4. Customs & Security
- 11.1.5. Green Logistics
- 11.1.6. Others
- 11.2. Market Analysis, Insights and Forecast - by Mode of Transportation
- 11.2.1. Roadways
- 11.2.2. Railways
- 11.2.3. Airways
- 11.2.4. Waterways
- 11.2.5. Pipelines
- 11.3. Market Analysis, Insights and Forecast - by End User
- 11.3.1. Pharmaceutical Industry
- 11.3.2. Cosmetic Industry
- 11.3.3. Oil and Gas Industry
- 11.3.4. Specialty Chemicals Industry
- 11.3.5. Other End Users
- 11.1. Market Analysis, Insights and Forecast - by Service
- 12. South America Global Chemical Logistics Market Analysis, Insights and Forecast, 2020-2032
- 12.1. Market Analysis, Insights and Forecast - by Service
- 12.1.1. Transportation
- 12.1.2. Warehous
- 12.1.3. Consulting & Management Services
- 12.1.4. Customs & Security
- 12.1.5. Green Logistics
- 12.1.6. Others
- 12.2. Market Analysis, Insights and Forecast - by Mode of Transportation
- 12.2.1. Roadways
- 12.2.2. Railways
- 12.2.3. Airways
- 12.2.4. Waterways
- 12.2.5. Pipelines
- 12.3. Market Analysis, Insights and Forecast - by End User
- 12.3.1. Pharmaceutical Industry
- 12.3.2. Cosmetic Industry
- 12.3.3. Oil and Gas Industry
- 12.3.4. Specialty Chemicals Industry
- 12.3.5. Other End Users
- 12.1. Market Analysis, Insights and Forecast - by Service
- 13. Competitive Analysis
- 13.1. Company Profiles
- 13.1.1 Petochem Middle East**List Not Exhaustive
- 13.1.1.1. Company Overview
- 13.1.1.2. Products
- 13.1.1.3. Company Financials
- 13.1.1.4. SWOT Analysis
- 13.1.2 DHL
- 13.1.2.1. Company Overview
- 13.1.2.2. Products
- 13.1.2.3. Company Financials
- 13.1.2.4. SWOT Analysis
- 13.1.3 A&R Logistics
- 13.1.3.1. Company Overview
- 13.1.3.2. Products
- 13.1.3.3. Company Financials
- 13.1.3.4. SWOT Analysis
- 13.1.4 Montreal Chemical Logistics
- 13.1.4.1. Company Overview
- 13.1.4.2. Products
- 13.1.4.3. Company Financials
- 13.1.4.4. SWOT Analysis
- 13.1.5 CEVA Logistics
- 13.1.5.1. Company Overview
- 13.1.5.2. Products
- 13.1.5.3. Company Financials
- 13.1.5.4. SWOT Analysis
- 13.1.6 Al-Futtaim Logistics
- 13.1.6.1. Company Overview
- 13.1.6.2. Products
- 13.1.6.3. Company Financials
- 13.1.6.4. SWOT Analysis
- 13.1.7 Agility Logistics
- 13.1.7.1. Company Overview
- 13.1.7.2. Products
- 13.1.7.3. Company Financials
- 13.1.7.4. SWOT Analysis
- 13.1.8 BDP International
- 13.1.8.1. Company Overview
- 13.1.8.2. Products
- 13.1.8.3. Company Financials
- 13.1.8.4. SWOT Analysis
- 13.1.9 C H Robinson
- 13.1.9.1. Company Overview
- 13.1.9.2. Products
- 13.1.9.3. Company Financials
- 13.1.9.4. SWOT Analysis
- 13.1.10 Rhenus Logistics
- 13.1.10.1. Company Overview
- 13.1.10.2. Products
- 13.1.10.3. Company Financials
- 13.1.10.4. SWOT Analysis
- 13.1.1 Petochem Middle East**List Not Exhaustive
- 13.2. Market Entropy
- 13.2.1 Company's Key Areas Served
- 13.2.2 Recent Developments
- 13.3. Company Market Share Analysis 2025
- 13.3.1 Top 5 Companies Market Share Analysis
- 13.3.2 Top 3 Companies Market Share Analysis
- 13.4. List of Potential Customers
- 14. Research Methodology
List of Figures
- Figure 1: Global Global Chemical Logistics Market Revenue Breakdown (billion, %) by Region 2025 & 2033
- Figure 2: North America Global Chemical Logistics Market Revenue (billion), by Service 2025 & 2033
- Figure 3: North America Global Chemical Logistics Market Revenue Share (%), by Service 2025 & 2033
- Figure 4: North America Global Chemical Logistics Market Revenue (billion), by Mode of Transportation 2025 & 2033
- Figure 5: North America Global Chemical Logistics Market Revenue Share (%), by Mode of Transportation 2025 & 2033
- Figure 6: North America Global Chemical Logistics Market Revenue (billion), by End User 2025 & 2033
- Figure 7: North America Global Chemical Logistics Market Revenue Share (%), by End User 2025 & 2033
- Figure 8: North America Global Chemical Logistics Market Revenue (billion), by Country 2025 & 2033
- Figure 9: North America Global Chemical Logistics Market Revenue Share (%), by Country 2025 & 2033
- Figure 10: Europe Global Chemical Logistics Market Revenue (billion), by Service 2025 & 2033
- Figure 11: Europe Global Chemical Logistics Market Revenue Share (%), by Service 2025 & 2033
- Figure 12: Europe Global Chemical Logistics Market Revenue (billion), by Mode of Transportation 2025 & 2033
- Figure 13: Europe Global Chemical Logistics Market Revenue Share (%), by Mode of Transportation 2025 & 2033
- Figure 14: Europe Global Chemical Logistics Market Revenue (billion), by End User 2025 & 2033
- Figure 15: Europe Global Chemical Logistics Market Revenue Share (%), by End User 2025 & 2033
- Figure 16: Europe Global Chemical Logistics Market Revenue (billion), by Country 2025 & 2033
- Figure 17: Europe Global Chemical Logistics Market Revenue Share (%), by Country 2025 & 2033
- Figure 18: Asia Pacific Global Chemical Logistics Market Revenue (billion), by Service 2025 & 2033
- Figure 19: Asia Pacific Global Chemical Logistics Market Revenue Share (%), by Service 2025 & 2033
- Figure 20: Asia Pacific Global Chemical Logistics Market Revenue (billion), by Mode of Transportation 2025 & 2033
- Figure 21: Asia Pacific Global Chemical Logistics Market Revenue Share (%), by Mode of Transportation 2025 & 2033
- Figure 22: Asia Pacific Global Chemical Logistics Market Revenue (billion), by End User 2025 & 2033
- Figure 23: Asia Pacific Global Chemical Logistics Market Revenue Share (%), by End User 2025 & 2033
- Figure 24: Asia Pacific Global Chemical Logistics Market Revenue (billion), by Country 2025 & 2033
- Figure 25: Asia Pacific Global Chemical Logistics Market Revenue Share (%), by Country 2025 & 2033
- Figure 26: Middle East Global Chemical Logistics Market Revenue (billion), by Service 2025 & 2033
- Figure 27: Middle East Global Chemical Logistics Market Revenue Share (%), by Service 2025 & 2033
- Figure 28: Middle East Global Chemical Logistics Market Revenue (billion), by Mode of Transportation 2025 & 2033
- Figure 29: Middle East Global Chemical Logistics Market Revenue Share (%), by Mode of Transportation 2025 & 2033
- Figure 30: Middle East Global Chemical Logistics Market Revenue (billion), by End User 2025 & 2033
- Figure 31: Middle East Global Chemical Logistics Market Revenue Share (%), by End User 2025 & 2033
- Figure 32: Middle East Global Chemical Logistics Market Revenue (billion), by Country 2025 & 2033
- Figure 33: Middle East Global Chemical Logistics Market Revenue Share (%), by Country 2025 & 2033
- Figure 34: Egypt Global Chemical Logistics Market Revenue (billion), by Service 2025 & 2033
- Figure 35: Egypt Global Chemical Logistics Market Revenue Share (%), by Service 2025 & 2033
- Figure 36: Egypt Global Chemical Logistics Market Revenue (billion), by Mode of Transportation 2025 & 2033
- Figure 37: Egypt Global Chemical Logistics Market Revenue Share (%), by Mode of Transportation 2025 & 2033
- Figure 38: Egypt Global Chemical Logistics Market Revenue (billion), by End User 2025 & 2033
- Figure 39: Egypt Global Chemical Logistics Market Revenue Share (%), by End User 2025 & 2033
- Figure 40: Egypt Global Chemical Logistics Market Revenue (billion), by Country 2025 & 2033
- Figure 41: Egypt Global Chemical Logistics Market Revenue Share (%), by Country 2025 & 2033
- Figure 42: South America Global Chemical Logistics Market Revenue (billion), by Service 2025 & 2033
- Figure 43: South America Global Chemical Logistics Market Revenue Share (%), by Service 2025 & 2033
- Figure 44: South America Global Chemical Logistics Market Revenue (billion), by Mode of Transportation 2025 & 2033
- Figure 45: South America Global Chemical Logistics Market Revenue Share (%), by Mode of Transportation 2025 & 2033
- Figure 46: South America Global Chemical Logistics Market Revenue (billion), by End User 2025 & 2033
- Figure 47: South America Global Chemical Logistics Market Revenue Share (%), by End User 2025 & 2033
- Figure 48: South America Global Chemical Logistics Market Revenue (billion), by Country 2025 & 2033
- Figure 49: South America Global Chemical Logistics Market Revenue Share (%), by Country 2025 & 2033
List of Tables
- Table 1: Global Chemical Logistics Market Revenue billion Forecast, by Service 2020 & 2033
- Table 2: Global Chemical Logistics Market Revenue billion Forecast, by Mode of Transportation 2020 & 2033
- Table 3: Global Chemical Logistics Market Revenue billion Forecast, by End User 2020 & 2033
- Table 4: Global Chemical Logistics Market Revenue billion Forecast, by Region 2020 & 2033
- Table 5: Global Chemical Logistics Market Revenue billion Forecast, by Service 2020 & 2033
- Table 6: Global Chemical Logistics Market Revenue billion Forecast, by Mode of Transportation 2020 & 2033
- Table 7: Global Chemical Logistics Market Revenue billion Forecast, by End User 2020 & 2033
- Table 8: Global Chemical Logistics Market Revenue billion Forecast, by Country 2020 & 2033
- Table 9: United States Global Chemical Logistics Market Revenue (billion) Forecast, by Application 2020 & 2033
- Table 10: Canada Global Chemical Logistics Market Revenue (billion) Forecast, by Application 2020 & 2033
- Table 11: Mexico Global Chemical Logistics Market Revenue (billion) Forecast, by Application 2020 & 2033
- Table 12: Global Chemical Logistics Market Revenue billion Forecast, by Service 2020 & 2033
- Table 13: Global Chemical Logistics Market Revenue billion Forecast, by Mode of Transportation 2020 & 2033
- Table 14: Global Chemical Logistics Market Revenue billion Forecast, by End User 2020 & 2033
- Table 15: Global Chemical Logistics Market Revenue billion Forecast, by Country 2020 & 2033
- Table 16: Germany Global Chemical Logistics Market Revenue (billion) Forecast, by Application 2020 & 2033
- Table 17: France Global Chemical Logistics Market Revenue (billion) Forecast, by Application 2020 & 2033
- Table 18: United Kingdom Global Chemical Logistics Market Revenue (billion) Forecast, by Application 2020 & 2033
- Table 19: Italy Global Chemical Logistics Market Revenue (billion) Forecast, by Application 2020 & 2033
- Table 20: Spain Global Chemical Logistics Market Revenue (billion) Forecast, by Application 2020 & 2033
- Table 21: Russia Global Chemical Logistics Market Revenue (billion) Forecast, by Application 2020 & 2033
- Table 22: Rest of Europe Global Chemical Logistics Market Revenue (billion) Forecast, by Application 2020 & 2033
- Table 23: Global Chemical Logistics Market Revenue billion Forecast, by Service 2020 & 2033
- Table 24: Global Chemical Logistics Market Revenue billion Forecast, by Mode of Transportation 2020 & 2033
- Table 25: Global Chemical Logistics Market Revenue billion Forecast, by End User 2020 & 2033
- Table 26: Global Chemical Logistics Market Revenue billion Forecast, by Country 2020 & 2033
- Table 27: China Global Chemical Logistics Market Revenue (billion) Forecast, by Application 2020 & 2033
- Table 28: Japan Global Chemical Logistics Market Revenue (billion) Forecast, by Application 2020 & 2033
- Table 29: India Global Chemical Logistics Market Revenue (billion) Forecast, by Application 2020 & 2033
- Table 30: Bangladesh Global Chemical Logistics Market Revenue (billion) Forecast, by Application 2020 & 2033
- Table 31: Turkey Global Chemical Logistics Market Revenue (billion) Forecast, by Application 2020 & 2033
- Table 32: South Korea Global Chemical Logistics Market Revenue (billion) Forecast, by Application 2020 & 2033
- Table 33: Australia Global Chemical Logistics Market Revenue (billion) Forecast, by Application 2020 & 2033
- Table 34: Indonesia Global Chemical Logistics Market Revenue (billion) Forecast, by Application 2020 & 2033
- Table 35: Rest of Asia Pacific Global Chemical Logistics Market Revenue (billion) Forecast, by Application 2020 & 2033
- Table 36: Global Chemical Logistics Market Revenue billion Forecast, by Service 2020 & 2033
- Table 37: Global Chemical Logistics Market Revenue billion Forecast, by Mode of Transportation 2020 & 2033
- Table 38: Global Chemical Logistics Market Revenue billion Forecast, by End User 2020 & 2033
- Table 39: Global Chemical Logistics Market Revenue billion Forecast, by Country 2020 & 2033
- Table 40: Global Chemical Logistics Market Revenue billion Forecast, by Service 2020 & 2033
- Table 41: Global Chemical Logistics Market Revenue billion Forecast, by Mode of Transportation 2020 & 2033
- Table 42: Global Chemical Logistics Market Revenue billion Forecast, by End User 2020 & 2033
- Table 43: Global Chemical Logistics Market Revenue billion Forecast, by Country 2020 & 2033
- Table 44: South Africa Global Chemical Logistics Market Revenue (billion) Forecast, by Application 2020 & 2033
- Table 45: Saudi Arabia Global Chemical Logistics Market Revenue (billion) Forecast, by Application 2020 & 2033
- Table 46: Rest of Middle East Global Chemical Logistics Market Revenue (billion) Forecast, by Application 2020 & 2033
- Table 47: Global Chemical Logistics Market Revenue billion Forecast, by Service 2020 & 2033
- Table 48: Global Chemical Logistics Market Revenue billion Forecast, by Mode of Transportation 2020 & 2033
- Table 49: Global Chemical Logistics Market Revenue billion Forecast, by End User 2020 & 2033
- Table 50: Global Chemical Logistics Market Revenue billion Forecast, by Country 2020 & 2033
- Table 51: Brazil Global Chemical Logistics Market Revenue (billion) Forecast, by Application 2020 & 2033
- Table 52: Argentina Global Chemical Logistics Market Revenue (billion) Forecast, by Application 2020 & 2033
- Table 53: Rest of South America Global Chemical Logistics Market Revenue (billion) Forecast, by Application 2020 & 2033
Frequently Asked Questions
1. What is the projected Compound Annual Growth Rate (CAGR) of the Global Chemical Logistics Market?
The projected CAGR is approximately 5.2%.
2. Which companies are prominent players in the Global Chemical Logistics Market?
Key companies in the market include Petochem Middle East**List Not Exhaustive, DHL, A&R Logistics, Montreal Chemical Logistics, CEVA Logistics, Al-Futtaim Logistics, Agility Logistics, BDP International, C H Robinson, Rhenus Logistics.
3. What are the main segments of the Global Chemical Logistics Market?
The market segments include Service, Mode of Transportation, End User.
4. Can you provide details about the market size?
The market size is estimated to be USD 300.5 billion as of 2022.
5. What are some drivers contributing to market growth?
Growing Events in E-commerce Sector; Increasing Demand for Qualified Event Logistics Services.
6. What are the notable trends driving market growth?
Chemical Sector Significant Expansion Driving the market.
7. Are there any restraints impacting market growth?
High Labour Cost; High Pricing.
8. Can you provide examples of recent developments in the market?
N/A
9. What pricing options are available for accessing the report?
Pricing options include single-user, multi-user, and enterprise licenses priced at USD 4750, USD 5250, and USD 8750 respectively.
10. Is the market size provided in terms of value or volume?
The market size is provided in terms of value, measured in billion.
11. Are there any specific market keywords associated with the report?
Yes, the market keyword associated with the report is "Global Chemical Logistics Market," which aids in identifying and referencing the specific market segment covered.
12. How do I determine which pricing option suits my needs best?
The pricing options vary based on user requirements and access needs. Individual users may opt for single-user licenses, while businesses requiring broader access may choose multi-user or enterprise licenses for cost-effective access to the report.
13. Are there any additional resources or data provided in the Global Chemical Logistics Market report?
While the report offers comprehensive insights, it's advisable to review the specific contents or supplementary materials provided to ascertain if additional resources or data are available.
14. How can I stay updated on further developments or reports in the Global Chemical Logistics Market?
To stay informed about further developments, trends, and reports in the Global Chemical Logistics Market, consider subscribing to industry newsletters, following relevant companies and organizations, or regularly checking reputable industry news sources and publications.
Methodology
Step 1 - Identification of Relevant Samples Size from Population Database


Step 2 - Approaches for Defining Global Market Size (Value, Volume* & Price*)

Note*: In applicable scenarios
Step 3 - Data Sources
Primary Research
- Web Analytics
- Survey Reports
- Research Institute
- Latest Research Reports
- Opinion Leaders
Secondary Research
- Annual Reports
- White Paper
- Latest Press Release
- Industry Association
- Paid Database
- Investor Presentations

Step 4 - Data Triangulation
Involves using different sources of information in order to increase the validity of a study
These sources are likely to be stakeholders in a program - participants, other researchers, program staff, other community members, and so on.
Then we put all data in single framework & apply various statistical tools to find out the dynamic on the market.
During the analysis stage, feedback from the stakeholder groups would be compared to determine areas of agreement as well as areas of divergence