

Key Insights
The GCC Dangerous Goods Freight Market is experiencing robust growth, driven by the region's expanding petrochemical and industrial sectors, coupled with increasing cross-border trade. The market's Compound Annual Growth Rate (CAGR) exceeding 5% signifies a consistently expanding demand for specialized logistics solutions capable of handling hazardous materials. Key drivers include stringent regulatory compliance requirements necessitating specialized handling and transportation services, the growth of e-commerce pushing the need for efficient last-mile delivery of dangerous goods, and the ongoing infrastructure development projects within the GCC further fueling the sector's expansion. The market is segmented by service type (transportation, warehousing & inventory management, value-added services) and geography (Saudi Arabia, UAE, Kuwait, Qatar, Bahrain, Oman). While Saudi Arabia and the UAE currently hold significant market share due to their larger economies and industrial bases, other GCC countries are witnessing substantial growth as their economies diversify and industrial activity intensifies. The competitive landscape is characterized by a mix of international logistics giants and regional players, each vying for market share through specialized services, technological advancements, and strategic partnerships. Challenges include maintaining strict adherence to safety regulations, managing fluctuating oil prices that impact the petrochemical sector, and navigating complex customs procedures across different GCC countries. Despite these challenges, the overall outlook for the GCC Dangerous Goods Freight Market remains positive, with significant potential for growth throughout the forecast period.
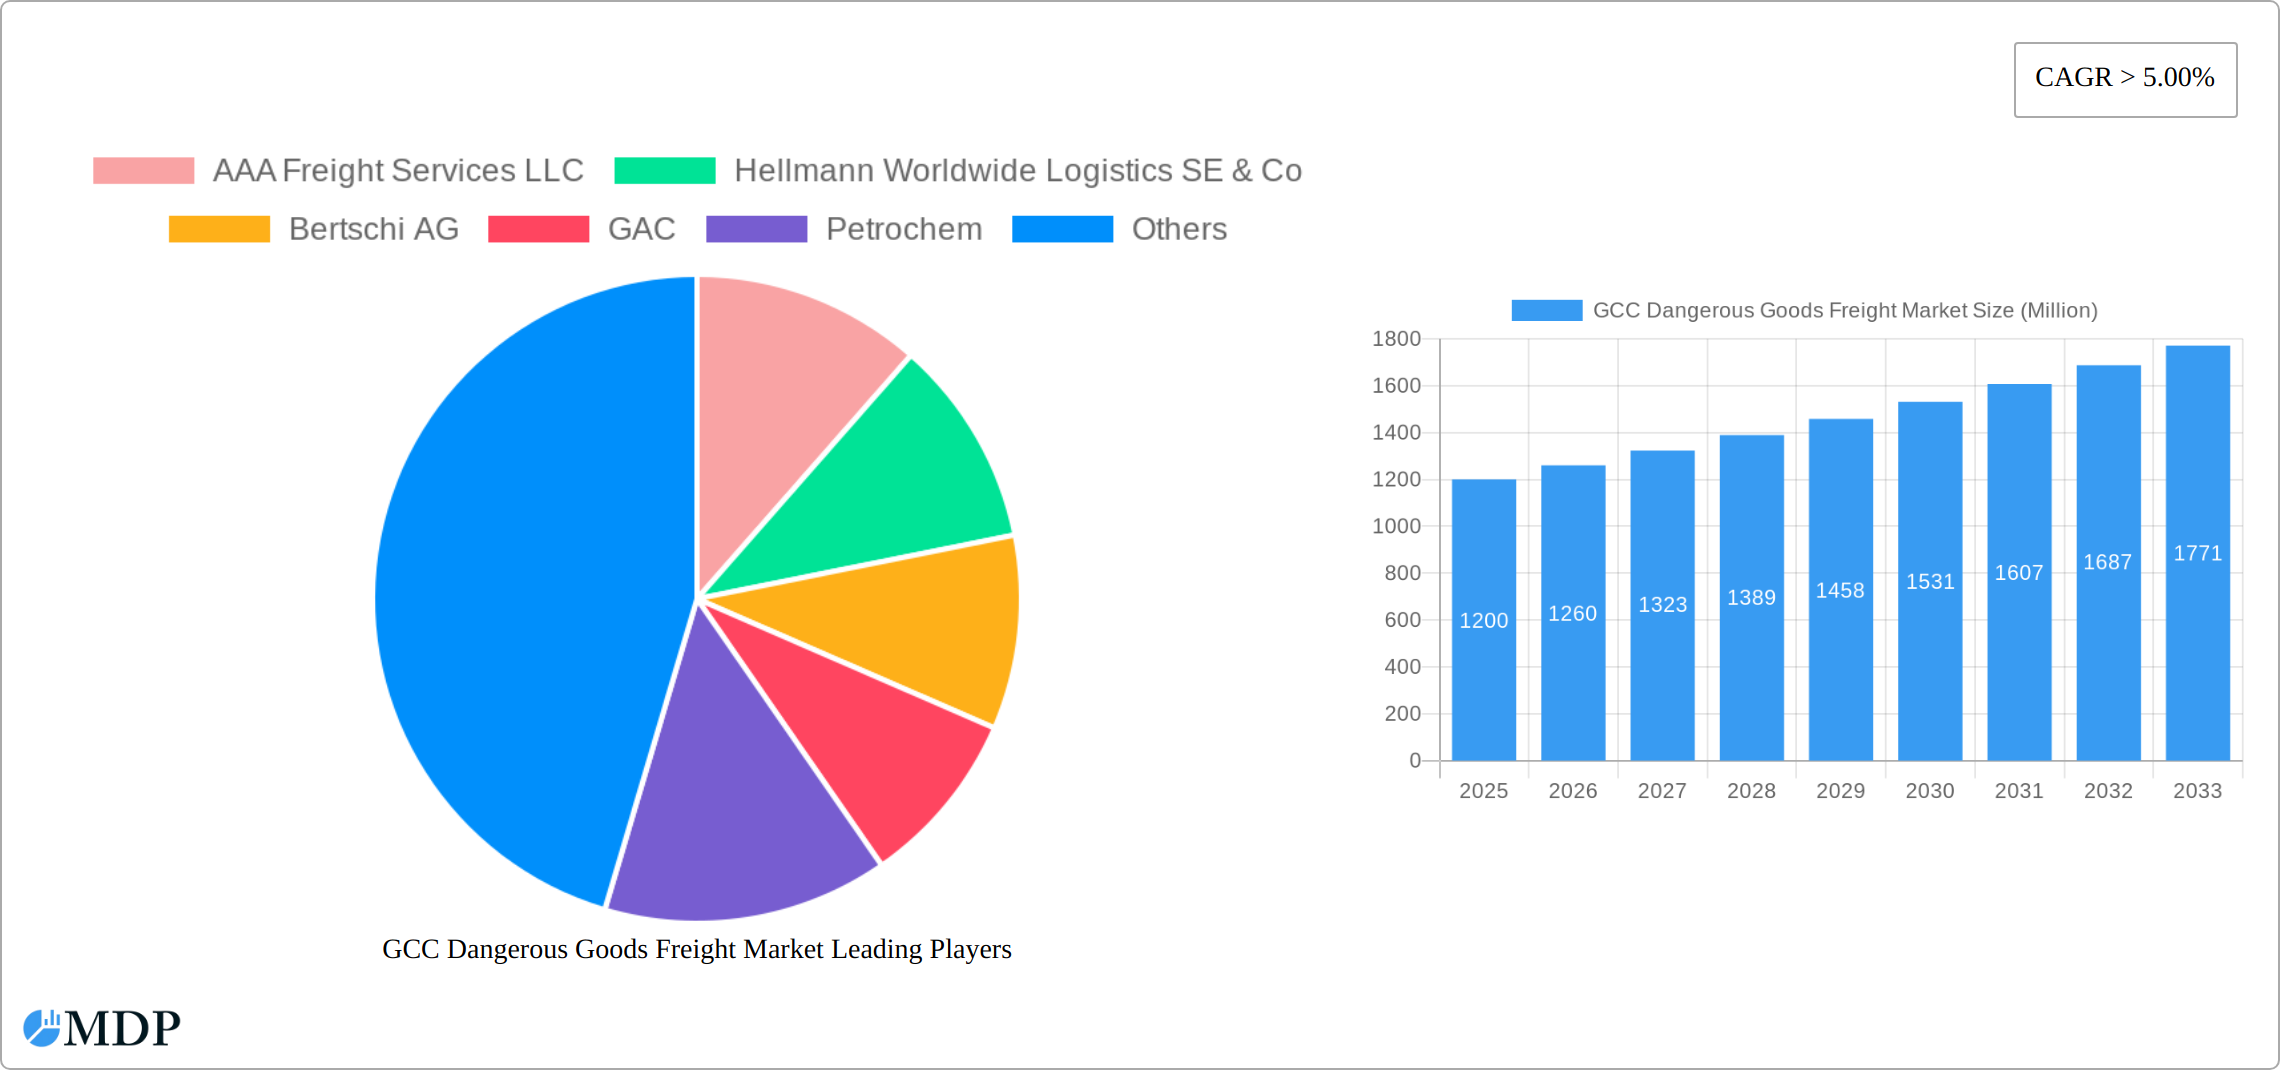
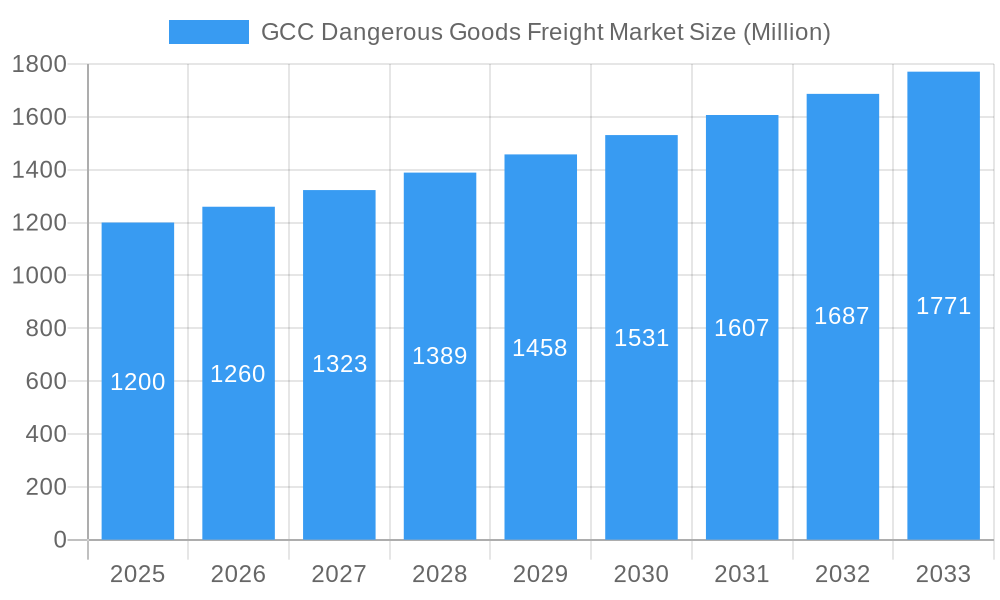
GCC Dangerous Goods Freight Market Market Size (In Billion)
The presence of established international logistics companies like Hellmann Worldwide Logistics and Agility alongside regional players indicates a healthy level of competition and a dynamic market. The ongoing investments in infrastructure, such as improved port facilities and transportation networks within the GCC, are expected to further facilitate the growth of this market segment. Furthermore, the increasing adoption of technology, including advanced tracking systems and data analytics, will play a crucial role in enhancing efficiency and safety within the dangerous goods freight supply chain. Growth will likely be driven by the expansion of sectors reliant on the transportation of dangerous goods, including chemicals, pharmaceuticals, and energy. Effective risk management strategies and rigorous safety protocols will be critical for sustained success in this specialized market. The consolidation of smaller logistics firms through mergers and acquisitions could also reshape the competitive landscape in the coming years.
GCC Dangerous Goods Freight Market Company Market Share
GCC Dangerous Goods Freight Market: A Comprehensive Report (2019-2033)
This in-depth report provides a comprehensive analysis of the GCC Dangerous Goods Freight Market, offering valuable insights for stakeholders across the logistics and transportation sectors. With a study period spanning 2019-2033, a base year of 2025, and a forecast period of 2025-2033, this report meticulously examines market dynamics, trends, and future growth potential. The report leverages extensive data analysis to present a clear picture of the market's current state and anticipated future trajectory. Key market players such as AAA Freight Services LLC, Hellmann Worldwide Logistics SE & Co, Bertschi AG, GAC, Petrochem, Agility, Al Ghazal Transport UAE, BDP INTERNATIONAL, Al Futtaim - Logistics, and TALKE Group are profiled, showcasing their strategies and contributions to the market's growth. This report is crucial for businesses seeking to understand, navigate, and thrive within this complex and ever-evolving market.
GCC Dangerous Goods Freight Market Market Dynamics & Concentration
The GCC Dangerous Goods Freight Market is characterized by a moderate level of concentration, with a few large players holding significant market share. However, the market also features numerous smaller, specialized companies catering to niche segments. The market's dynamics are heavily influenced by stringent regulatory frameworks governing the transportation of hazardous materials. Innovation is driven by the need for improved safety, efficiency, and transparency in handling dangerous goods. Technological advancements, such as real-time tracking and monitoring systems, are transforming the industry. Product substitutes are limited due to the specific nature of dangerous goods handling, but there is ongoing pressure to optimize existing solutions and improve cost-effectiveness. End-user trends reflect a growing demand for secure, reliable, and compliant transportation solutions.
Key Market Dynamics:
- Market Concentration: The top 5 players hold approximately xx% of the market share in 2025.
- M&A Activity: An estimated xx M&A deals occurred in the historical period (2019-2024), reflecting consolidation trends within the market.
- Regulatory Framework: Stringent regulations imposed by GCC governments significantly impact operational costs and safety protocols.
- Innovation Drivers: Technological advancements in tracking, monitoring, and data analytics are pushing the market towards greater efficiency and safety.
- End-User Trends: Increasing demand for specialized handling and transportation solutions is driving growth.
GCC Dangerous Goods Freight Market Industry Trends & Analysis
The GCC Dangerous Goods Freight Market is experiencing robust growth, fueled by the region's accelerating industrialization, burgeoning e-commerce sector, and increasing international trade volume. The market is projected to witness a Compound Annual Growth Rate (CAGR) of **[Insert Specific CAGR Here]%** during the forecast period (2025-2033). Key drivers include significant infrastructure development, a growing demand for specialized chemical and pharmaceutical products, and the implementation of stricter safety and environmental regulations. Technological disruptions are profoundly shaping market dynamics, with the adoption of blockchain technology for enhanced supply chain transparency and security, and the widespread integration of IoT sensors for real-time monitoring of temperature, humidity, and location. Consumer and business preferences are increasingly prioritizing safety, reliability, and comprehensive traceability throughout the transportation lifecycle. Intense competition among freight forwarders and logistics providers is catalyzing innovation and driving efficiency improvements, leading to more sophisticated handling procedures and optimized logistics solutions. The market penetration of advanced tracking and tracing systems is expected to reach approximately **[Insert Specific Percentage Here]%** by 2033, further bolstering confidence and operational effectiveness.
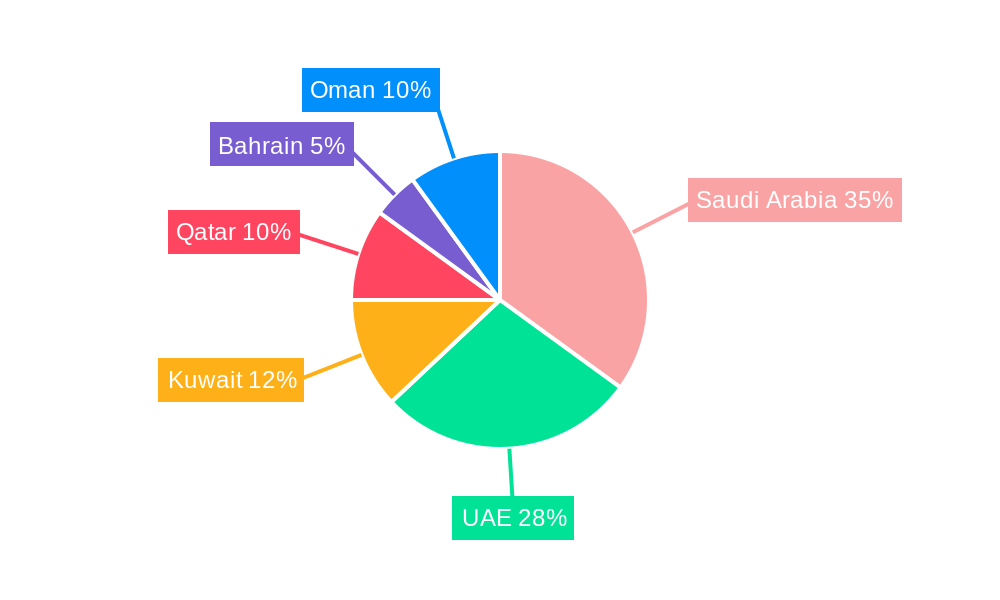
Leading Markets & Segments in GCC Dangerous Goods Freight Market
Saudi Arabia and the UAE represent the leading markets within the GCC region, accounting for approximately xx% and xx% of the total market value, respectively, in 2025. This dominance is primarily driven by their large and diversified economies, substantial industrial output, and well-established logistics infrastructure.
Key Drivers:
- Saudi Arabia: Large-scale infrastructure projects, Vision 2030 initiatives, and a burgeoning industrial sector are driving demand for dangerous goods transportation services.
- UAE: Strong port infrastructure, strategic location, and established free zones facilitate high volumes of international trade involving dangerous goods.
- Other GCC Countries: Kuwait, Qatar, Bahrain, and Oman are experiencing steady growth, driven by their respective industrial developments and increasing import/export activities.
Segment Analysis:
- Transportation: This segment dominates the market, representing approximately xx% of the total market value in 2025.
- Warehousing and Inventory Management: This segment is experiencing strong growth due to the need for secure and specialized storage facilities.
- Value-added Services: This segment includes services such as customs brokerage, documentation, and specialized handling, which are witnessing increasing demand.
GCC Dangerous Goods Freight Market Product Developments
Recent product developments are heavily focused on elevating safety standards, bolstering tracking and monitoring capabilities, and streamlining complex documentation processes inherent in dangerous goods logistics. The integration of advanced technologies, such as AI-powered predictive analytics for risk assessment and IoT-enabled sensors for continuous environmental and condition monitoring, is revolutionizing the efficiency, security, and safety of dangerous goods transportation. These innovations are significantly enhancing supply chain visibility, enabling proactive risk management strategies, minimizing potential delays, and drastically reducing the likelihood of accidents or non-compliance. Furthermore, there's a growing emphasis on developing specialized packaging solutions and temperature-controlled containers that meet the stringent requirements of various hazardous materials.
Key Drivers of GCC Dangerous Goods Freight Market Growth
Several factors are fueling the growth of the GCC Dangerous Goods Freight Market. These include the expansion of industrial activities across the GCC, particularly in the petrochemical, chemical, and manufacturing sectors. Government initiatives aimed at improving infrastructure and logistics capabilities also play a crucial role. Furthermore, the increasing adoption of advanced technologies, such as IoT and AI, is enhancing efficiency and safety within the industry.
Challenges in the GCC Dangerous Goods Freight Market Market
The GCC Dangerous Goods Freight Market faces challenges including stringent regulatory compliance requirements, which can lead to increased operational costs and complexities. Supply chain disruptions caused by geopolitical events and global economic fluctuations can also impact market stability. Finally, intense competition among market players necessitates continuous innovation and cost optimization to maintain profitability.
Emerging Opportunities in GCC Dangerous Goods Freight Market
Emerging opportunities in the GCC Dangerous Goods Freight Market include expanding into specialized niches, leveraging technological advancements to improve efficiency and safety, and establishing strategic partnerships with regional players to increase market reach and coverage. The potential for market expansion into emerging industries, coupled with growing demand for sustainable and environmentally friendly transportation solutions, presents a significant opportunity for growth.
Leading Players in the GCC Dangerous Goods Freight Market Sector
- AAA Freight Services LLC
- Hellmann Worldwide Logistics SE & Co
- Bertschi AG
- GAC
- Petrochem
- Agility
- Al Ghazal Transport UAE
- BDP INTERNATIONAL
- Al Futtaim - Logistics
- TALKE Group
- [Add other prominent players and companies specializing in dangerous goods logistics in the GCC]
Key Milestones in GCC Dangerous Goods Freight Market Industry
- June 2023: Magnate Worldwide acquires Cargo Logistics Group, strategically expanding its global footprint and bolstering its expertise in managing complex, mission-critical supply chains, including those involving dangerous goods.
- April 2023: dnata becomes a pioneer by adopting IATA's Connect API, significantly enhancing digitalization, automation, and data interoperability within the air cargo industry, which is crucial for the safe and efficient handling of dangerous goods.
- [Add a recent milestone related to safety regulations or technological adoption in the GCC dangerous goods sector]
- [Add another relevant milestone, such as a strategic partnership or investment in specialized infrastructure]
Strategic Outlook for GCC Dangerous Goods Freight Market Market
The GCC Dangerous Goods Freight Market is strategically positioned for sustained and significant growth, underpinned by robust regional economic expansion, ongoing industrial diversification, and rapid advancements in logistics technologies. Emerging strategic opportunities abound for companies that demonstrate agility in adapting to evolving international and regional regulatory frameworks, proactively invest in cutting-edge technologies like autonomous vehicles and advanced data analytics, and cultivate strong, resilient, and compliant supply chain networks. A steadfast commitment to innovation, paramount focus on safety protocols, and an increasing emphasis on environmental sustainability will be critical determinants for achieving long-term success and competitive advantage in this dynamic and high-stakes market.
GCC Dangerous Goods Freight Market Segmentation
-
1. Service
- 1.1. Transportation
- 1.2. Warehousing and Inventory Management
- 1.3. Value-added Services
GCC Dangerous Goods Freight Market Segmentation By Geography
-
1. North America
- 1.1. United States
- 1.2. Canada
- 1.3. Mexico
-
2. South America
- 2.1. Brazil
- 2.2. Argentina
- 2.3. Rest of South America
-
3. Europe
- 3.1. United Kingdom
- 3.2. Germany
- 3.3. France
- 3.4. Italy
- 3.5. Spain
- 3.6. Russia
- 3.7. Benelux
- 3.8. Nordics
- 3.9. Rest of Europe
-
4. Middle East & Africa
- 4.1. Turkey
- 4.2. Israel
- 4.3. GCC
- 4.4. North Africa
- 4.5. South Africa
- 4.6. Rest of Middle East & Africa
-
5. Asia Pacific
- 5.1. China
- 5.2. India
- 5.3. Japan
- 5.4. South Korea
- 5.5. ASEAN
- 5.6. Oceania
- 5.7. Rest of Asia Pacific
GCC Dangerous Goods Freight Market Regional Market Share
Geographic Coverage of GCC Dangerous Goods Freight Market
GCC Dangerous Goods Freight Market REPORT HIGHLIGHTS
| Aspects | Details |
|---|---|
| Study Period | 2020-2034 |
| Base Year | 2025 |
| Estimated Year | 2026 |
| Forecast Period | 2026-2034 |
| Historical Period | 2020-2025 |
| Growth Rate | CAGR of > 5.00% from 2020-2034 |
| Segmentation |
|
Table of Contents
- 1. Introduction
- 1.1. Research Scope
- 1.2. Market Segmentation
- 1.3. Research Objective
- 1.4. Definitions and Assumptions
- 2. Executive Summary
- 2.1. Market Snapshot
- 3. Market Dynamics
- 3.1. Market Drivers
- 3.2. Market Restrains
- 3.3. Market Trends
- 3.4. Market Opportunities
- 4. Market Factor Analysis
- 4.1. Porters Five Forces
- 4.1.1. Bargaining Power of Suppliers
- 4.1.2. Bargaining Power of Buyers
- 4.1.3. Threat of New Entrants
- 4.1.4. Threat of Substitutes
- 4.1.5. Competitive Rivalry
- 4.2. PESTEL analysis
- 4.3. BCG Analysis
- 4.3.1. Stars (High Growth, High Market Share)
- 4.3.2. Cash Cows (Low Growth, High Market Share)
- 4.3.3. Question Mark (High Growth, Low Market Share)
- 4.3.4. Dogs (Low Growth, Low Market Share)
- 4.4. Ansoff Matrix Analysis
- 4.5. Supply Chain Analysis
- 4.6. Regulatory Landscape
- 4.7. Current Market Potential and Opportunity Assessment (TAM–SAM–SOM Framework)
- 4.8. MDP Analyst Note
- 4.1. Porters Five Forces
- 5. Market Analysis, Insights and Forecast 2021-2033
- 5.1. Market Analysis, Insights and Forecast - by Service
- 5.1.1. Transportation
- 5.1.2. Warehousing and Inventory Management
- 5.1.3. Value-added Services
- 5.2. Market Analysis, Insights and Forecast - by Region
- 5.2.1. North America
- 5.2.2. South America
- 5.2.3. Europe
- 5.2.4. Middle East & Africa
- 5.2.5. Asia Pacific
- 5.1. Market Analysis, Insights and Forecast - by Service
- 6. Global GCC Dangerous Goods Freight Market Analysis, Insights and Forecast, 2021-2033
- 6.1. Market Analysis, Insights and Forecast - by Service
- 6.1.1. Transportation
- 6.1.2. Warehousing and Inventory Management
- 6.1.3. Value-added Services
- 6.1. Market Analysis, Insights and Forecast - by Service
- 7. North America GCC Dangerous Goods Freight Market Analysis, Insights and Forecast, 2020-2032
- 7.1. Market Analysis, Insights and Forecast - by Service
- 7.1.1. Transportation
- 7.1.2. Warehousing and Inventory Management
- 7.1.3. Value-added Services
- 7.1. Market Analysis, Insights and Forecast - by Service
- 8. South America GCC Dangerous Goods Freight Market Analysis, Insights and Forecast, 2020-2032
- 8.1. Market Analysis, Insights and Forecast - by Service
- 8.1.1. Transportation
- 8.1.2. Warehousing and Inventory Management
- 8.1.3. Value-added Services
- 8.1. Market Analysis, Insights and Forecast - by Service
- 9. Europe GCC Dangerous Goods Freight Market Analysis, Insights and Forecast, 2020-2032
- 9.1. Market Analysis, Insights and Forecast - by Service
- 9.1.1. Transportation
- 9.1.2. Warehousing and Inventory Management
- 9.1.3. Value-added Services
- 9.1. Market Analysis, Insights and Forecast - by Service
- 10. Middle East & Africa GCC Dangerous Goods Freight Market Analysis, Insights and Forecast, 2020-2032
- 10.1. Market Analysis, Insights and Forecast - by Service
- 10.1.1. Transportation
- 10.1.2. Warehousing and Inventory Management
- 10.1.3. Value-added Services
- 10.1. Market Analysis, Insights and Forecast - by Service
- 11. Asia Pacific GCC Dangerous Goods Freight Market Analysis, Insights and Forecast, 2020-2032
- 11.1. Market Analysis, Insights and Forecast - by Service
- 11.1.1. Transportation
- 11.1.2. Warehousing and Inventory Management
- 11.1.3. Value-added Services
- 11.1. Market Analysis, Insights and Forecast - by Service
- 12. Competitive Analysis
- 12.1. Company Profiles
- 12.1.1 AAA Freight Services LLC
- 12.1.1.1. Company Overview
- 12.1.1.2. Products
- 12.1.1.3. Company Financials
- 12.1.1.4. SWOT Analysis
- 12.1.2 Hellmann Worldwide Logistics SE & Co
- 12.1.2.1. Company Overview
- 12.1.2.2. Products
- 12.1.2.3. Company Financials
- 12.1.2.4. SWOT Analysis
- 12.1.3 Bertschi AG
- 12.1.3.1. Company Overview
- 12.1.3.2. Products
- 12.1.3.3. Company Financials
- 12.1.3.4. SWOT Analysis
- 12.1.4 GAC
- 12.1.4.1. Company Overview
- 12.1.4.2. Products
- 12.1.4.3. Company Financials
- 12.1.4.4. SWOT Analysis
- 12.1.5 Petrochem
- 12.1.5.1. Company Overview
- 12.1.5.2. Products
- 12.1.5.3. Company Financials
- 12.1.5.4. SWOT Analysis
- 12.1.6 Agility
- 12.1.6.1. Company Overview
- 12.1.6.2. Products
- 12.1.6.3. Company Financials
- 12.1.6.4. SWOT Analysis
- 12.1.7 Al Ghazal Transport UAE**List Not Exhaustive
- 12.1.7.1. Company Overview
- 12.1.7.2. Products
- 12.1.7.3. Company Financials
- 12.1.7.4. SWOT Analysis
- 12.1.8 BDP INTERNATIONAL
- 12.1.8.1. Company Overview
- 12.1.8.2. Products
- 12.1.8.3. Company Financials
- 12.1.8.4. SWOT Analysis
- 12.1.9 Al Futtaim - Logistics
- 12.1.9.1. Company Overview
- 12.1.9.2. Products
- 12.1.9.3. Company Financials
- 12.1.9.4. SWOT Analysis
- 12.1.10 TALKE Group
- 12.1.10.1. Company Overview
- 12.1.10.2. Products
- 12.1.10.3. Company Financials
- 12.1.10.4. SWOT Analysis
- 12.1.1 AAA Freight Services LLC
- 12.2. Market Entropy
- 12.2.1 Company's Key Areas Served
- 12.2.2 Recent Developments
- 12.3. Company Market Share Analysis 2025
- 12.3.1 Top 5 Companies Market Share Analysis
- 12.3.2 Top 3 Companies Market Share Analysis
- 12.4. List of Potential Customers
- 13. Research Methodology
List of Figures
- Figure 1: Global GCC Dangerous Goods Freight Market Revenue Breakdown (Million, %) by Region 2025 & 2033
- Figure 2: North America GCC Dangerous Goods Freight Market Revenue (Million), by Service 2025 & 2033
- Figure 3: North America GCC Dangerous Goods Freight Market Revenue Share (%), by Service 2025 & 2033
- Figure 4: North America GCC Dangerous Goods Freight Market Revenue (Million), by Country 2025 & 2033
- Figure 5: North America GCC Dangerous Goods Freight Market Revenue Share (%), by Country 2025 & 2033
- Figure 6: South America GCC Dangerous Goods Freight Market Revenue (Million), by Service 2025 & 2033
- Figure 7: South America GCC Dangerous Goods Freight Market Revenue Share (%), by Service 2025 & 2033
- Figure 8: South America GCC Dangerous Goods Freight Market Revenue (Million), by Country 2025 & 2033
- Figure 9: South America GCC Dangerous Goods Freight Market Revenue Share (%), by Country 2025 & 2033
- Figure 10: Europe GCC Dangerous Goods Freight Market Revenue (Million), by Service 2025 & 2033
- Figure 11: Europe GCC Dangerous Goods Freight Market Revenue Share (%), by Service 2025 & 2033
- Figure 12: Europe GCC Dangerous Goods Freight Market Revenue (Million), by Country 2025 & 2033
- Figure 13: Europe GCC Dangerous Goods Freight Market Revenue Share (%), by Country 2025 & 2033
- Figure 14: Middle East & Africa GCC Dangerous Goods Freight Market Revenue (Million), by Service 2025 & 2033
- Figure 15: Middle East & Africa GCC Dangerous Goods Freight Market Revenue Share (%), by Service 2025 & 2033
- Figure 16: Middle East & Africa GCC Dangerous Goods Freight Market Revenue (Million), by Country 2025 & 2033
- Figure 17: Middle East & Africa GCC Dangerous Goods Freight Market Revenue Share (%), by Country 2025 & 2033
- Figure 18: Asia Pacific GCC Dangerous Goods Freight Market Revenue (Million), by Service 2025 & 2033
- Figure 19: Asia Pacific GCC Dangerous Goods Freight Market Revenue Share (%), by Service 2025 & 2033
- Figure 20: Asia Pacific GCC Dangerous Goods Freight Market Revenue (Million), by Country 2025 & 2033
- Figure 21: Asia Pacific GCC Dangerous Goods Freight Market Revenue Share (%), by Country 2025 & 2033
List of Tables
- Table 1: Global GCC Dangerous Goods Freight Market Revenue Million Forecast, by Service 2020 & 2033
- Table 2: Global GCC Dangerous Goods Freight Market Revenue Million Forecast, by Region 2020 & 2033
- Table 3: Global GCC Dangerous Goods Freight Market Revenue Million Forecast, by Service 2020 & 2033
- Table 4: Global GCC Dangerous Goods Freight Market Revenue Million Forecast, by Country 2020 & 2033
- Table 5: United States GCC Dangerous Goods Freight Market Revenue (Million) Forecast, by Application 2020 & 2033
- Table 6: Canada GCC Dangerous Goods Freight Market Revenue (Million) Forecast, by Application 2020 & 2033
- Table 7: Mexico GCC Dangerous Goods Freight Market Revenue (Million) Forecast, by Application 2020 & 2033
- Table 8: Global GCC Dangerous Goods Freight Market Revenue Million Forecast, by Service 2020 & 2033
- Table 9: Global GCC Dangerous Goods Freight Market Revenue Million Forecast, by Country 2020 & 2033
- Table 10: Brazil GCC Dangerous Goods Freight Market Revenue (Million) Forecast, by Application 2020 & 2033
- Table 11: Argentina GCC Dangerous Goods Freight Market Revenue (Million) Forecast, by Application 2020 & 2033
- Table 12: Rest of South America GCC Dangerous Goods Freight Market Revenue (Million) Forecast, by Application 2020 & 2033
- Table 13: Global GCC Dangerous Goods Freight Market Revenue Million Forecast, by Service 2020 & 2033
- Table 14: Global GCC Dangerous Goods Freight Market Revenue Million Forecast, by Country 2020 & 2033
- Table 15: United Kingdom GCC Dangerous Goods Freight Market Revenue (Million) Forecast, by Application 2020 & 2033
- Table 16: Germany GCC Dangerous Goods Freight Market Revenue (Million) Forecast, by Application 2020 & 2033
- Table 17: France GCC Dangerous Goods Freight Market Revenue (Million) Forecast, by Application 2020 & 2033
- Table 18: Italy GCC Dangerous Goods Freight Market Revenue (Million) Forecast, by Application 2020 & 2033
- Table 19: Spain GCC Dangerous Goods Freight Market Revenue (Million) Forecast, by Application 2020 & 2033
- Table 20: Russia GCC Dangerous Goods Freight Market Revenue (Million) Forecast, by Application 2020 & 2033
- Table 21: Benelux GCC Dangerous Goods Freight Market Revenue (Million) Forecast, by Application 2020 & 2033
- Table 22: Nordics GCC Dangerous Goods Freight Market Revenue (Million) Forecast, by Application 2020 & 2033
- Table 23: Rest of Europe GCC Dangerous Goods Freight Market Revenue (Million) Forecast, by Application 2020 & 2033
- Table 24: Global GCC Dangerous Goods Freight Market Revenue Million Forecast, by Service 2020 & 2033
- Table 25: Global GCC Dangerous Goods Freight Market Revenue Million Forecast, by Country 2020 & 2033
- Table 26: Turkey GCC Dangerous Goods Freight Market Revenue (Million) Forecast, by Application 2020 & 2033
- Table 27: Israel GCC Dangerous Goods Freight Market Revenue (Million) Forecast, by Application 2020 & 2033
- Table 28: GCC GCC Dangerous Goods Freight Market Revenue (Million) Forecast, by Application 2020 & 2033
- Table 29: North Africa GCC Dangerous Goods Freight Market Revenue (Million) Forecast, by Application 2020 & 2033
- Table 30: South Africa GCC Dangerous Goods Freight Market Revenue (Million) Forecast, by Application 2020 & 2033
- Table 31: Rest of Middle East & Africa GCC Dangerous Goods Freight Market Revenue (Million) Forecast, by Application 2020 & 2033
- Table 32: Global GCC Dangerous Goods Freight Market Revenue Million Forecast, by Service 2020 & 2033
- Table 33: Global GCC Dangerous Goods Freight Market Revenue Million Forecast, by Country 2020 & 2033
- Table 34: China GCC Dangerous Goods Freight Market Revenue (Million) Forecast, by Application 2020 & 2033
- Table 35: India GCC Dangerous Goods Freight Market Revenue (Million) Forecast, by Application 2020 & 2033
- Table 36: Japan GCC Dangerous Goods Freight Market Revenue (Million) Forecast, by Application 2020 & 2033
- Table 37: South Korea GCC Dangerous Goods Freight Market Revenue (Million) Forecast, by Application 2020 & 2033
- Table 38: ASEAN GCC Dangerous Goods Freight Market Revenue (Million) Forecast, by Application 2020 & 2033
- Table 39: Oceania GCC Dangerous Goods Freight Market Revenue (Million) Forecast, by Application 2020 & 2033
- Table 40: Rest of Asia Pacific GCC Dangerous Goods Freight Market Revenue (Million) Forecast, by Application 2020 & 2033
Frequently Asked Questions
1. What is the projected Compound Annual Growth Rate (CAGR) of the GCC Dangerous Goods Freight Market?
The projected CAGR is approximately > 5.00%.
2. Which companies are prominent players in the GCC Dangerous Goods Freight Market?
Key companies in the market include AAA Freight Services LLC, Hellmann Worldwide Logistics SE & Co, Bertschi AG, GAC, Petrochem, Agility, Al Ghazal Transport UAE**List Not Exhaustive, BDP INTERNATIONAL, Al Futtaim - Logistics, TALKE Group.
3. What are the main segments of the GCC Dangerous Goods Freight Market?
The market segments include Service.
4. Can you provide details about the market size?
The market size is estimated to be USD XX Million as of 2022.
5. What are some drivers contributing to market growth?
Growing Chemical and Refinery Industries Driving Market Growth.
6. What are the notable trends driving market growth?
Recovery of Chemical Industry.
7. Are there any restraints impacting market growth?
Challenges in Cross Boarder Shipping.
8. Can you provide examples of recent developments in the market?
June 2023: Magnate Worldwide is pleased to announce the acquisition of Cargo Logistics Group, a leading custom logistics service provider. In line with Magnate's organic and M&A growth strategy, Cargo Logistics Group is highly specialized, providing comprehensive logistics solutions for international and domestic mission-critical supply chains. CLG will become part of Masterpiece International and expand its footprint, adding a direct presence in the Baltimore and Washington DC area
9. What pricing options are available for accessing the report?
Pricing options include single-user, multi-user, and enterprise licenses priced at USD 3800, USD 4500, and USD 5800 respectively.
10. Is the market size provided in terms of value or volume?
The market size is provided in terms of value, measured in Million.
11. Are there any specific market keywords associated with the report?
Yes, the market keyword associated with the report is "GCC Dangerous Goods Freight Market," which aids in identifying and referencing the specific market segment covered.
12. How do I determine which pricing option suits my needs best?
The pricing options vary based on user requirements and access needs. Individual users may opt for single-user licenses, while businesses requiring broader access may choose multi-user or enterprise licenses for cost-effective access to the report.
13. Are there any additional resources or data provided in the GCC Dangerous Goods Freight Market report?
While the report offers comprehensive insights, it's advisable to review the specific contents or supplementary materials provided to ascertain if additional resources or data are available.
14. How can I stay updated on further developments or reports in the GCC Dangerous Goods Freight Market?
To stay informed about further developments, trends, and reports in the GCC Dangerous Goods Freight Market, consider subscribing to industry newsletters, following relevant companies and organizations, or regularly checking reputable industry news sources and publications.
Methodology
Step 1 - Identification of Relevant Samples Size from Population Database


Step 2 - Approaches for Defining Global Market Size (Value, Volume* & Price*)

Note*: In applicable scenarios
Step 3 - Data Sources
Primary Research
- Web Analytics
- Survey Reports
- Research Institute
- Latest Research Reports
- Opinion Leaders
Secondary Research
- Annual Reports
- White Paper
- Latest Press Release
- Industry Association
- Paid Database
- Investor Presentations

Step 4 - Data Triangulation
Involves using different sources of information in order to increase the validity of a study
These sources are likely to be stakeholders in a program - participants, other researchers, program staff, other community members, and so on.
Then we put all data in single framework & apply various statistical tools to find out the dynamic on the market.
During the analysis stage, feedback from the stakeholder groups would be compared to determine areas of agreement as well as areas of divergence