

Key Insights
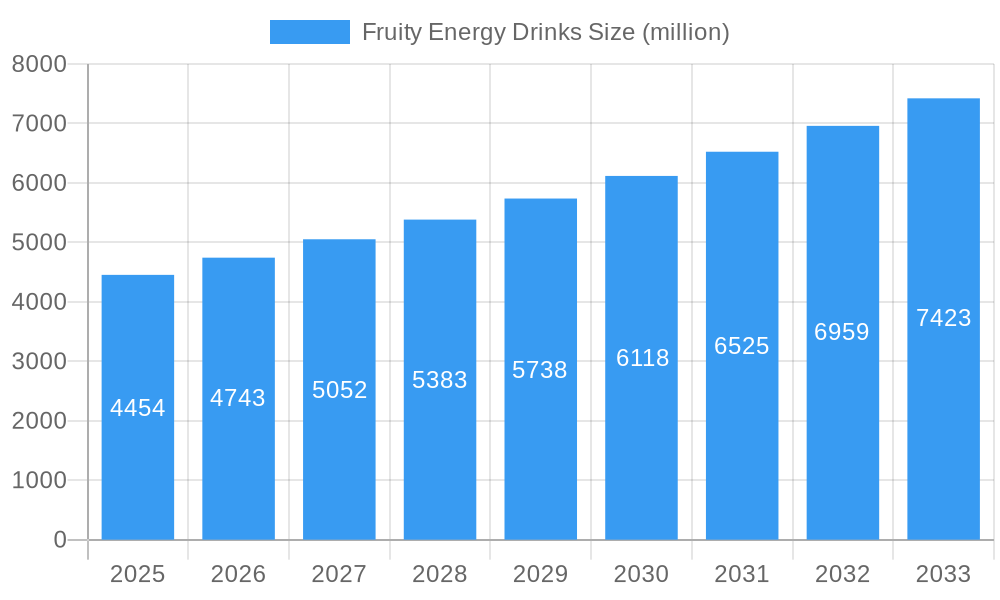
The global fruity energy drink market, valued at $4.454 billion in 2025, is projected to experience robust growth, driven by increasing consumer demand for healthier, more flavorful energy alternatives. The market's Compound Annual Growth Rate (CAGR) of 6.3% from 2019 to 2033 indicates a significant expansion over the forecast period (2025-2033). This growth is fueled by several key factors. Firstly, health-conscious consumers are increasingly seeking functional beverages that offer a boost of energy without the excessive sugar and artificial ingredients often found in traditional energy drinks. Fruity flavors cater to this preference, offering a refreshing and appealing alternative. Secondly, the rising popularity of on-the-go lifestyles and increased participation in fitness activities further contribute to the market's expansion. The expanding presence of fruity energy drinks in various retail channels, from supermarkets and convenience stores to online platforms, further enhances market accessibility. Finally, innovative product launches with unique flavor profiles and functional benefits, such as added vitamins or natural ingredients, are driving market diversification and capturing new consumer segments.
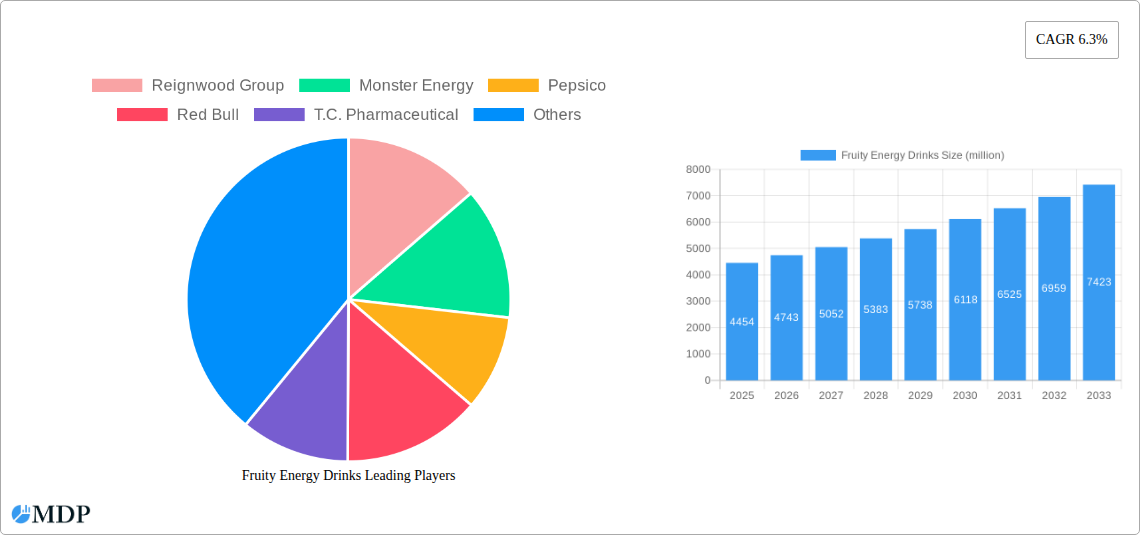
Fruity Energy Drinks Market Size (In Billion)
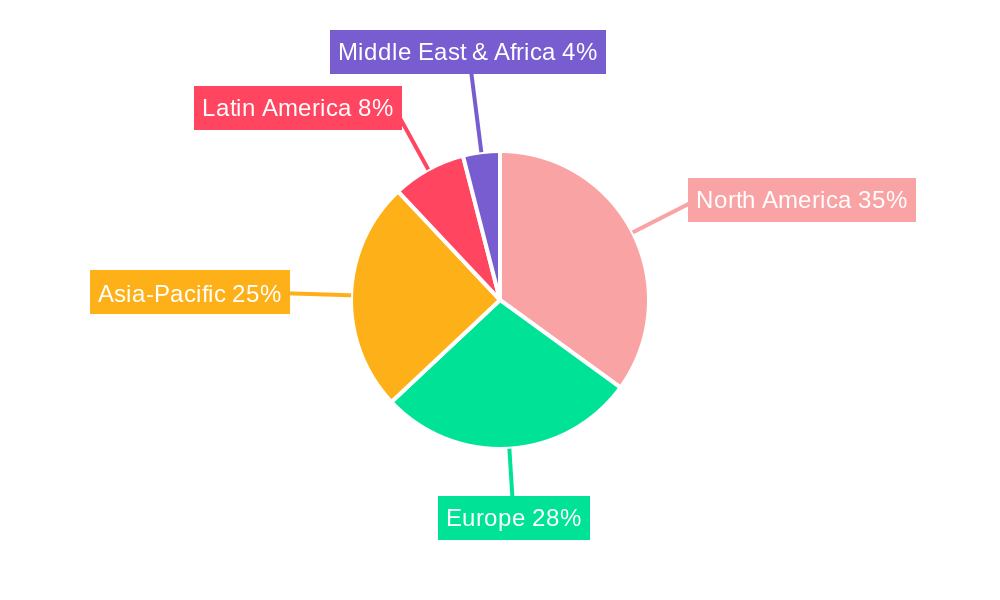
Major players like Red Bull, PepsiCo, and Monster Energy are already establishing a strong presence in this segment, with their diverse product portfolios and effective marketing strategies. However, the market also exhibits opportunities for smaller, niche brands focusing on organic ingredients, sustainable sourcing, and unique flavor combinations. Competition is anticipated to intensify, leading to increased product innovation and marketing efforts. The geographical distribution of the market likely mirrors global beverage trends, with North America and Europe holding significant market shares, while emerging markets in Asia and Latin America offer considerable growth potential. The ongoing trend towards healthier lifestyle choices and the increasing demand for convenient and flavorful energy options indicate that the fruity energy drink market is poised for continued expansion in the coming years. This growth trajectory is expected to be influenced by changing consumer preferences, technological advancements in beverage production, and the overall economic conditions in key markets.
Fruity Energy Drinks Company Market Share
Fruity Energy Drinks Market Report: A Comprehensive Analysis (2019-2033)
This comprehensive report provides a detailed analysis of the global fruity energy drinks market, offering invaluable insights for industry stakeholders, investors, and strategic decision-makers. Leveraging extensive research and data analysis spanning the period 2019-2033 (historical period: 2019-2024, base year: 2025, forecast period: 2025-2033), this report unveils the market's dynamics, key trends, and future growth potential. The market size is predicted to reach xx million by 2033, exhibiting a Compound Annual Growth Rate (CAGR) of xx% during the forecast period.
Fruity Energy Drinks Market Dynamics & Concentration
This section analyzes the competitive landscape of the fruity energy drinks market, examining market concentration, innovation drivers, regulatory frameworks, product substitutes, end-user trends, and mergers & acquisitions (M&A) activities. The market exhibits a moderately concentrated structure, with a few major players controlling a significant portion of the market share. Reignwood Group, Monster Energy, and Red Bull are key players showing significant market share, with estimates at xx%, xx%, and xx% respectively, in 2025. The remaining share is held by numerous smaller players, indicating significant competitive pressure.
- Market Concentration: High, with xx million in revenue controlled by the top five players in 2025.
- Innovation Drivers: Focus on natural ingredients, functional benefits (e.g., improved cognitive function), and sustainable packaging.
- Regulatory Framework: Varying regulations across different geographies impacting ingredient approvals and labeling requirements.
- Product Substitutes: Other functional beverages, sports drinks, and juices pose significant competitive pressure.
- End-User Trends: Growing demand from health-conscious consumers seeking natural energy alternatives.
- M&A Activities: xx M&A deals were recorded between 2019 and 2024, indicating strong consolidation within the market.
Fruity Energy Drinks Industry Trends & Analysis
This section delves into the key trends shaping the fruity energy drinks market. The market is experiencing significant growth driven by increasing consumer awareness of the benefits of energy drinks, alongside the growing preference for healthier and more natural options. Technological advancements, particularly in formulation and packaging, are also contributing to growth. The market penetration of fruity energy drinks continues to rise, particularly amongst younger demographics, indicating strong future growth potential. A steady CAGR of xx% is projected for the forecast period. This trend is influenced by evolving consumer preferences towards healthier, naturally flavored energy drinks and a growing trend of personalization within the beverage industry. The competitive landscape is marked by both intense competition and strategic collaborations between established players and innovative startups. The continued rise of e-commerce further drives market expansion and accelerates consumer access.
Leading Markets & Segments in Fruity Energy Drinks
This section identifies the dominant regions and segments within the fruity energy drinks market. The North American market maintains a leading position, driven by high consumer spending and strong brand presence.
Key Drivers in North America:
- Strong consumer demand for convenient and functional beverages.
- High disposable incomes and spending power.
- Established distribution networks.
- Favorable regulatory environments.
Dominance Analysis: The dominance of North America is attributed to its high market penetration, strong consumer preference for flavored beverages, and the established presence of major players. Other regions such as Europe and Asia-Pacific exhibit promising growth but lag behind North America's market maturity.
Fruity Energy Drinks Product Developments
Recent product innovations focus on low-sugar or sugar-free formulations, natural flavorings, and functional ingredients aimed at enhancing athletic performance or cognitive function. This reflects consumer demand for healthier and more functional energy drinks. The integration of sustainable packaging materials is also gaining momentum, indicating a growing environmental consciousness within the industry. These advancements enhance the competitive advantage of brands by catering to evolving consumer needs.
Key Drivers of Fruity Energy Drinks Growth
Several factors are driving the growth of the fruity energy drinks market. Increasing health awareness and the preference for natural ingredients are key contributors, alongside expanding distribution channels and technological advancements in product formulation and packaging. Favorable regulatory environments in specific regions also encourage market expansion. The rising disposable incomes in emerging economies further boost demand, particularly amongst younger populations.
Challenges in the Fruity Energy Drinks Market
The fruity energy drinks market faces several challenges, including stringent regulations related to ingredients and labeling, fluctuations in raw material costs, and intense competition. Supply chain disruptions also pose a significant risk, affecting production and distribution. The growing public concern over sugar content and potential health effects limits expansion, impacting the market share and growth rate. These challenges impact revenue by xx million annually.
Emerging Opportunities in Fruity Energy Drinks
Emerging opportunities include the expansion into new markets, particularly in developing economies with growing disposable incomes. Technological breakthroughs in sustainable packaging and natural ingredient sourcing present significant growth potential. Strategic partnerships and collaborations amongst industry players will drive innovation and enhance product offerings, leading to significant revenue growth.
Leading Players in the Fruity Energy Drinks Sector
- Reignwood Group
- Monster Energy
- Pepsico
- Red Bull
- T.C. Pharmaceutical
- AriZona Beverages
- Keurig Dr Pepper
- National Beverage
- Taisho Pharmaceutical Holdings
- Alinamin Pharmaceutical
- Otsuka Holdings
- Suntory
- Eastroc Beverage
- Dali Foods
- Henan Zhongwo
Key Milestones in Fruity Energy Drinks Industry
- 2020: Increased focus on sustainable packaging by major players.
- 2021: Launch of several low-sugar/sugar-free fruity energy drink variants.
- 2022: Significant investment in research & development of functional ingredients.
- 2023: Several strategic partnerships to enhance distribution networks.
- 2024: Growing interest in personalized energy drinks tailored to specific consumer needs.
Strategic Outlook for Fruity Energy Drinks Market
The fruity energy drinks market exhibits promising long-term growth prospects, driven by evolving consumer preferences, technological advancements, and increasing health awareness. Strategic opportunities lie in innovation, focusing on natural ingredients, sustainable packaging, and functional benefits. Expanding distribution networks and strategic partnerships with key players will further enhance market penetration and overall growth. The market's future potential is significant, with a predicted xx million revenue by 2033, creating numerous opportunities for growth and investment.
Fruity Energy Drinks Segmentation
-
1. Application
- 1.1. Offline Sale
- 1.2. Online Sale
-
2. Type
- 2.1. Lime
- 2.2. Mango
- 2.3. Apple
- 2.4. Strawberry
- 2.5. Others
Fruity Energy Drinks Segmentation By Geography
-
1. North America
- 1.1. United States
- 1.2. Canada
- 1.3. Mexico
-
2. South America
- 2.1. Brazil
- 2.2. Argentina
- 2.3. Rest of South America
-
3. Europe
- 3.1. United Kingdom
- 3.2. Germany
- 3.3. France
- 3.4. Italy
- 3.5. Spain
- 3.6. Russia
- 3.7. Benelux
- 3.8. Nordics
- 3.9. Rest of Europe
-
4. Middle East & Africa
- 4.1. Turkey
- 4.2. Israel
- 4.3. GCC
- 4.4. North Africa
- 4.5. South Africa
- 4.6. Rest of Middle East & Africa
-
5. Asia Pacific
- 5.1. China
- 5.2. India
- 5.3. Japan
- 5.4. South Korea
- 5.5. ASEAN
- 5.6. Oceania
- 5.7. Rest of Asia Pacific
Fruity Energy Drinks Regional Market Share
Geographic Coverage of Fruity Energy Drinks
Fruity Energy Drinks REPORT HIGHLIGHTS
| Aspects | Details |
|---|---|
| Study Period | 2020-2034 |
| Base Year | 2025 |
| Estimated Year | 2026 |
| Forecast Period | 2026-2034 |
| Historical Period | 2020-2025 |
| Growth Rate | CAGR of 6.3% from 2020-2034 |
| Segmentation |
|
Table of Contents
- 1. Introduction
- 1.1. Research Scope
- 1.2. Market Segmentation
- 1.3. Research Methodology
- 1.4. Definitions and Assumptions
- 2. Executive Summary
- 2.1. Introduction
- 3. Market Dynamics
- 3.1. Introduction
- 3.2. Market Drivers
- 3.3. Market Restrains
- 3.4. Market Trends
- 4. Market Factor Analysis
- 4.1. Porters Five Forces
- 4.2. Supply/Value Chain
- 4.3. PESTEL analysis
- 4.4. Market Entropy
- 4.5. Patent/Trademark Analysis
- 5. Global Fruity Energy Drinks Analysis, Insights and Forecast, 2020-2032
- 5.1. Market Analysis, Insights and Forecast - by Application
- 5.1.1. Offline Sale
- 5.1.2. Online Sale
- 5.2. Market Analysis, Insights and Forecast - by Type
- 5.2.1. Lime
- 5.2.2. Mango
- 5.2.3. Apple
- 5.2.4. Strawberry
- 5.2.5. Others
- 5.3. Market Analysis, Insights and Forecast - by Region
- 5.3.1. North America
- 5.3.2. South America
- 5.3.3. Europe
- 5.3.4. Middle East & Africa
- 5.3.5. Asia Pacific
- 5.1. Market Analysis, Insights and Forecast - by Application
- 6. North America Fruity Energy Drinks Analysis, Insights and Forecast, 2020-2032
- 6.1. Market Analysis, Insights and Forecast - by Application
- 6.1.1. Offline Sale
- 6.1.2. Online Sale
- 6.2. Market Analysis, Insights and Forecast - by Type
- 6.2.1. Lime
- 6.2.2. Mango
- 6.2.3. Apple
- 6.2.4. Strawberry
- 6.2.5. Others
- 6.1. Market Analysis, Insights and Forecast - by Application
- 7. South America Fruity Energy Drinks Analysis, Insights and Forecast, 2020-2032
- 7.1. Market Analysis, Insights and Forecast - by Application
- 7.1.1. Offline Sale
- 7.1.2. Online Sale
- 7.2. Market Analysis, Insights and Forecast - by Type
- 7.2.1. Lime
- 7.2.2. Mango
- 7.2.3. Apple
- 7.2.4. Strawberry
- 7.2.5. Others
- 7.1. Market Analysis, Insights and Forecast - by Application
- 8. Europe Fruity Energy Drinks Analysis, Insights and Forecast, 2020-2032
- 8.1. Market Analysis, Insights and Forecast - by Application
- 8.1.1. Offline Sale
- 8.1.2. Online Sale
- 8.2. Market Analysis, Insights and Forecast - by Type
- 8.2.1. Lime
- 8.2.2. Mango
- 8.2.3. Apple
- 8.2.4. Strawberry
- 8.2.5. Others
- 8.1. Market Analysis, Insights and Forecast - by Application
- 9. Middle East & Africa Fruity Energy Drinks Analysis, Insights and Forecast, 2020-2032
- 9.1. Market Analysis, Insights and Forecast - by Application
- 9.1.1. Offline Sale
- 9.1.2. Online Sale
- 9.2. Market Analysis, Insights and Forecast - by Type
- 9.2.1. Lime
- 9.2.2. Mango
- 9.2.3. Apple
- 9.2.4. Strawberry
- 9.2.5. Others
- 9.1. Market Analysis, Insights and Forecast - by Application
- 10. Asia Pacific Fruity Energy Drinks Analysis, Insights and Forecast, 2020-2032
- 10.1. Market Analysis, Insights and Forecast - by Application
- 10.1.1. Offline Sale
- 10.1.2. Online Sale
- 10.2. Market Analysis, Insights and Forecast - by Type
- 10.2.1. Lime
- 10.2.2. Mango
- 10.2.3. Apple
- 10.2.4. Strawberry
- 10.2.5. Others
- 10.1. Market Analysis, Insights and Forecast - by Application
- 11. Competitive Analysis
- 11.1. Global Market Share Analysis 2025
- 11.2. Company Profiles
- 11.2.1 Reignwood Group
- 11.2.1.1. Overview
- 11.2.1.2. Products
- 11.2.1.3. SWOT Analysis
- 11.2.1.4. Recent Developments
- 11.2.1.5. Financials (Based on Availability)
- 11.2.2 Monster Energy
- 11.2.2.1. Overview
- 11.2.2.2. Products
- 11.2.2.3. SWOT Analysis
- 11.2.2.4. Recent Developments
- 11.2.2.5. Financials (Based on Availability)
- 11.2.3 Pepsico
- 11.2.3.1. Overview
- 11.2.3.2. Products
- 11.2.3.3. SWOT Analysis
- 11.2.3.4. Recent Developments
- 11.2.3.5. Financials (Based on Availability)
- 11.2.4 Red Bull
- 11.2.4.1. Overview
- 11.2.4.2. Products
- 11.2.4.3. SWOT Analysis
- 11.2.4.4. Recent Developments
- 11.2.4.5. Financials (Based on Availability)
- 11.2.5 T.C. Pharmaceutical
- 11.2.5.1. Overview
- 11.2.5.2. Products
- 11.2.5.3. SWOT Analysis
- 11.2.5.4. Recent Developments
- 11.2.5.5. Financials (Based on Availability)
- 11.2.6 AriZona Beverages
- 11.2.6.1. Overview
- 11.2.6.2. Products
- 11.2.6.3. SWOT Analysis
- 11.2.6.4. Recent Developments
- 11.2.6.5. Financials (Based on Availability)
- 11.2.7 Keurig Dr Pepper
- 11.2.7.1. Overview
- 11.2.7.2. Products
- 11.2.7.3. SWOT Analysis
- 11.2.7.4. Recent Developments
- 11.2.7.5. Financials (Based on Availability)
- 11.2.8 National Beverage
- 11.2.8.1. Overview
- 11.2.8.2. Products
- 11.2.8.3. SWOT Analysis
- 11.2.8.4. Recent Developments
- 11.2.8.5. Financials (Based on Availability)
- 11.2.9 Taisho Pharmaceutical Holdings
- 11.2.9.1. Overview
- 11.2.9.2. Products
- 11.2.9.3. SWOT Analysis
- 11.2.9.4. Recent Developments
- 11.2.9.5. Financials (Based on Availability)
- 11.2.10 Alinamin Pharmaceutical
- 11.2.10.1. Overview
- 11.2.10.2. Products
- 11.2.10.3. SWOT Analysis
- 11.2.10.4. Recent Developments
- 11.2.10.5. Financials (Based on Availability)
- 11.2.11 Otsuka Holdings
- 11.2.11.1. Overview
- 11.2.11.2. Products
- 11.2.11.3. SWOT Analysis
- 11.2.11.4. Recent Developments
- 11.2.11.5. Financials (Based on Availability)
- 11.2.12 Suntory
- 11.2.12.1. Overview
- 11.2.12.2. Products
- 11.2.12.3. SWOT Analysis
- 11.2.12.4. Recent Developments
- 11.2.12.5. Financials (Based on Availability)
- 11.2.13 Eastroc Beverage
- 11.2.13.1. Overview
- 11.2.13.2. Products
- 11.2.13.3. SWOT Analysis
- 11.2.13.4. Recent Developments
- 11.2.13.5. Financials (Based on Availability)
- 11.2.14 Dali Foods
- 11.2.14.1. Overview
- 11.2.14.2. Products
- 11.2.14.3. SWOT Analysis
- 11.2.14.4. Recent Developments
- 11.2.14.5. Financials (Based on Availability)
- 11.2.15 Henan Zhongwo
- 11.2.15.1. Overview
- 11.2.15.2. Products
- 11.2.15.3. SWOT Analysis
- 11.2.15.4. Recent Developments
- 11.2.15.5. Financials (Based on Availability)
- 11.2.1 Reignwood Group
List of Figures
- Figure 1: Global Fruity Energy Drinks Revenue Breakdown (million, %) by Region 2025 & 2033
- Figure 2: North America Fruity Energy Drinks Revenue (million), by Application 2025 & 2033
- Figure 3: North America Fruity Energy Drinks Revenue Share (%), by Application 2025 & 2033
- Figure 4: North America Fruity Energy Drinks Revenue (million), by Type 2025 & 2033
- Figure 5: North America Fruity Energy Drinks Revenue Share (%), by Type 2025 & 2033
- Figure 6: North America Fruity Energy Drinks Revenue (million), by Country 2025 & 2033
- Figure 7: North America Fruity Energy Drinks Revenue Share (%), by Country 2025 & 2033
- Figure 8: South America Fruity Energy Drinks Revenue (million), by Application 2025 & 2033
- Figure 9: South America Fruity Energy Drinks Revenue Share (%), by Application 2025 & 2033
- Figure 10: South America Fruity Energy Drinks Revenue (million), by Type 2025 & 2033
- Figure 11: South America Fruity Energy Drinks Revenue Share (%), by Type 2025 & 2033
- Figure 12: South America Fruity Energy Drinks Revenue (million), by Country 2025 & 2033
- Figure 13: South America Fruity Energy Drinks Revenue Share (%), by Country 2025 & 2033
- Figure 14: Europe Fruity Energy Drinks Revenue (million), by Application 2025 & 2033
- Figure 15: Europe Fruity Energy Drinks Revenue Share (%), by Application 2025 & 2033
- Figure 16: Europe Fruity Energy Drinks Revenue (million), by Type 2025 & 2033
- Figure 17: Europe Fruity Energy Drinks Revenue Share (%), by Type 2025 & 2033
- Figure 18: Europe Fruity Energy Drinks Revenue (million), by Country 2025 & 2033
- Figure 19: Europe Fruity Energy Drinks Revenue Share (%), by Country 2025 & 2033
- Figure 20: Middle East & Africa Fruity Energy Drinks Revenue (million), by Application 2025 & 2033
- Figure 21: Middle East & Africa Fruity Energy Drinks Revenue Share (%), by Application 2025 & 2033
- Figure 22: Middle East & Africa Fruity Energy Drinks Revenue (million), by Type 2025 & 2033
- Figure 23: Middle East & Africa Fruity Energy Drinks Revenue Share (%), by Type 2025 & 2033
- Figure 24: Middle East & Africa Fruity Energy Drinks Revenue (million), by Country 2025 & 2033
- Figure 25: Middle East & Africa Fruity Energy Drinks Revenue Share (%), by Country 2025 & 2033
- Figure 26: Asia Pacific Fruity Energy Drinks Revenue (million), by Application 2025 & 2033
- Figure 27: Asia Pacific Fruity Energy Drinks Revenue Share (%), by Application 2025 & 2033
- Figure 28: Asia Pacific Fruity Energy Drinks Revenue (million), by Type 2025 & 2033
- Figure 29: Asia Pacific Fruity Energy Drinks Revenue Share (%), by Type 2025 & 2033
- Figure 30: Asia Pacific Fruity Energy Drinks Revenue (million), by Country 2025 & 2033
- Figure 31: Asia Pacific Fruity Energy Drinks Revenue Share (%), by Country 2025 & 2033
List of Tables
- Table 1: Global Fruity Energy Drinks Revenue million Forecast, by Application 2020 & 2033
- Table 2: Global Fruity Energy Drinks Revenue million Forecast, by Type 2020 & 2033
- Table 3: Global Fruity Energy Drinks Revenue million Forecast, by Region 2020 & 2033
- Table 4: Global Fruity Energy Drinks Revenue million Forecast, by Application 2020 & 2033
- Table 5: Global Fruity Energy Drinks Revenue million Forecast, by Type 2020 & 2033
- Table 6: Global Fruity Energy Drinks Revenue million Forecast, by Country 2020 & 2033
- Table 7: United States Fruity Energy Drinks Revenue (million) Forecast, by Application 2020 & 2033
- Table 8: Canada Fruity Energy Drinks Revenue (million) Forecast, by Application 2020 & 2033
- Table 9: Mexico Fruity Energy Drinks Revenue (million) Forecast, by Application 2020 & 2033
- Table 10: Global Fruity Energy Drinks Revenue million Forecast, by Application 2020 & 2033
- Table 11: Global Fruity Energy Drinks Revenue million Forecast, by Type 2020 & 2033
- Table 12: Global Fruity Energy Drinks Revenue million Forecast, by Country 2020 & 2033
- Table 13: Brazil Fruity Energy Drinks Revenue (million) Forecast, by Application 2020 & 2033
- Table 14: Argentina Fruity Energy Drinks Revenue (million) Forecast, by Application 2020 & 2033
- Table 15: Rest of South America Fruity Energy Drinks Revenue (million) Forecast, by Application 2020 & 2033
- Table 16: Global Fruity Energy Drinks Revenue million Forecast, by Application 2020 & 2033
- Table 17: Global Fruity Energy Drinks Revenue million Forecast, by Type 2020 & 2033
- Table 18: Global Fruity Energy Drinks Revenue million Forecast, by Country 2020 & 2033
- Table 19: United Kingdom Fruity Energy Drinks Revenue (million) Forecast, by Application 2020 & 2033
- Table 20: Germany Fruity Energy Drinks Revenue (million) Forecast, by Application 2020 & 2033
- Table 21: France Fruity Energy Drinks Revenue (million) Forecast, by Application 2020 & 2033
- Table 22: Italy Fruity Energy Drinks Revenue (million) Forecast, by Application 2020 & 2033
- Table 23: Spain Fruity Energy Drinks Revenue (million) Forecast, by Application 2020 & 2033
- Table 24: Russia Fruity Energy Drinks Revenue (million) Forecast, by Application 2020 & 2033
- Table 25: Benelux Fruity Energy Drinks Revenue (million) Forecast, by Application 2020 & 2033
- Table 26: Nordics Fruity Energy Drinks Revenue (million) Forecast, by Application 2020 & 2033
- Table 27: Rest of Europe Fruity Energy Drinks Revenue (million) Forecast, by Application 2020 & 2033
- Table 28: Global Fruity Energy Drinks Revenue million Forecast, by Application 2020 & 2033
- Table 29: Global Fruity Energy Drinks Revenue million Forecast, by Type 2020 & 2033
- Table 30: Global Fruity Energy Drinks Revenue million Forecast, by Country 2020 & 2033
- Table 31: Turkey Fruity Energy Drinks Revenue (million) Forecast, by Application 2020 & 2033
- Table 32: Israel Fruity Energy Drinks Revenue (million) Forecast, by Application 2020 & 2033
- Table 33: GCC Fruity Energy Drinks Revenue (million) Forecast, by Application 2020 & 2033
- Table 34: North Africa Fruity Energy Drinks Revenue (million) Forecast, by Application 2020 & 2033
- Table 35: South Africa Fruity Energy Drinks Revenue (million) Forecast, by Application 2020 & 2033
- Table 36: Rest of Middle East & Africa Fruity Energy Drinks Revenue (million) Forecast, by Application 2020 & 2033
- Table 37: Global Fruity Energy Drinks Revenue million Forecast, by Application 2020 & 2033
- Table 38: Global Fruity Energy Drinks Revenue million Forecast, by Type 2020 & 2033
- Table 39: Global Fruity Energy Drinks Revenue million Forecast, by Country 2020 & 2033
- Table 40: China Fruity Energy Drinks Revenue (million) Forecast, by Application 2020 & 2033
- Table 41: India Fruity Energy Drinks Revenue (million) Forecast, by Application 2020 & 2033
- Table 42: Japan Fruity Energy Drinks Revenue (million) Forecast, by Application 2020 & 2033
- Table 43: South Korea Fruity Energy Drinks Revenue (million) Forecast, by Application 2020 & 2033
- Table 44: ASEAN Fruity Energy Drinks Revenue (million) Forecast, by Application 2020 & 2033
- Table 45: Oceania Fruity Energy Drinks Revenue (million) Forecast, by Application 2020 & 2033
- Table 46: Rest of Asia Pacific Fruity Energy Drinks Revenue (million) Forecast, by Application 2020 & 2033
Frequently Asked Questions
1. What is the projected Compound Annual Growth Rate (CAGR) of the Fruity Energy Drinks?
The projected CAGR is approximately 6.3%.
2. Which companies are prominent players in the Fruity Energy Drinks?
Key companies in the market include Reignwood Group, Monster Energy, Pepsico, Red Bull, T.C. Pharmaceutical, AriZona Beverages, Keurig Dr Pepper, National Beverage, Taisho Pharmaceutical Holdings, Alinamin Pharmaceutical, Otsuka Holdings, Suntory, Eastroc Beverage, Dali Foods, Henan Zhongwo.
3. What are the main segments of the Fruity Energy Drinks?
The market segments include Application, Type.
4. Can you provide details about the market size?
The market size is estimated to be USD 4454 million as of 2022.
5. What are some drivers contributing to market growth?
N/A
6. What are the notable trends driving market growth?
N/A
7. Are there any restraints impacting market growth?
N/A
8. Can you provide examples of recent developments in the market?
N/A
9. What pricing options are available for accessing the report?
Pricing options include single-user, multi-user, and enterprise licenses priced at USD 4250.00, USD 6375.00, and USD 8500.00 respectively.
10. Is the market size provided in terms of value or volume?
The market size is provided in terms of value, measured in million.
11. Are there any specific market keywords associated with the report?
Yes, the market keyword associated with the report is "Fruity Energy Drinks," which aids in identifying and referencing the specific market segment covered.
12. How do I determine which pricing option suits my needs best?
The pricing options vary based on user requirements and access needs. Individual users may opt for single-user licenses, while businesses requiring broader access may choose multi-user or enterprise licenses for cost-effective access to the report.
13. Are there any additional resources or data provided in the Fruity Energy Drinks report?
While the report offers comprehensive insights, it's advisable to review the specific contents or supplementary materials provided to ascertain if additional resources or data are available.
14. How can I stay updated on further developments or reports in the Fruity Energy Drinks?
To stay informed about further developments, trends, and reports in the Fruity Energy Drinks, consider subscribing to industry newsletters, following relevant companies and organizations, or regularly checking reputable industry news sources and publications.
Methodology
Step 1 - Identification of Relevant Samples Size from Population Database


Step 2 - Approaches for Defining Global Market Size (Value, Volume* & Price*)

Note*: In applicable scenarios
Step 3 - Data Sources
Primary Research
- Web Analytics
- Survey Reports
- Research Institute
- Latest Research Reports
- Opinion Leaders
Secondary Research
- Annual Reports
- White Paper
- Latest Press Release
- Industry Association
- Paid Database
- Investor Presentations

Step 4 - Data Triangulation
Involves using different sources of information in order to increase the validity of a study
These sources are likely to be stakeholders in a program - participants, other researchers, program staff, other community members, and so on.
Then we put all data in single framework & apply various statistical tools to find out the dynamic on the market.
During the analysis stage, feedback from the stakeholder groups would be compared to determine areas of agreement as well as areas of divergence