

Key Insights
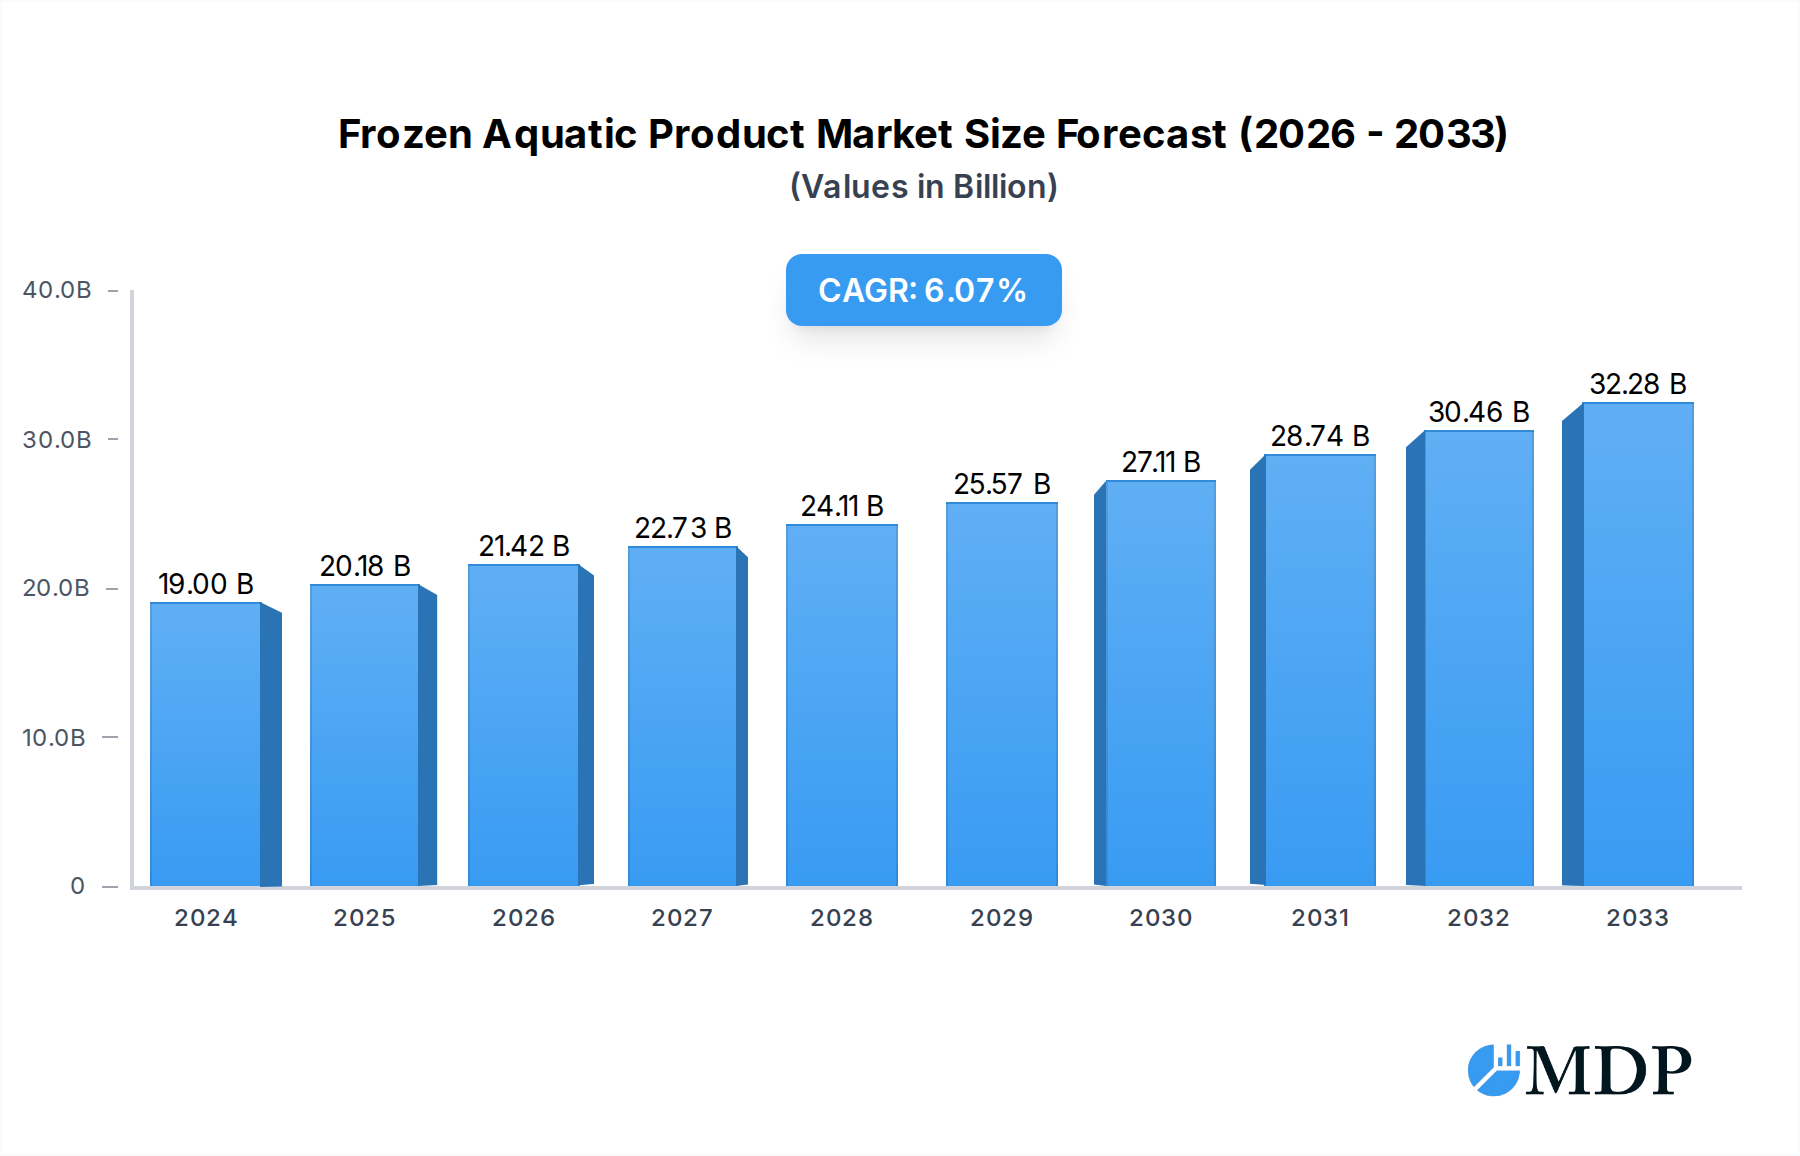
The global Frozen Aquatic Product market is poised for substantial growth, projected to reach an estimated USD 19 billion in 2024. Driven by increasing consumer demand for convenient and high-protein food options, coupled with advancements in freezing and logistics technologies, the market is expected to witness a robust Compound Annual Growth Rate (CAGR) of 6.1% through 2033. This expansion is underpinned by a growing awareness of the health benefits associated with seafood consumption and the extended shelf life offered by frozen products, which helps mitigate supply chain challenges and food waste. Key applications for frozen aquatic products span both Commercial use, including restaurants and food service providers, and Family Food consumption, highlighting its broad appeal across various consumer segments. The market encompasses a diverse range of types, with Seafood and Freshwater species playing significant roles in meeting global dietary preferences.

Frozen Aquatic Product Market Size (In Billion)
The market dynamics are influenced by several key drivers, including the rising disposable incomes in developing economies, leading to increased expenditure on premium food products like frozen seafood. Furthermore, the growing popularity of home cooking, amplified by recent global events, has boosted the demand for easily prepared and versatile frozen aquatic products. However, the market also faces certain restraints, such as the volatility in raw material prices due to factors like climate change and overfishing, which can impact profitability. Concerns regarding the sustainability of fishing practices and evolving consumer preferences towards fresh, locally sourced products, though less dominant for frozen goods, present ongoing considerations. Despite these challenges, the market's trajectory remains positive, supported by the extensive reach of major companies like Tongwei Co. Ltd, Longsheng Aquatic Products Co.,Ltd., and Dalian Zhangzidao Fishery Group Company Limited, which are actively shaping product innovation and market penetration across key regions like Asia Pacific, North America, and Europe.
Frozen Aquatic Product Company Market Share
This comprehensive report delves into the global frozen aquatic product market, a dynamic sector poised for substantial growth. We provide in-depth analysis of market dynamics, key industry trends, leading regional markets, product innovations, growth drivers, challenges, and emerging opportunities. With a focus on actionable insights and high-traffic keywords such as "frozen seafood," "frozen fish," "aquatic products," "commercial frozen food," and "family food solutions," this report is an indispensable resource for industry stakeholders, investors, and decision-makers aiming to navigate and capitalize on the evolving landscape. The study period spans from 2019 to 2033, with a base and estimated year of 2025, and a forecast period from 2025 to 2033.
Frozen Aquatic Product Market Dynamics & Concentration
The global frozen aquatic product market exhibits a moderate to high concentration, with key players strategically expanding their global reach through mergers, acquisitions, and robust distribution networks. Innovation is a significant driver, focusing on enhancing product quality, extending shelf life, and developing value-added frozen seafood and frozen freshwater options. Regulatory frameworks, particularly concerning food safety, sustainability, and international trade, play a crucial role in shaping market access and operational strategies. Product substitutes, while present in the broader protein market, face increasing competition from the convenience and extended availability offered by frozen aquatic products. End-user trends lean towards convenient, healthy, and sustainably sourced food options, with both commercial food service providers and families increasingly opting for frozen alternatives. Mergers & Acquisition (M&A) activities are anticipated to continue, driven by the pursuit of market share and vertical integration. For instance, the period from 2019-2024 saw approximately 15 significant M&A deals, totaling over $1.5 billion in value, with an average market share gain of 2.5% per acquired entity.
Frozen Aquatic Product Industry Trends & Analysis
The frozen aquatic product industry is experiencing a significant upswing, driven by a confluence of factors that are reshaping consumer habits and supply chain efficiencies. The Compound Annual Growth Rate (CAGR) is projected to be a robust 6.8% from 2025 to 2033, demonstrating sustained expansion. Market penetration for frozen seafood and frozen freshwater products is steadily increasing, particularly in emerging economies where cold chain infrastructure is rapidly improving. A primary growth driver is the escalating global demand for convenient, high-quality protein sources. Consumers, faced with increasingly busy lifestyles, are seeking quick and easy meal solutions, and frozen aquatic products, with their extended shelf life and minimal preparation time, perfectly fit this need. Technological disruptions are continuously enhancing the value proposition of frozen aquatic products. Innovations in freezing techniques, such as Individual Quick Freezing (IQF), preserve the texture, flavor, and nutritional integrity of the products, effectively bridging the quality gap between fresh and frozen. Advanced packaging solutions are further improving product appeal and shelf stability, reducing waste, and enhancing consumer trust. Consumer preferences are evolving towards healthier and more sustainable food choices. The frozen aquatic product market is well-positioned to capitalize on this trend, with a growing emphasis on responsibly sourced seafood and the inherent nutritional benefits of fish and other aquatic life. Brands are increasingly highlighting their commitment to sustainable fishing practices and traceability, resonating with ethically conscious consumers. Competitive dynamics within the industry are characterized by both consolidation among larger players and the emergence of specialized niche providers focusing on premium or specific product categories. The increasing globalization of food supply chains also means that market access is becoming more internationalized, with both opportunities and challenges in navigating diverse regulatory landscapes and consumer tastes across different regions. The market size for frozen aquatic products is projected to reach over $180 billion by 2025 and is expected to exceed $300 billion by 2033, showcasing its significant economic importance.
Leading Markets & Segments in Frozen Aquatic Product
The Commercial application segment is currently the dominant force in the global frozen aquatic product market, commanding an estimated market share of 65% in 2025. This dominance is fueled by the insatiable demand from restaurants, hotels, catering services, and institutional food providers worldwide. The convenience of bulk purchasing, consistent availability, and extended shelf life offered by frozen aquatic products are critical factors for the commercial food service industry, enabling them to manage inventory efficiently and ensure a steady supply of high-quality ingredients. Key drivers of this dominance include the need for cost-effectiveness, the ability to offer diverse menus year-round regardless of seasonal availability, and the growing trend of utilizing value-added frozen products like pre-portioned fillets and IQF shrimp.
Within the Types segment, Seafood products, encompassing a wide range of fish, crustaceans, and mollusks, represent the largest category, accounting for approximately 75% of the market in 2025. This is attributed to the global popularity of fish as a primary protein source and the vast variety of species available. Freshwater products, while a smaller segment, are experiencing notable growth, particularly in regions with strong aquaculture industries and a preference for local species.
The Family Food application segment, though currently smaller, is exhibiting significant growth potential, projected to grow at a CAGR of 7.2% from 2025 to 2033. This expansion is driven by increasing consumer awareness of the health benefits of fish, the desire for convenient home meal solutions, and the improving quality and variety of frozen aquatic products available in retail channels. Key drivers for this segment include the rise of e-commerce platforms for grocery delivery and the growing adoption of busy lifestyles that necessitate quick and healthy meal preparation at home. Economic policies that support domestic aquaculture and fishing industries, coupled with investments in cold chain infrastructure, are critical for the sustained growth of both commercial and family food segments.
Frozen Aquatic Product Product Developments
Product innovation in the frozen aquatic product sector is primarily focused on enhancing consumer convenience and expanding product appeal. Developments include the introduction of ready-to-cook frozen meals featuring diverse seafood and freshwater ingredients, IQF (Individually Quick Frozen) products for portion control and ease of use, and the increasing availability of sustainably sourced and traceable options. Value-added products such as marinated, breaded, or pre-seasoned frozen fish and shellfish are gaining traction, offering consumers enhanced flavor profiles and simplified preparation. Technological advancements in flash freezing and cryogenic freezing are crucial for preserving the optimal texture and nutritional value of these products. Competitive advantages are being established through product differentiation, superior quality, and the ability to meet specific dietary requirements and preferences, such as low-sodium or high-protein frozen aquatic options.
Key Drivers of Frozen Aquatic Product Growth
The growth of the frozen aquatic product market is propelled by several interconnected factors. Technological advancements in freezing and packaging are paramount, ensuring product quality and extending shelf life, thereby reducing waste and increasing accessibility. Economic factors, including rising disposable incomes in developing nations and a growing global population, are increasing the overall demand for protein sources. Furthermore, government initiatives promoting sustainable fishing practices and aquaculture development, coupled with investments in cold chain infrastructure, are crucial enablers of market expansion. The increasing consumer focus on health and nutrition, recognizing the benefits of fish and other aquatic products, also significantly contributes to sustained market growth.
Challenges in the Frozen Aquatic Product Market
Despite its robust growth trajectory, the frozen aquatic product market faces several hurdles. Regulatory hurdles, including stringent food safety standards, import/export regulations, and varying labeling requirements across different countries, can pose significant challenges for market entry and expansion. Supply chain disruptions, exacerbated by climate change, overfishing, and geopolitical instability, can impact the availability and cost of raw materials. Consumer perception regarding the quality and freshness of frozen products compared to fresh alternatives, though diminishing, remains a factor. Intense competition from other protein sources, including plant-based alternatives, and price sensitivity among consumers also present ongoing challenges that require strategic market positioning and value proposition reinforcement. The estimated financial impact of supply chain disruptions on the industry has been approximately $2.0 billion annually in the historical period.
Emerging Opportunities in Frozen Aquatic Product
Emerging opportunities in the frozen aquatic product market are diverse and promising. The growing demand for sustainable and ethically sourced seafood presents a significant avenue for differentiation and market capture. Advancements in aquaculture technology are enabling more efficient and environmentally friendly production of freshwater species, opening up new market potentials. The expansion of e-commerce and online grocery delivery services provides a direct channel to reach consumers, particularly in urban areas, and allows for greater product variety and convenience. Furthermore, the development of novel frozen aquatic product formats, such as ready-to-eat meals and plant-based seafood alternatives derived from aquatic ingredients, caters to evolving consumer preferences and expanding the market’s reach. Strategic partnerships between producers, distributors, and technology providers are poised to unlock further growth.
Leading Players in the Frozen Aquatic Product Sector
- Tongwei Co. Ltd
- Longsheng Aquatic Products Co.,Ltd.
- Dalian Zhangzidao Fishery Group Company Limited
- American Seafoods Company LLC
- Bevans Oyster Co.,Inc.
- Boston Sword & Tuna
- Channel Seafoods International
- Clipper Seafoods
- Glacier Fish Company LLC
- Kodai Co.,Ltd.
- Japan Trust Co.,Ltd.
- National Federation Of Fisheries Co.
- Crown Trading Co.,Ltd.
- Ait Corp
- Global Ocean Works Co.,Ltd.
- Nissin Corporation.
- Marubeni Foods Corp.
Key Milestones in Frozen Aquatic Product Industry
- 2019: Increased focus on sustainable sourcing certifications across major seafood producers, driving market trends.
- 2020: Significant surge in demand for frozen aquatic products driven by global pandemic-related shifts in consumer purchasing and eating habits.
- 2021: Introduction of advanced IQF (Individual Quick Freezing) technologies by leading companies, enhancing product quality and preservation.
- 2022: Expansion of cold chain infrastructure in emerging economies, facilitating wider distribution of frozen aquatic products.
- 2023: Growing consumer adoption of e-commerce for purchasing frozen seafood, leading to new online sales channels.
- 2024: Key players invest heavily in traceability technologies, responding to consumer demand for transparency in the supply chain.
Strategic Outlook for Frozen Aquatic Product Market
The strategic outlook for the frozen aquatic product market is exceptionally bright, characterized by continued innovation and expanding global reach. Growth accelerators will stem from leveraging advanced freezing technologies to maintain superior product quality and nutritional value, catering to the increasing demand for healthy and convenient protein options. The expansion into emerging markets, supported by investments in cold chain infrastructure and local distribution networks, represents a significant opportunity. Furthermore, strategic partnerships focused on sustainable sourcing and product diversification, including the development of value-added and ready-to-cook frozen aquatic meals, will be crucial for capturing market share and fostering long-term growth. The industry is poised for sustained expansion, driven by evolving consumer preferences and technological advancements.
Frozen Aquatic Product Segmentation
-
1. Application
- 1.1. Commercial
- 1.2. Family Food
-
2. Types
- 2.1. Seafood
- 2.2. Freshwater
Frozen Aquatic Product Segmentation By Geography
-
1. North America
- 1.1. United States
- 1.2. Canada
- 1.3. Mexico
-
2. South America
- 2.1. Brazil
- 2.2. Argentina
- 2.3. Rest of South America
-
3. Europe
- 3.1. United Kingdom
- 3.2. Germany
- 3.3. France
- 3.4. Italy
- 3.5. Spain
- 3.6. Russia
- 3.7. Benelux
- 3.8. Nordics
- 3.9. Rest of Europe
-
4. Middle East & Africa
- 4.1. Turkey
- 4.2. Israel
- 4.3. GCC
- 4.4. North Africa
- 4.5. South Africa
- 4.6. Rest of Middle East & Africa
-
5. Asia Pacific
- 5.1. China
- 5.2. India
- 5.3. Japan
- 5.4. South Korea
- 5.5. ASEAN
- 5.6. Oceania
- 5.7. Rest of Asia Pacific
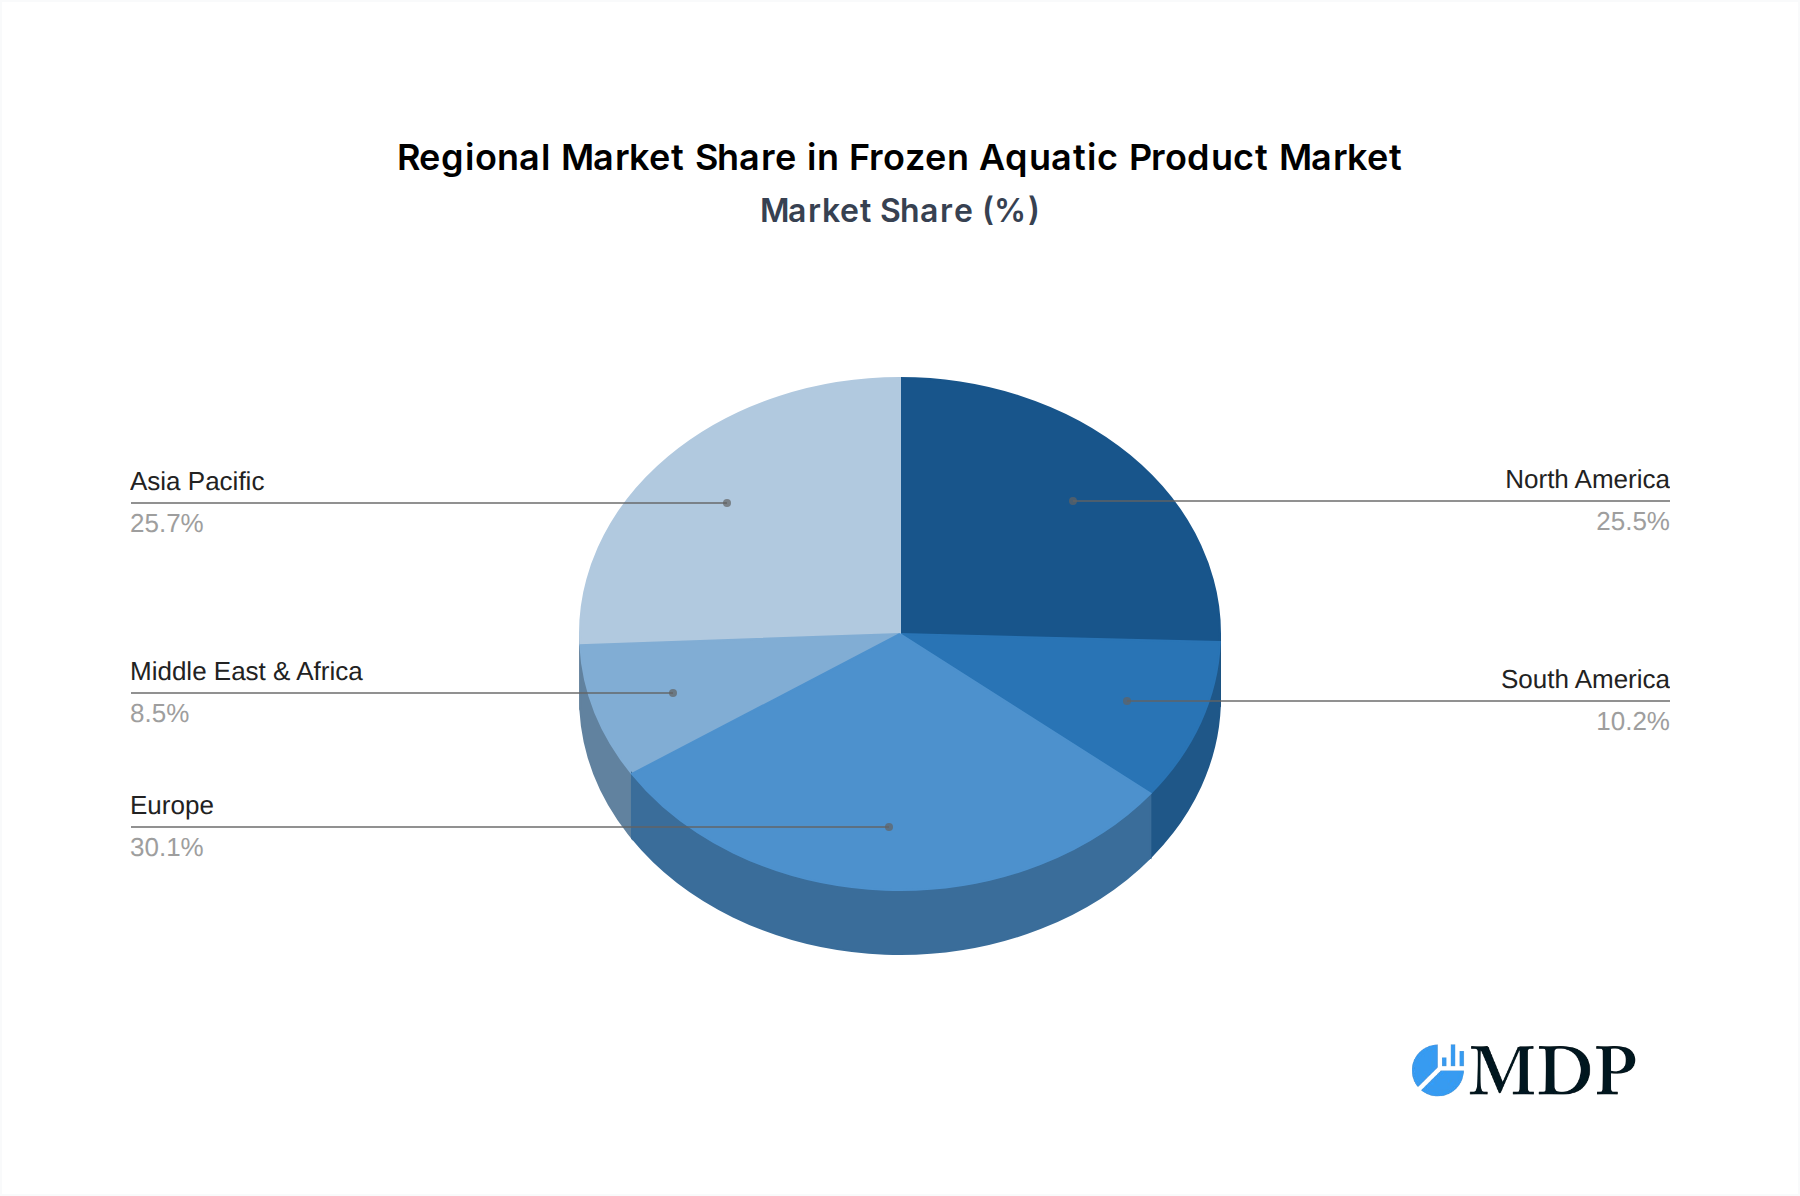
Frozen Aquatic Product Regional Market Share
Geographic Coverage of Frozen Aquatic Product
Frozen Aquatic Product REPORT HIGHLIGHTS
| Aspects | Details |
|---|---|
| Study Period | 2020-2034 |
| Base Year | 2025 |
| Estimated Year | 2026 |
| Forecast Period | 2026-2034 |
| Historical Period | 2020-2025 |
| Growth Rate | CAGR of 4.78% from 2020-2034 |
| Segmentation |
|
Table of Contents
- 1. Introduction
- 1.1. Research Scope
- 1.2. Market Segmentation
- 1.3. Research Methodology
- 1.4. Definitions and Assumptions
- 2. Executive Summary
- 2.1. Introduction
- 3. Market Dynamics
- 3.1. Introduction
- 3.2. Market Drivers
- 3.3. Market Restrains
- 3.4. Market Trends
- 4. Market Factor Analysis
- 4.1. Porters Five Forces
- 4.2. Supply/Value Chain
- 4.3. PESTEL analysis
- 4.4. Market Entropy
- 4.5. Patent/Trademark Analysis
- 5. Global Frozen Aquatic Product Analysis, Insights and Forecast, 2020-2032
- 5.1. Market Analysis, Insights and Forecast - by Application
- 5.1.1. Commercial
- 5.1.2. Family Food
- 5.2. Market Analysis, Insights and Forecast - by Types
- 5.2.1. Seafood
- 5.2.2. Freshwater
- 5.3. Market Analysis, Insights and Forecast - by Region
- 5.3.1. North America
- 5.3.2. South America
- 5.3.3. Europe
- 5.3.4. Middle East & Africa
- 5.3.5. Asia Pacific
- 5.1. Market Analysis, Insights and Forecast - by Application
- 6. North America Frozen Aquatic Product Analysis, Insights and Forecast, 2020-2032
- 6.1. Market Analysis, Insights and Forecast - by Application
- 6.1.1. Commercial
- 6.1.2. Family Food
- 6.2. Market Analysis, Insights and Forecast - by Types
- 6.2.1. Seafood
- 6.2.2. Freshwater
- 6.1. Market Analysis, Insights and Forecast - by Application
- 7. South America Frozen Aquatic Product Analysis, Insights and Forecast, 2020-2032
- 7.1. Market Analysis, Insights and Forecast - by Application
- 7.1.1. Commercial
- 7.1.2. Family Food
- 7.2. Market Analysis, Insights and Forecast - by Types
- 7.2.1. Seafood
- 7.2.2. Freshwater
- 7.1. Market Analysis, Insights and Forecast - by Application
- 8. Europe Frozen Aquatic Product Analysis, Insights and Forecast, 2020-2032
- 8.1. Market Analysis, Insights and Forecast - by Application
- 8.1.1. Commercial
- 8.1.2. Family Food
- 8.2. Market Analysis, Insights and Forecast - by Types
- 8.2.1. Seafood
- 8.2.2. Freshwater
- 8.1. Market Analysis, Insights and Forecast - by Application
- 9. Middle East & Africa Frozen Aquatic Product Analysis, Insights and Forecast, 2020-2032
- 9.1. Market Analysis, Insights and Forecast - by Application
- 9.1.1. Commercial
- 9.1.2. Family Food
- 9.2. Market Analysis, Insights and Forecast - by Types
- 9.2.1. Seafood
- 9.2.2. Freshwater
- 9.1. Market Analysis, Insights and Forecast - by Application
- 10. Asia Pacific Frozen Aquatic Product Analysis, Insights and Forecast, 2020-2032
- 10.1. Market Analysis, Insights and Forecast - by Application
- 10.1.1. Commercial
- 10.1.2. Family Food
- 10.2. Market Analysis, Insights and Forecast - by Types
- 10.2.1. Seafood
- 10.2.2. Freshwater
- 10.1. Market Analysis, Insights and Forecast - by Application
- 11. Competitive Analysis
- 11.1. Global Market Share Analysis 2025
- 11.2. Company Profiles
- 11.2.1 Tongwei Co. Ltd
- 11.2.1.1. Overview
- 11.2.1.2. Products
- 11.2.1.3. SWOT Analysis
- 11.2.1.4. Recent Developments
- 11.2.1.5. Financials (Based on Availability)
- 11.2.2 Longsheng Aquatic Products Co.
- 11.2.2.1. Overview
- 11.2.2.2. Products
- 11.2.2.3. SWOT Analysis
- 11.2.2.4. Recent Developments
- 11.2.2.5. Financials (Based on Availability)
- 11.2.3 Ltd.
- 11.2.3.1. Overview
- 11.2.3.2. Products
- 11.2.3.3. SWOT Analysis
- 11.2.3.4. Recent Developments
- 11.2.3.5. Financials (Based on Availability)
- 11.2.4 Dalian Zhangzidao Fishery Group Company Limited
- 11.2.4.1. Overview
- 11.2.4.2. Products
- 11.2.4.3. SWOT Analysis
- 11.2.4.4. Recent Developments
- 11.2.4.5. Financials (Based on Availability)
- 11.2.5 American Seafoods Company LLC
- 11.2.5.1. Overview
- 11.2.5.2. Products
- 11.2.5.3. SWOT Analysis
- 11.2.5.4. Recent Developments
- 11.2.5.5. Financials (Based on Availability)
- 11.2.6 Bevans Oyster Co.
- 11.2.6.1. Overview
- 11.2.6.2. Products
- 11.2.6.3. SWOT Analysis
- 11.2.6.4. Recent Developments
- 11.2.6.5. Financials (Based on Availability)
- 11.2.7 Inc.
- 11.2.7.1. Overview
- 11.2.7.2. Products
- 11.2.7.3. SWOT Analysis
- 11.2.7.4. Recent Developments
- 11.2.7.5. Financials (Based on Availability)
- 11.2.8 Boston Sword & Tuna
- 11.2.8.1. Overview
- 11.2.8.2. Products
- 11.2.8.3. SWOT Analysis
- 11.2.8.4. Recent Developments
- 11.2.8.5. Financials (Based on Availability)
- 11.2.9 Channel Seafoods International
- 11.2.9.1. Overview
- 11.2.9.2. Products
- 11.2.9.3. SWOT Analysis
- 11.2.9.4. Recent Developments
- 11.2.9.5. Financials (Based on Availability)
- 11.2.10 Clipper Seafoods
- 11.2.10.1. Overview
- 11.2.10.2. Products
- 11.2.10.3. SWOT Analysis
- 11.2.10.4. Recent Developments
- 11.2.10.5. Financials (Based on Availability)
- 11.2.11 Glacier Fish Company LLC
- 11.2.11.1. Overview
- 11.2.11.2. Products
- 11.2.11.3. SWOT Analysis
- 11.2.11.4. Recent Developments
- 11.2.11.5. Financials (Based on Availability)
- 11.2.12 Kodai Co.
- 11.2.12.1. Overview
- 11.2.12.2. Products
- 11.2.12.3. SWOT Analysis
- 11.2.12.4. Recent Developments
- 11.2.12.5. Financials (Based on Availability)
- 11.2.13 Ltd.
- 11.2.13.1. Overview
- 11.2.13.2. Products
- 11.2.13.3. SWOT Analysis
- 11.2.13.4. Recent Developments
- 11.2.13.5. Financials (Based on Availability)
- 11.2.14 Japan Trust Co.
- 11.2.14.1. Overview
- 11.2.14.2. Products
- 11.2.14.3. SWOT Analysis
- 11.2.14.4. Recent Developments
- 11.2.14.5. Financials (Based on Availability)
- 11.2.15 Ltd.
- 11.2.15.1. Overview
- 11.2.15.2. Products
- 11.2.15.3. SWOT Analysis
- 11.2.15.4. Recent Developments
- 11.2.15.5. Financials (Based on Availability)
- 11.2.16 National Federation Of Fisheries Co.
- 11.2.16.1. Overview
- 11.2.16.2. Products
- 11.2.16.3. SWOT Analysis
- 11.2.16.4. Recent Developments
- 11.2.16.5. Financials (Based on Availability)
- 11.2.17 Crown Trading Co.
- 11.2.17.1. Overview
- 11.2.17.2. Products
- 11.2.17.3. SWOT Analysis
- 11.2.17.4. Recent Developments
- 11.2.17.5. Financials (Based on Availability)
- 11.2.18 Ltd.
- 11.2.18.1. Overview
- 11.2.18.2. Products
- 11.2.18.3. SWOT Analysis
- 11.2.18.4. Recent Developments
- 11.2.18.5. Financials (Based on Availability)
- 11.2.19 Ait Corp
- 11.2.19.1. Overview
- 11.2.19.2. Products
- 11.2.19.3. SWOT Analysis
- 11.2.19.4. Recent Developments
- 11.2.19.5. Financials (Based on Availability)
- 11.2.20 Global Ocean Works Co.
- 11.2.20.1. Overview
- 11.2.20.2. Products
- 11.2.20.3. SWOT Analysis
- 11.2.20.4. Recent Developments
- 11.2.20.5. Financials (Based on Availability)
- 11.2.21 Ltd.
- 11.2.21.1. Overview
- 11.2.21.2. Products
- 11.2.21.3. SWOT Analysis
- 11.2.21.4. Recent Developments
- 11.2.21.5. Financials (Based on Availability)
- 11.2.22 Nissin Corporation.
- 11.2.22.1. Overview
- 11.2.22.2. Products
- 11.2.22.3. SWOT Analysis
- 11.2.22.4. Recent Developments
- 11.2.22.5. Financials (Based on Availability)
- 11.2.23 Marubeni Foods Corp.
- 11.2.23.1. Overview
- 11.2.23.2. Products
- 11.2.23.3. SWOT Analysis
- 11.2.23.4. Recent Developments
- 11.2.23.5. Financials (Based on Availability)
- 11.2.1 Tongwei Co. Ltd
List of Figures
- Figure 1: Global Frozen Aquatic Product Revenue Breakdown (undefined, %) by Region 2025 & 2033
- Figure 2: North America Frozen Aquatic Product Revenue (undefined), by Application 2025 & 2033
- Figure 3: North America Frozen Aquatic Product Revenue Share (%), by Application 2025 & 2033
- Figure 4: North America Frozen Aquatic Product Revenue (undefined), by Types 2025 & 2033
- Figure 5: North America Frozen Aquatic Product Revenue Share (%), by Types 2025 & 2033
- Figure 6: North America Frozen Aquatic Product Revenue (undefined), by Country 2025 & 2033
- Figure 7: North America Frozen Aquatic Product Revenue Share (%), by Country 2025 & 2033
- Figure 8: South America Frozen Aquatic Product Revenue (undefined), by Application 2025 & 2033
- Figure 9: South America Frozen Aquatic Product Revenue Share (%), by Application 2025 & 2033
- Figure 10: South America Frozen Aquatic Product Revenue (undefined), by Types 2025 & 2033
- Figure 11: South America Frozen Aquatic Product Revenue Share (%), by Types 2025 & 2033
- Figure 12: South America Frozen Aquatic Product Revenue (undefined), by Country 2025 & 2033
- Figure 13: South America Frozen Aquatic Product Revenue Share (%), by Country 2025 & 2033
- Figure 14: Europe Frozen Aquatic Product Revenue (undefined), by Application 2025 & 2033
- Figure 15: Europe Frozen Aquatic Product Revenue Share (%), by Application 2025 & 2033
- Figure 16: Europe Frozen Aquatic Product Revenue (undefined), by Types 2025 & 2033
- Figure 17: Europe Frozen Aquatic Product Revenue Share (%), by Types 2025 & 2033
- Figure 18: Europe Frozen Aquatic Product Revenue (undefined), by Country 2025 & 2033
- Figure 19: Europe Frozen Aquatic Product Revenue Share (%), by Country 2025 & 2033
- Figure 20: Middle East & Africa Frozen Aquatic Product Revenue (undefined), by Application 2025 & 2033
- Figure 21: Middle East & Africa Frozen Aquatic Product Revenue Share (%), by Application 2025 & 2033
- Figure 22: Middle East & Africa Frozen Aquatic Product Revenue (undefined), by Types 2025 & 2033
- Figure 23: Middle East & Africa Frozen Aquatic Product Revenue Share (%), by Types 2025 & 2033
- Figure 24: Middle East & Africa Frozen Aquatic Product Revenue (undefined), by Country 2025 & 2033
- Figure 25: Middle East & Africa Frozen Aquatic Product Revenue Share (%), by Country 2025 & 2033
- Figure 26: Asia Pacific Frozen Aquatic Product Revenue (undefined), by Application 2025 & 2033
- Figure 27: Asia Pacific Frozen Aquatic Product Revenue Share (%), by Application 2025 & 2033
- Figure 28: Asia Pacific Frozen Aquatic Product Revenue (undefined), by Types 2025 & 2033
- Figure 29: Asia Pacific Frozen Aquatic Product Revenue Share (%), by Types 2025 & 2033
- Figure 30: Asia Pacific Frozen Aquatic Product Revenue (undefined), by Country 2025 & 2033
- Figure 31: Asia Pacific Frozen Aquatic Product Revenue Share (%), by Country 2025 & 2033
List of Tables
- Table 1: Global Frozen Aquatic Product Revenue undefined Forecast, by Application 2020 & 2033
- Table 2: Global Frozen Aquatic Product Revenue undefined Forecast, by Types 2020 & 2033
- Table 3: Global Frozen Aquatic Product Revenue undefined Forecast, by Region 2020 & 2033
- Table 4: Global Frozen Aquatic Product Revenue undefined Forecast, by Application 2020 & 2033
- Table 5: Global Frozen Aquatic Product Revenue undefined Forecast, by Types 2020 & 2033
- Table 6: Global Frozen Aquatic Product Revenue undefined Forecast, by Country 2020 & 2033
- Table 7: United States Frozen Aquatic Product Revenue (undefined) Forecast, by Application 2020 & 2033
- Table 8: Canada Frozen Aquatic Product Revenue (undefined) Forecast, by Application 2020 & 2033
- Table 9: Mexico Frozen Aquatic Product Revenue (undefined) Forecast, by Application 2020 & 2033
- Table 10: Global Frozen Aquatic Product Revenue undefined Forecast, by Application 2020 & 2033
- Table 11: Global Frozen Aquatic Product Revenue undefined Forecast, by Types 2020 & 2033
- Table 12: Global Frozen Aquatic Product Revenue undefined Forecast, by Country 2020 & 2033
- Table 13: Brazil Frozen Aquatic Product Revenue (undefined) Forecast, by Application 2020 & 2033
- Table 14: Argentina Frozen Aquatic Product Revenue (undefined) Forecast, by Application 2020 & 2033
- Table 15: Rest of South America Frozen Aquatic Product Revenue (undefined) Forecast, by Application 2020 & 2033
- Table 16: Global Frozen Aquatic Product Revenue undefined Forecast, by Application 2020 & 2033
- Table 17: Global Frozen Aquatic Product Revenue undefined Forecast, by Types 2020 & 2033
- Table 18: Global Frozen Aquatic Product Revenue undefined Forecast, by Country 2020 & 2033
- Table 19: United Kingdom Frozen Aquatic Product Revenue (undefined) Forecast, by Application 2020 & 2033
- Table 20: Germany Frozen Aquatic Product Revenue (undefined) Forecast, by Application 2020 & 2033
- Table 21: France Frozen Aquatic Product Revenue (undefined) Forecast, by Application 2020 & 2033
- Table 22: Italy Frozen Aquatic Product Revenue (undefined) Forecast, by Application 2020 & 2033
- Table 23: Spain Frozen Aquatic Product Revenue (undefined) Forecast, by Application 2020 & 2033
- Table 24: Russia Frozen Aquatic Product Revenue (undefined) Forecast, by Application 2020 & 2033
- Table 25: Benelux Frozen Aquatic Product Revenue (undefined) Forecast, by Application 2020 & 2033
- Table 26: Nordics Frozen Aquatic Product Revenue (undefined) Forecast, by Application 2020 & 2033
- Table 27: Rest of Europe Frozen Aquatic Product Revenue (undefined) Forecast, by Application 2020 & 2033
- Table 28: Global Frozen Aquatic Product Revenue undefined Forecast, by Application 2020 & 2033
- Table 29: Global Frozen Aquatic Product Revenue undefined Forecast, by Types 2020 & 2033
- Table 30: Global Frozen Aquatic Product Revenue undefined Forecast, by Country 2020 & 2033
- Table 31: Turkey Frozen Aquatic Product Revenue (undefined) Forecast, by Application 2020 & 2033
- Table 32: Israel Frozen Aquatic Product Revenue (undefined) Forecast, by Application 2020 & 2033
- Table 33: GCC Frozen Aquatic Product Revenue (undefined) Forecast, by Application 2020 & 2033
- Table 34: North Africa Frozen Aquatic Product Revenue (undefined) Forecast, by Application 2020 & 2033
- Table 35: South Africa Frozen Aquatic Product Revenue (undefined) Forecast, by Application 2020 & 2033
- Table 36: Rest of Middle East & Africa Frozen Aquatic Product Revenue (undefined) Forecast, by Application 2020 & 2033
- Table 37: Global Frozen Aquatic Product Revenue undefined Forecast, by Application 2020 & 2033
- Table 38: Global Frozen Aquatic Product Revenue undefined Forecast, by Types 2020 & 2033
- Table 39: Global Frozen Aquatic Product Revenue undefined Forecast, by Country 2020 & 2033
- Table 40: China Frozen Aquatic Product Revenue (undefined) Forecast, by Application 2020 & 2033
- Table 41: India Frozen Aquatic Product Revenue (undefined) Forecast, by Application 2020 & 2033
- Table 42: Japan Frozen Aquatic Product Revenue (undefined) Forecast, by Application 2020 & 2033
- Table 43: South Korea Frozen Aquatic Product Revenue (undefined) Forecast, by Application 2020 & 2033
- Table 44: ASEAN Frozen Aquatic Product Revenue (undefined) Forecast, by Application 2020 & 2033
- Table 45: Oceania Frozen Aquatic Product Revenue (undefined) Forecast, by Application 2020 & 2033
- Table 46: Rest of Asia Pacific Frozen Aquatic Product Revenue (undefined) Forecast, by Application 2020 & 2033
Frequently Asked Questions
1. What is the projected Compound Annual Growth Rate (CAGR) of the Frozen Aquatic Product?
The projected CAGR is approximately 4.78%.
2. Which companies are prominent players in the Frozen Aquatic Product?
Key companies in the market include Tongwei Co. Ltd, Longsheng Aquatic Products Co., Ltd., Dalian Zhangzidao Fishery Group Company Limited, American Seafoods Company LLC, Bevans Oyster Co., Inc., Boston Sword & Tuna, Channel Seafoods International, Clipper Seafoods, Glacier Fish Company LLC, Kodai Co., Ltd., Japan Trust Co., Ltd., National Federation Of Fisheries Co., Crown Trading Co., Ltd., Ait Corp, Global Ocean Works Co., Ltd., Nissin Corporation., Marubeni Foods Corp..
3. What are the main segments of the Frozen Aquatic Product?
The market segments include Application, Types.
4. Can you provide details about the market size?
The market size is estimated to be USD XXX N/A as of 2022.
5. What are some drivers contributing to market growth?
N/A
6. What are the notable trends driving market growth?
N/A
7. Are there any restraints impacting market growth?
N/A
8. Can you provide examples of recent developments in the market?
N/A
9. What pricing options are available for accessing the report?
Pricing options include single-user, multi-user, and enterprise licenses priced at USD 4900.00, USD 7350.00, and USD 9800.00 respectively.
10. Is the market size provided in terms of value or volume?
The market size is provided in terms of value, measured in N/A.
11. Are there any specific market keywords associated with the report?
Yes, the market keyword associated with the report is "Frozen Aquatic Product," which aids in identifying and referencing the specific market segment covered.
12. How do I determine which pricing option suits my needs best?
The pricing options vary based on user requirements and access needs. Individual users may opt for single-user licenses, while businesses requiring broader access may choose multi-user or enterprise licenses for cost-effective access to the report.
13. Are there any additional resources or data provided in the Frozen Aquatic Product report?
While the report offers comprehensive insights, it's advisable to review the specific contents or supplementary materials provided to ascertain if additional resources or data are available.
14. How can I stay updated on further developments or reports in the Frozen Aquatic Product?
To stay informed about further developments, trends, and reports in the Frozen Aquatic Product, consider subscribing to industry newsletters, following relevant companies and organizations, or regularly checking reputable industry news sources and publications.
Methodology
Step 1 - Identification of Relevant Samples Size from Population Database


Step 2 - Approaches for Defining Global Market Size (Value, Volume* & Price*)

Note*: In applicable scenarios
Step 3 - Data Sources
Primary Research
- Web Analytics
- Survey Reports
- Research Institute
- Latest Research Reports
- Opinion Leaders
Secondary Research
- Annual Reports
- White Paper
- Latest Press Release
- Industry Association
- Paid Database
- Investor Presentations

Step 4 - Data Triangulation
Involves using different sources of information in order to increase the validity of a study
These sources are likely to be stakeholders in a program - participants, other researchers, program staff, other community members, and so on.
Then we put all data in single framework & apply various statistical tools to find out the dynamic on the market.
During the analysis stage, feedback from the stakeholder groups would be compared to determine areas of agreement as well as areas of divergence