

Key Insights
The global food nutrition enhancer market is experiencing robust growth, driven by increasing consumer demand for healthier and more nutritious food products. The market's expansion is fueled by several key factors, including the rising prevalence of chronic diseases like obesity and diabetes, which are prompting consumers to seek functional foods enriched with vitamins, minerals, and other beneficial ingredients. Furthermore, the growing awareness of the importance of a balanced diet and the benefits of fortified foods is driving adoption across diverse demographics. Technological advancements in food processing and formulation are also contributing to market growth, enabling the development of novel and innovative food nutrition enhancers with improved efficacy and stability. Major players in the market, including BASF SE, Ajinomoto Co. Inc., and DuPont de Nemours Inc., are investing significantly in research and development to enhance their product portfolios and cater to the evolving consumer preferences. The market is segmented based on product type, application, and geography, with significant regional variations in growth rates due to factors such as dietary habits, consumer awareness, and regulatory landscapes. While pricing pressures and fluctuating raw material costs represent some challenges, the overall market outlook remains positive, projecting consistent expansion throughout the forecast period.
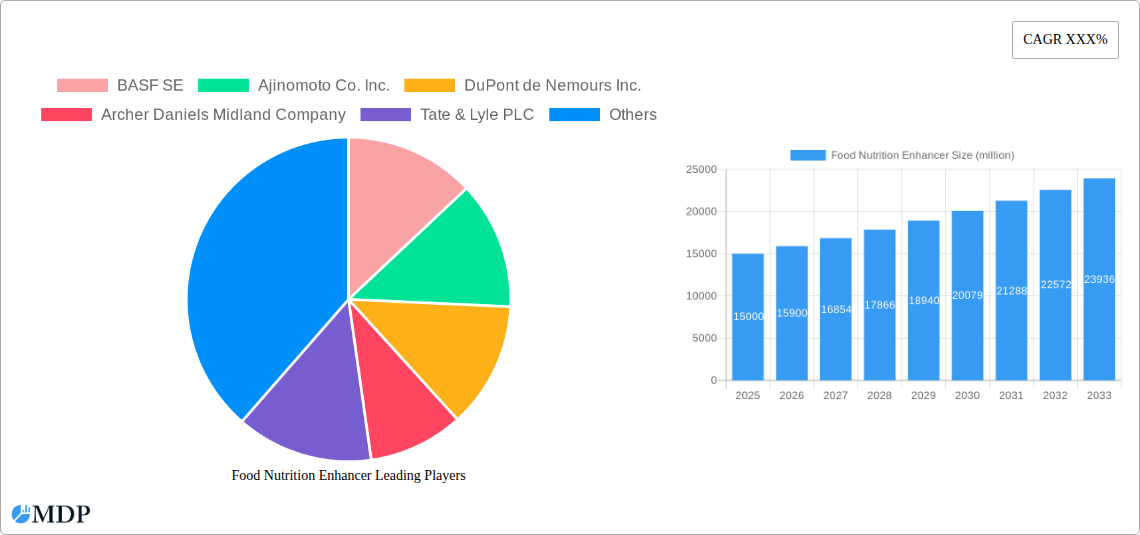
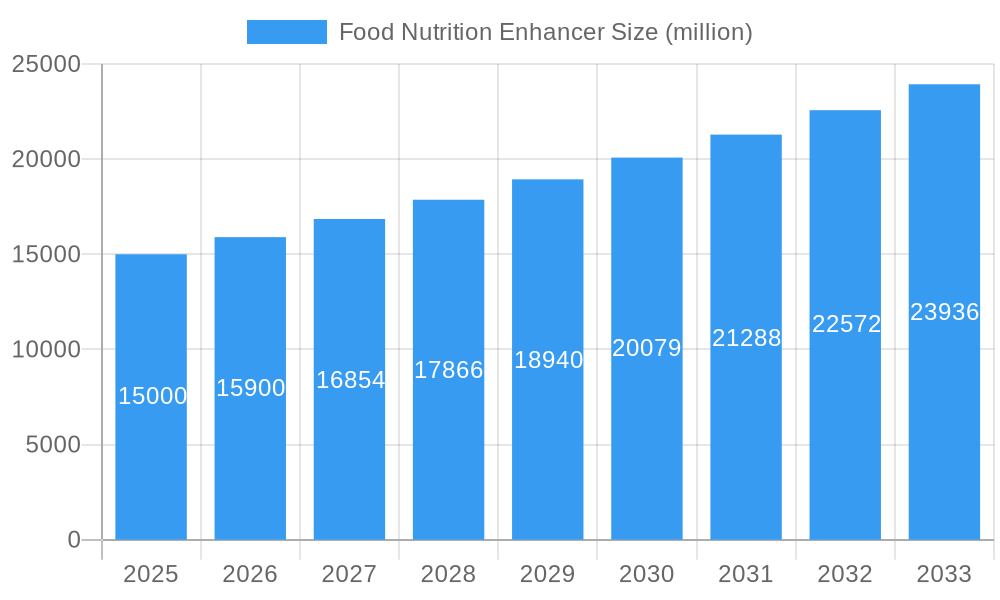
Food Nutrition Enhancer Market Size (In Billion)
The market's growth trajectory is expected to continue, propelled by innovations in natural and clean-label ingredients. Consumers are increasingly seeking products without artificial additives, leading to a surge in demand for naturally derived food nutrition enhancers. This trend is further complemented by the growing adoption of personalized nutrition, where consumers are seeking tailored dietary solutions based on individual health needs. The market is witnessing strategic mergers, acquisitions, and partnerships amongst key players, aiming to expand their product range and penetrate new markets. Regional variations in market growth will largely depend on economic development, regulatory frameworks, and the prevalence of lifestyle-related diseases. Developing economies, particularly in Asia-Pacific, are projected to show considerable growth due to increasing disposable incomes and rising health consciousness. Continuous advancements in food technology and the development of sustainable sourcing practices will play a crucial role in shaping the long-term growth trajectory of the food nutrition enhancer market.
Food Nutrition Enhancer Company Market Share
Food Nutrition Enhancer Market Report: A Comprehensive Analysis (2019-2033)
Unlocking the multi-million dollar potential of the Food Nutrition Enhancer market with this in-depth report. This comprehensive analysis provides a detailed overview of the global Food Nutrition Enhancer market, projecting a market valuation exceeding $XX million by 2033. The report covers the period 2019-2033, with a base year of 2025 and a forecast period of 2025-2033. Key industry players such as BASF SE, Ajinomoto Co. Inc., DuPont de Nemours Inc., Archer Daniels Midland Company, Tate & Lyle PLC, AGRANA Beteiligungs AG, Corbion NV, Kerry Group PLC, Givaudan SA, and DSM NV are meticulously examined. This report is essential for industry stakeholders, investors, and anyone seeking a thorough understanding of this dynamic market.
Food Nutrition Enhancer Market Dynamics & Concentration
The global Food Nutrition Enhancer market exhibits a moderately concentrated structure, with the top 10 players holding an estimated XX% market share in 2025. Market concentration is influenced by factors including:
- Innovation: Continuous innovation in product formulations, delivery systems, and functional properties drives market expansion. Companies are actively investing in R&D to develop novel enhancers with enhanced efficacy and improved consumer appeal.
- Regulatory Frameworks: Stringent regulations concerning food safety and labeling impact market dynamics. Compliance requirements and evolving standards necessitate ongoing adaptation by market players. Differences in regulatory landscapes across regions create opportunities and challenges.
- Product Substitutes: The market faces competition from alternative solutions, including naturally occurring nutrients and traditional flavoring agents. The competitive landscape is shaped by the relative cost-effectiveness and perceived benefits of these substitutes.
- End-User Trends: Shifting consumer preferences towards healthier, more functional foods fuels demand for nutrition enhancers. Growing awareness of the importance of specific nutrients and the desire for convenient food options drive market growth.
- Mergers & Acquisitions (M&A): Consolidation activity is observed, with a recorded XX M&A deals in the historical period (2019-2024). These activities aim to expand product portfolios, enhance market reach, and gain a competitive edge.
Food Nutrition Enhancer Industry Trends & Analysis
The Food Nutrition Enhancer market is experiencing robust growth, with a projected CAGR of XX% during the forecast period (2025-2033). This growth is driven by several key factors:
The increasing demand for fortified foods and beverages, coupled with the rising prevalence of nutritional deficiencies globally, significantly contributes to the market expansion. Technological advancements, such as the development of novel encapsulation and delivery systems, are improving the efficacy and stability of nutrition enhancers. Consumer preferences for clean-label products and natural ingredients are shaping product development strategies. Intense competition among industry leaders leads to continuous innovation and improvements in product quality and affordability. Market penetration continues to rise, particularly in emerging economies with growing disposable incomes and increasing health awareness. The ongoing shift in dietary patterns and growing adoption of functional foods are also important drivers.
Leading Markets & Segments in Food Nutrition Enhancer
The [Dominant Region/Country, e.g., North America] region dominates the global Food Nutrition Enhancer market, accounting for an estimated XX% of the total market share in 2025. Key drivers contributing to this dominance include:
- Robust Economic Growth: Strong economic conditions lead to increased consumer spending on food and beverages.
- Developed Infrastructure: Efficient supply chains and distribution networks ensure timely product delivery.
- High Health Consciousness: A significant portion of the population prioritizes health and wellness, fueling demand for functional foods.
- Favorable Regulatory Environment: Supportive regulatory policies and well-established food safety standards promote market expansion.
[Further analysis on the dominant segment (e.g., specific type of enhancer or application) would be included here, highlighting specific factors contributing to its dominance.]
Food Nutrition Enhancer Product Developments
Recent product innovations focus on improving bioavailability, taste masking, and stability of nutrition enhancers. Technological advancements include nano-encapsulation, micro-encapsulation, and liposomal delivery systems. These innovations enhance the efficacy of enhancers, making them suitable for a wider range of food and beverage applications, providing competitive advantages through superior performance and extended shelf life.
Key Drivers of Food Nutrition Enhancer Growth
The growth of the Food Nutrition Enhancer market is propelled by several key factors:
- Technological advancements in delivery systems and formulation improve efficacy and expand application possibilities.
- Growing consumer demand for fortified and functional foods drives market expansion across diverse demographics.
- Favorable government regulations supporting food fortification initiatives create incentives for market growth.
Challenges in the Food Nutrition Enhancer Market
The market faces challenges including:
- Stringent regulations requiring extensive testing and compliance, increasing development costs.
- Supply chain disruptions due to global events impacting ingredient availability and pricing.
- Intense competition among established and emerging players puts pressure on pricing and margins.
Emerging Opportunities in Food Nutrition Enhancer
Emerging opportunities are driven by:
- Technological breakthroughs in targeted nutrient delivery and personalized nutrition.
- Strategic partnerships between food manufacturers and ingredient suppliers fostering innovation.
- Market expansion into new geographical regions with growing health awareness and disposable incomes.
Leading Players in the Food Nutrition Enhancer Sector
Key Milestones in Food Nutrition Enhancer Industry
- [Month/Year]: Launch of a novel [Type of Enhancer] by [Company Name], significantly expanding market options.
- [Month/Year]: Acquisition of [Company A] by [Company B], leading to increased market share and product diversification.
- [Month/Year]: Introduction of new regulatory guidelines impacting product labeling and formulation requirements.
Strategic Outlook for Food Nutrition Enhancer Market
The Food Nutrition Enhancer market holds significant long-term growth potential, driven by sustained demand for fortified foods, technological innovation, and expansion into new markets. Strategic partnerships, focused R&D investments, and proactive adaptation to evolving consumer preferences are crucial for success in this competitive yet lucrative sector. The market's future will be defined by companies successfully developing and commercializing innovative, cost-effective, and sustainable solutions to meet the growing demand for enhanced nutrition.
Food Nutrition Enhancer Segmentation
-
1. Application
- 1.1. Flour
- 1.2. Rice
- 1.3. Milk
- 1.4. Others
-
2. Type
- 2.1. Mineral Food Nutrition Enhancer
- 2.2. Vitamin Food Nutrition Enhancer
- 2.3. Amino Acid Food Nutrition Enhancer
- 2.4. Other Nutrients
Food Nutrition Enhancer Segmentation By Geography
-
1. North America
- 1.1. United States
- 1.2. Canada
- 1.3. Mexico
-
2. South America
- 2.1. Brazil
- 2.2. Argentina
- 2.3. Rest of South America
-
3. Europe
- 3.1. United Kingdom
- 3.2. Germany
- 3.3. France
- 3.4. Italy
- 3.5. Spain
- 3.6. Russia
- 3.7. Benelux
- 3.8. Nordics
- 3.9. Rest of Europe
-
4. Middle East & Africa
- 4.1. Turkey
- 4.2. Israel
- 4.3. GCC
- 4.4. North Africa
- 4.5. South Africa
- 4.6. Rest of Middle East & Africa
-
5. Asia Pacific
- 5.1. China
- 5.2. India
- 5.3. Japan
- 5.4. South Korea
- 5.5. ASEAN
- 5.6. Oceania
- 5.7. Rest of Asia Pacific
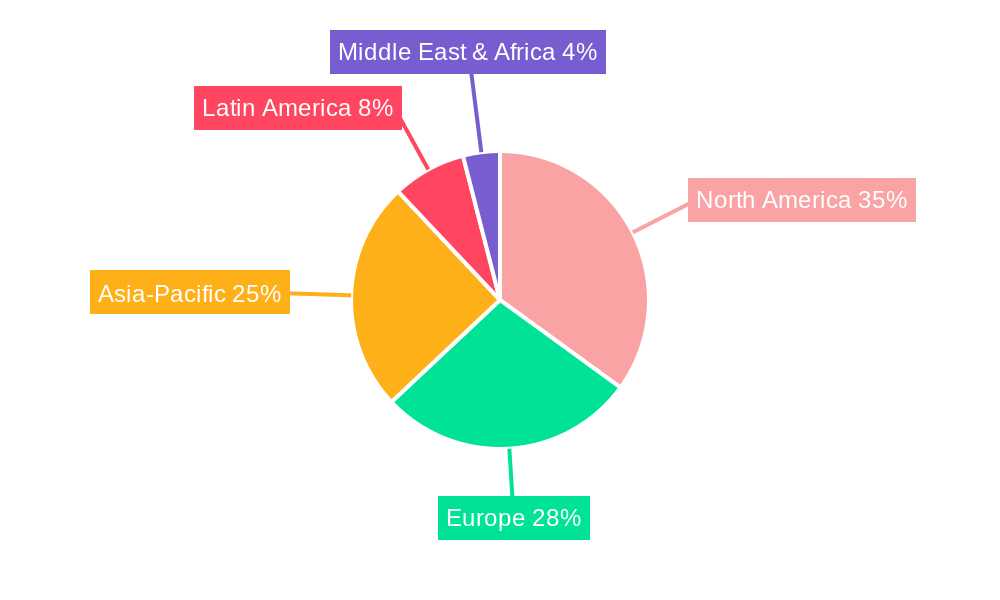
Food Nutrition Enhancer Regional Market Share
Geographic Coverage of Food Nutrition Enhancer
Food Nutrition Enhancer REPORT HIGHLIGHTS
| Aspects | Details |
|---|---|
| Study Period | 2020-2034 |
| Base Year | 2025 |
| Estimated Year | 2026 |
| Forecast Period | 2026-2034 |
| Historical Period | 2020-2025 |
| Growth Rate | CAGR of 5.4% from 2020-2034 |
| Segmentation |
|
Table of Contents
- 1. Introduction
- 1.1. Research Scope
- 1.2. Market Segmentation
- 1.3. Research Methodology
- 1.4. Definitions and Assumptions
- 2. Executive Summary
- 2.1. Introduction
- 3. Market Dynamics
- 3.1. Introduction
- 3.2. Market Drivers
- 3.3. Market Restrains
- 3.4. Market Trends
- 4. Market Factor Analysis
- 4.1. Porters Five Forces
- 4.2. Supply/Value Chain
- 4.3. PESTEL analysis
- 4.4. Market Entropy
- 4.5. Patent/Trademark Analysis
- 5. Global Food Nutrition Enhancer Analysis, Insights and Forecast, 2020-2032
- 5.1. Market Analysis, Insights and Forecast - by Application
- 5.1.1. Flour
- 5.1.2. Rice
- 5.1.3. Milk
- 5.1.4. Others
- 5.2. Market Analysis, Insights and Forecast - by Type
- 5.2.1. Mineral Food Nutrition Enhancer
- 5.2.2. Vitamin Food Nutrition Enhancer
- 5.2.3. Amino Acid Food Nutrition Enhancer
- 5.2.4. Other Nutrients
- 5.3. Market Analysis, Insights and Forecast - by Region
- 5.3.1. North America
- 5.3.2. South America
- 5.3.3. Europe
- 5.3.4. Middle East & Africa
- 5.3.5. Asia Pacific
- 5.1. Market Analysis, Insights and Forecast - by Application
- 6. North America Food Nutrition Enhancer Analysis, Insights and Forecast, 2020-2032
- 6.1. Market Analysis, Insights and Forecast - by Application
- 6.1.1. Flour
- 6.1.2. Rice
- 6.1.3. Milk
- 6.1.4. Others
- 6.2. Market Analysis, Insights and Forecast - by Type
- 6.2.1. Mineral Food Nutrition Enhancer
- 6.2.2. Vitamin Food Nutrition Enhancer
- 6.2.3. Amino Acid Food Nutrition Enhancer
- 6.2.4. Other Nutrients
- 6.1. Market Analysis, Insights and Forecast - by Application
- 7. South America Food Nutrition Enhancer Analysis, Insights and Forecast, 2020-2032
- 7.1. Market Analysis, Insights and Forecast - by Application
- 7.1.1. Flour
- 7.1.2. Rice
- 7.1.3. Milk
- 7.1.4. Others
- 7.2. Market Analysis, Insights and Forecast - by Type
- 7.2.1. Mineral Food Nutrition Enhancer
- 7.2.2. Vitamin Food Nutrition Enhancer
- 7.2.3. Amino Acid Food Nutrition Enhancer
- 7.2.4. Other Nutrients
- 7.1. Market Analysis, Insights and Forecast - by Application
- 8. Europe Food Nutrition Enhancer Analysis, Insights and Forecast, 2020-2032
- 8.1. Market Analysis, Insights and Forecast - by Application
- 8.1.1. Flour
- 8.1.2. Rice
- 8.1.3. Milk
- 8.1.4. Others
- 8.2. Market Analysis, Insights and Forecast - by Type
- 8.2.1. Mineral Food Nutrition Enhancer
- 8.2.2. Vitamin Food Nutrition Enhancer
- 8.2.3. Amino Acid Food Nutrition Enhancer
- 8.2.4. Other Nutrients
- 8.1. Market Analysis, Insights and Forecast - by Application
- 9. Middle East & Africa Food Nutrition Enhancer Analysis, Insights and Forecast, 2020-2032
- 9.1. Market Analysis, Insights and Forecast - by Application
- 9.1.1. Flour
- 9.1.2. Rice
- 9.1.3. Milk
- 9.1.4. Others
- 9.2. Market Analysis, Insights and Forecast - by Type
- 9.2.1. Mineral Food Nutrition Enhancer
- 9.2.2. Vitamin Food Nutrition Enhancer
- 9.2.3. Amino Acid Food Nutrition Enhancer
- 9.2.4. Other Nutrients
- 9.1. Market Analysis, Insights and Forecast - by Application
- 10. Asia Pacific Food Nutrition Enhancer Analysis, Insights and Forecast, 2020-2032
- 10.1. Market Analysis, Insights and Forecast - by Application
- 10.1.1. Flour
- 10.1.2. Rice
- 10.1.3. Milk
- 10.1.4. Others
- 10.2. Market Analysis, Insights and Forecast - by Type
- 10.2.1. Mineral Food Nutrition Enhancer
- 10.2.2. Vitamin Food Nutrition Enhancer
- 10.2.3. Amino Acid Food Nutrition Enhancer
- 10.2.4. Other Nutrients
- 10.1. Market Analysis, Insights and Forecast - by Application
- 11. Competitive Analysis
- 11.1. Global Market Share Analysis 2025
- 11.2. Company Profiles
- 11.2.1 BASF SE
- 11.2.1.1. Overview
- 11.2.1.2. Products
- 11.2.1.3. SWOT Analysis
- 11.2.1.4. Recent Developments
- 11.2.1.5. Financials (Based on Availability)
- 11.2.2 Ajinomoto Co. Inc.
- 11.2.2.1. Overview
- 11.2.2.2. Products
- 11.2.2.3. SWOT Analysis
- 11.2.2.4. Recent Developments
- 11.2.2.5. Financials (Based on Availability)
- 11.2.3 DuPont de Nemours Inc.
- 11.2.3.1. Overview
- 11.2.3.2. Products
- 11.2.3.3. SWOT Analysis
- 11.2.3.4. Recent Developments
- 11.2.3.5. Financials (Based on Availability)
- 11.2.4 Archer Daniels Midland Company
- 11.2.4.1. Overview
- 11.2.4.2. Products
- 11.2.4.3. SWOT Analysis
- 11.2.4.4. Recent Developments
- 11.2.4.5. Financials (Based on Availability)
- 11.2.5 Tate & Lyle PLC
- 11.2.5.1. Overview
- 11.2.5.2. Products
- 11.2.5.3. SWOT Analysis
- 11.2.5.4. Recent Developments
- 11.2.5.5. Financials (Based on Availability)
- 11.2.6 AGRANA Beteiligungs AG
- 11.2.6.1. Overview
- 11.2.6.2. Products
- 11.2.6.3. SWOT Analysis
- 11.2.6.4. Recent Developments
- 11.2.6.5. Financials (Based on Availability)
- 11.2.7 Corbion NV
- 11.2.7.1. Overview
- 11.2.7.2. Products
- 11.2.7.3. SWOT Analysis
- 11.2.7.4. Recent Developments
- 11.2.7.5. Financials (Based on Availability)
- 11.2.8 Kerry Group PLC
- 11.2.8.1. Overview
- 11.2.8.2. Products
- 11.2.8.3. SWOT Analysis
- 11.2.8.4. Recent Developments
- 11.2.8.5. Financials (Based on Availability)
- 11.2.9 Givaudan SA
- 11.2.9.1. Overview
- 11.2.9.2. Products
- 11.2.9.3. SWOT Analysis
- 11.2.9.4. Recent Developments
- 11.2.9.5. Financials (Based on Availability)
- 11.2.10 DSM NV
- 11.2.10.1. Overview
- 11.2.10.2. Products
- 11.2.10.3. SWOT Analysis
- 11.2.10.4. Recent Developments
- 11.2.10.5. Financials (Based on Availability)
- 11.2.1 BASF SE
List of Figures
- Figure 1: Global Food Nutrition Enhancer Revenue Breakdown (undefined, %) by Region 2025 & 2033
- Figure 2: North America Food Nutrition Enhancer Revenue (undefined), by Application 2025 & 2033
- Figure 3: North America Food Nutrition Enhancer Revenue Share (%), by Application 2025 & 2033
- Figure 4: North America Food Nutrition Enhancer Revenue (undefined), by Type 2025 & 2033
- Figure 5: North America Food Nutrition Enhancer Revenue Share (%), by Type 2025 & 2033
- Figure 6: North America Food Nutrition Enhancer Revenue (undefined), by Country 2025 & 2033
- Figure 7: North America Food Nutrition Enhancer Revenue Share (%), by Country 2025 & 2033
- Figure 8: South America Food Nutrition Enhancer Revenue (undefined), by Application 2025 & 2033
- Figure 9: South America Food Nutrition Enhancer Revenue Share (%), by Application 2025 & 2033
- Figure 10: South America Food Nutrition Enhancer Revenue (undefined), by Type 2025 & 2033
- Figure 11: South America Food Nutrition Enhancer Revenue Share (%), by Type 2025 & 2033
- Figure 12: South America Food Nutrition Enhancer Revenue (undefined), by Country 2025 & 2033
- Figure 13: South America Food Nutrition Enhancer Revenue Share (%), by Country 2025 & 2033
- Figure 14: Europe Food Nutrition Enhancer Revenue (undefined), by Application 2025 & 2033
- Figure 15: Europe Food Nutrition Enhancer Revenue Share (%), by Application 2025 & 2033
- Figure 16: Europe Food Nutrition Enhancer Revenue (undefined), by Type 2025 & 2033
- Figure 17: Europe Food Nutrition Enhancer Revenue Share (%), by Type 2025 & 2033
- Figure 18: Europe Food Nutrition Enhancer Revenue (undefined), by Country 2025 & 2033
- Figure 19: Europe Food Nutrition Enhancer Revenue Share (%), by Country 2025 & 2033
- Figure 20: Middle East & Africa Food Nutrition Enhancer Revenue (undefined), by Application 2025 & 2033
- Figure 21: Middle East & Africa Food Nutrition Enhancer Revenue Share (%), by Application 2025 & 2033
- Figure 22: Middle East & Africa Food Nutrition Enhancer Revenue (undefined), by Type 2025 & 2033
- Figure 23: Middle East & Africa Food Nutrition Enhancer Revenue Share (%), by Type 2025 & 2033
- Figure 24: Middle East & Africa Food Nutrition Enhancer Revenue (undefined), by Country 2025 & 2033
- Figure 25: Middle East & Africa Food Nutrition Enhancer Revenue Share (%), by Country 2025 & 2033
- Figure 26: Asia Pacific Food Nutrition Enhancer Revenue (undefined), by Application 2025 & 2033
- Figure 27: Asia Pacific Food Nutrition Enhancer Revenue Share (%), by Application 2025 & 2033
- Figure 28: Asia Pacific Food Nutrition Enhancer Revenue (undefined), by Type 2025 & 2033
- Figure 29: Asia Pacific Food Nutrition Enhancer Revenue Share (%), by Type 2025 & 2033
- Figure 30: Asia Pacific Food Nutrition Enhancer Revenue (undefined), by Country 2025 & 2033
- Figure 31: Asia Pacific Food Nutrition Enhancer Revenue Share (%), by Country 2025 & 2033
List of Tables
- Table 1: Global Food Nutrition Enhancer Revenue undefined Forecast, by Application 2020 & 2033
- Table 2: Global Food Nutrition Enhancer Revenue undefined Forecast, by Type 2020 & 2033
- Table 3: Global Food Nutrition Enhancer Revenue undefined Forecast, by Region 2020 & 2033
- Table 4: Global Food Nutrition Enhancer Revenue undefined Forecast, by Application 2020 & 2033
- Table 5: Global Food Nutrition Enhancer Revenue undefined Forecast, by Type 2020 & 2033
- Table 6: Global Food Nutrition Enhancer Revenue undefined Forecast, by Country 2020 & 2033
- Table 7: United States Food Nutrition Enhancer Revenue (undefined) Forecast, by Application 2020 & 2033
- Table 8: Canada Food Nutrition Enhancer Revenue (undefined) Forecast, by Application 2020 & 2033
- Table 9: Mexico Food Nutrition Enhancer Revenue (undefined) Forecast, by Application 2020 & 2033
- Table 10: Global Food Nutrition Enhancer Revenue undefined Forecast, by Application 2020 & 2033
- Table 11: Global Food Nutrition Enhancer Revenue undefined Forecast, by Type 2020 & 2033
- Table 12: Global Food Nutrition Enhancer Revenue undefined Forecast, by Country 2020 & 2033
- Table 13: Brazil Food Nutrition Enhancer Revenue (undefined) Forecast, by Application 2020 & 2033
- Table 14: Argentina Food Nutrition Enhancer Revenue (undefined) Forecast, by Application 2020 & 2033
- Table 15: Rest of South America Food Nutrition Enhancer Revenue (undefined) Forecast, by Application 2020 & 2033
- Table 16: Global Food Nutrition Enhancer Revenue undefined Forecast, by Application 2020 & 2033
- Table 17: Global Food Nutrition Enhancer Revenue undefined Forecast, by Type 2020 & 2033
- Table 18: Global Food Nutrition Enhancer Revenue undefined Forecast, by Country 2020 & 2033
- Table 19: United Kingdom Food Nutrition Enhancer Revenue (undefined) Forecast, by Application 2020 & 2033
- Table 20: Germany Food Nutrition Enhancer Revenue (undefined) Forecast, by Application 2020 & 2033
- Table 21: France Food Nutrition Enhancer Revenue (undefined) Forecast, by Application 2020 & 2033
- Table 22: Italy Food Nutrition Enhancer Revenue (undefined) Forecast, by Application 2020 & 2033
- Table 23: Spain Food Nutrition Enhancer Revenue (undefined) Forecast, by Application 2020 & 2033
- Table 24: Russia Food Nutrition Enhancer Revenue (undefined) Forecast, by Application 2020 & 2033
- Table 25: Benelux Food Nutrition Enhancer Revenue (undefined) Forecast, by Application 2020 & 2033
- Table 26: Nordics Food Nutrition Enhancer Revenue (undefined) Forecast, by Application 2020 & 2033
- Table 27: Rest of Europe Food Nutrition Enhancer Revenue (undefined) Forecast, by Application 2020 & 2033
- Table 28: Global Food Nutrition Enhancer Revenue undefined Forecast, by Application 2020 & 2033
- Table 29: Global Food Nutrition Enhancer Revenue undefined Forecast, by Type 2020 & 2033
- Table 30: Global Food Nutrition Enhancer Revenue undefined Forecast, by Country 2020 & 2033
- Table 31: Turkey Food Nutrition Enhancer Revenue (undefined) Forecast, by Application 2020 & 2033
- Table 32: Israel Food Nutrition Enhancer Revenue (undefined) Forecast, by Application 2020 & 2033
- Table 33: GCC Food Nutrition Enhancer Revenue (undefined) Forecast, by Application 2020 & 2033
- Table 34: North Africa Food Nutrition Enhancer Revenue (undefined) Forecast, by Application 2020 & 2033
- Table 35: South Africa Food Nutrition Enhancer Revenue (undefined) Forecast, by Application 2020 & 2033
- Table 36: Rest of Middle East & Africa Food Nutrition Enhancer Revenue (undefined) Forecast, by Application 2020 & 2033
- Table 37: Global Food Nutrition Enhancer Revenue undefined Forecast, by Application 2020 & 2033
- Table 38: Global Food Nutrition Enhancer Revenue undefined Forecast, by Type 2020 & 2033
- Table 39: Global Food Nutrition Enhancer Revenue undefined Forecast, by Country 2020 & 2033
- Table 40: China Food Nutrition Enhancer Revenue (undefined) Forecast, by Application 2020 & 2033
- Table 41: India Food Nutrition Enhancer Revenue (undefined) Forecast, by Application 2020 & 2033
- Table 42: Japan Food Nutrition Enhancer Revenue (undefined) Forecast, by Application 2020 & 2033
- Table 43: South Korea Food Nutrition Enhancer Revenue (undefined) Forecast, by Application 2020 & 2033
- Table 44: ASEAN Food Nutrition Enhancer Revenue (undefined) Forecast, by Application 2020 & 2033
- Table 45: Oceania Food Nutrition Enhancer Revenue (undefined) Forecast, by Application 2020 & 2033
- Table 46: Rest of Asia Pacific Food Nutrition Enhancer Revenue (undefined) Forecast, by Application 2020 & 2033
Frequently Asked Questions
1. What is the projected Compound Annual Growth Rate (CAGR) of the Food Nutrition Enhancer?
The projected CAGR is approximately 5.4%.
2. Which companies are prominent players in the Food Nutrition Enhancer?
Key companies in the market include BASF SE, Ajinomoto Co. Inc., DuPont de Nemours Inc., Archer Daniels Midland Company, Tate & Lyle PLC, AGRANA Beteiligungs AG, Corbion NV, Kerry Group PLC, Givaudan SA, DSM NV.
3. What are the main segments of the Food Nutrition Enhancer?
The market segments include Application, Type.
4. Can you provide details about the market size?
The market size is estimated to be USD XXX N/A as of 2022.
5. What are some drivers contributing to market growth?
N/A
6. What are the notable trends driving market growth?
N/A
7. Are there any restraints impacting market growth?
N/A
8. Can you provide examples of recent developments in the market?
N/A
9. What pricing options are available for accessing the report?
Pricing options include single-user, multi-user, and enterprise licenses priced at USD 2900.00, USD 4350.00, and USD 5800.00 respectively.
10. Is the market size provided in terms of value or volume?
The market size is provided in terms of value, measured in N/A.
11. Are there any specific market keywords associated with the report?
Yes, the market keyword associated with the report is "Food Nutrition Enhancer," which aids in identifying and referencing the specific market segment covered.
12. How do I determine which pricing option suits my needs best?
The pricing options vary based on user requirements and access needs. Individual users may opt for single-user licenses, while businesses requiring broader access may choose multi-user or enterprise licenses for cost-effective access to the report.
13. Are there any additional resources or data provided in the Food Nutrition Enhancer report?
While the report offers comprehensive insights, it's advisable to review the specific contents or supplementary materials provided to ascertain if additional resources or data are available.
14. How can I stay updated on further developments or reports in the Food Nutrition Enhancer?
To stay informed about further developments, trends, and reports in the Food Nutrition Enhancer, consider subscribing to industry newsletters, following relevant companies and organizations, or regularly checking reputable industry news sources and publications.
Methodology
Step 1 - Identification of Relevant Samples Size from Population Database


Step 2 - Approaches for Defining Global Market Size (Value, Volume* & Price*)

Note*: In applicable scenarios
Step 3 - Data Sources
Primary Research
- Web Analytics
- Survey Reports
- Research Institute
- Latest Research Reports
- Opinion Leaders
Secondary Research
- Annual Reports
- White Paper
- Latest Press Release
- Industry Association
- Paid Database
- Investor Presentations

Step 4 - Data Triangulation
Involves using different sources of information in order to increase the validity of a study
These sources are likely to be stakeholders in a program - participants, other researchers, program staff, other community members, and so on.
Then we put all data in single framework & apply various statistical tools to find out the dynamic on the market.
During the analysis stage, feedback from the stakeholder groups would be compared to determine areas of agreement as well as areas of divergence