

Key Insights
The global food flavors market is projected to reach $11.6 billion by 2025, exhibiting a compound annual growth rate (CAGR) of 4.7%. This expansion is fueled by escalating consumer demand for novel and varied taste profiles across diverse food and beverage applications. Key growth drivers include a rising global population, an expanding middle class with enhanced disposable income, and a strong preference for processed and convenience foods that necessitate sophisticated flavorings. Additionally, the increasing demand for natural and clean-label ingredients presents significant opportunities for suppliers of natural flavor extracts and compounds. The market is also shaped by the ongoing pursuit of unique sensory experiences, prompting food manufacturers to invest in the development of distinctive and exotic flavor creations.
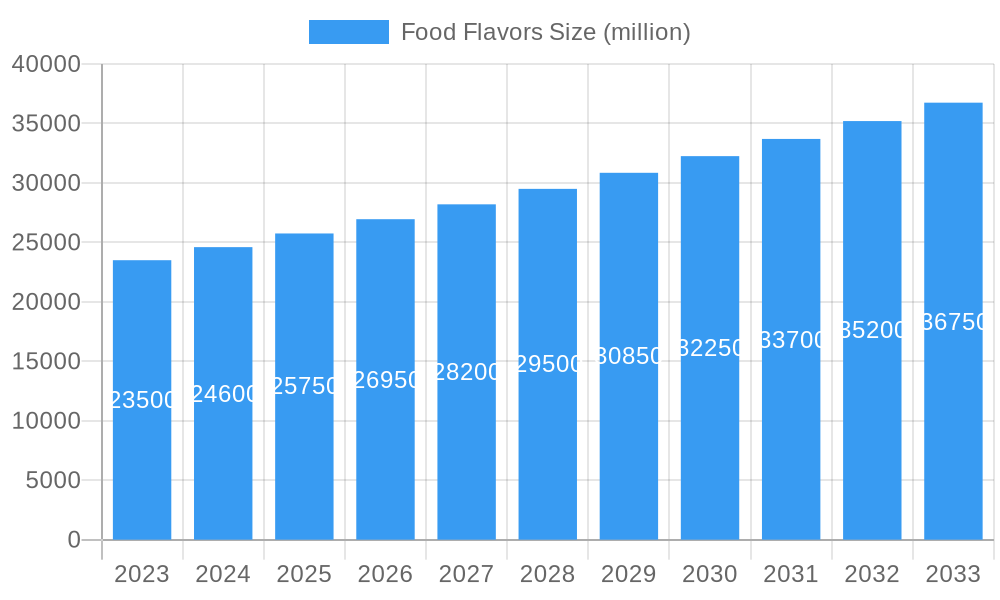
Food Flavors Market Size (In Billion)
The food flavors market is segmented by application, with Beverages, Dairy & Frozen Products, and Savory & Snacks representing the leading segments owing to their extensive consumption and the vital role of flavors in their appeal. The "Type" segmentation indicates a rising preference for natural flavors over artificial alternatives, aligning with consumer health consciousness and a desire for perceived authenticity. Geographically, Asia Pacific is anticipated to be a primary growth driver, propelled by rapid urbanization, increased adoption of processed foods, and a growing middle-class population with evolving taste preferences. North America and Europe remain substantial, albeit mature, markets driven by innovation and premiumization. Key challenges include fluctuating raw material costs and stringent regional regulatory environments, alongside intricate supply chain dynamics. The competitive landscape features both major multinational corporations and specialized regional entities competing through product innovation, strategic alliances, and mergers and acquisitions.
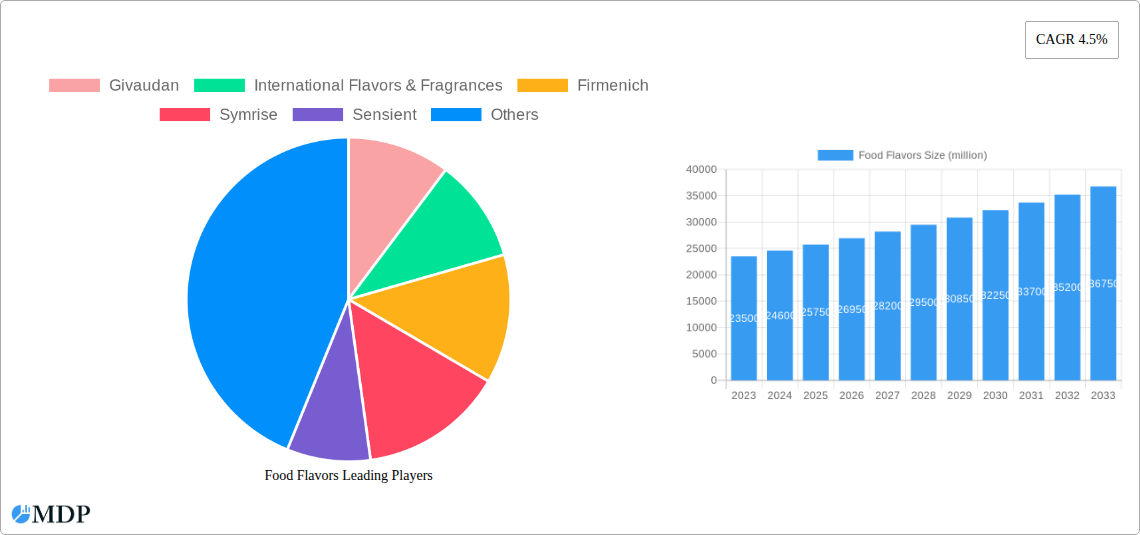
Food Flavors Company Market Share
Unlock the Flavor Revolution: A Comprehensive Report on the Global Food Flavors Market
Discover the future of taste and aroma with our in-depth report on the Food Flavors market. Analyzing trends from 2019–2033, with a base year of 2025, this study provides critical insights for industry stakeholders seeking to navigate the dynamic landscape of food ingredient innovation. Explore market drivers, leading segments, key players, and emerging opportunities shaping the multi-million dollar global food flavors industry.
Food Flavors Market Dynamics & Concentration
The global food flavors market is characterized by a moderate to high concentration, with a significant portion of revenue driven by a select group of multinational corporations. Key innovation drivers fueling this market include the relentless consumer demand for novel taste experiences, the growing preference for natural and clean-label ingredients, and advancements in flavor encapsulation and delivery technologies. Regulatory frameworks, particularly around food safety and labeling standards, play a crucial role in shaping product development and market entry. Product substitutes, such as artificial sweeteners and flavor enhancers, present a competitive challenge, but the rising demand for authentic and natural profiles is mitigating their impact. End-user trends are heavily influenced by health and wellness consciousness, leading to a surge in demand for reduced-sugar, reduced-sodium, and functional flavors. Mergers and acquisitions (M&A) activity remains a significant strategy for market expansion and diversification. Over the historical period (2019-2024), we observed an average of XX M&A deals annually, with an estimated total deal value of over one million dollars. Leading companies like Givaudan, International Flavors & Fragrances, and Firmenich consistently invest in R&D and strategic acquisitions to maintain their market dominance. The market share of the top five players is estimated to be over 60% in 2025, showcasing the concentrated nature of the industry.
Food Flavors Industry Trends & Analysis
The global food flavors market is poised for substantial growth, projected to witness a Compound Annual Growth Rate (CAGR) of approximately XX% from 2025 to 2033. This robust expansion is underpinned by a confluence of powerful market growth drivers. The increasing global population and rising disposable incomes, particularly in emerging economies, are directly translating into higher per capita consumption of processed foods and beverages, consequently boosting the demand for sophisticated flavor solutions. Technological disruptions are revolutionizing flavor creation and application. Advances in biotechnology, fermentation, and flavor synthesis are enabling the development of highly authentic and sustainable natural flavors, catering to the growing consumer preference for clean labels. Furthermore, innovative flavor encapsulation technologies are enhancing shelf-life, improving taste release profiles, and facilitating the creation of novel sensory experiences. Consumer preferences are evolving rapidly, with a marked shift towards healthier, plant-based, and ethically sourced food products. This trend is driving demand for natural, organic, and allergen-free flavorings. The "free-from" movement is gaining traction, pushing manufacturers to reformulate products and explore new flavor profiles that align with these dietary trends. Competitive dynamics within the industry are intensifying, with established giants competing alongside nimble startups specializing in niche flavor segments. Strategic partnerships and collaborations are becoming increasingly prevalent as companies seek to leverage each other's expertise and expand their market reach. The market penetration of advanced flavor technologies is expected to accelerate, offering manufacturers new avenues for product differentiation and premiumization. The market size is estimated to reach over one million dollars by 2025, with projected revenues exceeding one million dollars by the end of the forecast period.
Leading Markets & Segments in Food Flavors
The global food flavors market is segmented by application and type, with distinct leaders emerging in each category.
Dominant Application Segment: Beverages
The Beverages segment is projected to maintain its position as the largest application area for food flavors throughout the study period (2019-2033).
- Key Drivers for Beverage Dominance:
- High Consumption Volume: Beverages, including soft drinks, juices, dairy drinks, and alcoholic beverages, represent a significant portion of daily consumer intake globally, necessitating a continuous supply of diverse flavorings.
- Innovation in Functional Beverages: The burgeoning market for functional beverages, offering health benefits beyond basic hydration (e.g., probiotics, vitamins, energy boosters), requires specialized and appealing flavor profiles to mask unpalatable ingredients and enhance consumer acceptance.
- Premiumization and Indulgence: The demand for premium and indulgent beverage experiences, such as gourmet coffees, craft beers, and exotic cocktails, fuels the need for complex and sophisticated flavor creations.
- Reformulation for Health Trends: As consumers seek healthier options, beverage manufacturers are actively reformulating products to reduce sugar and artificial ingredients, driving demand for natural and low-calorie flavor solutions.
- Emerging Markets Growth: Rapid urbanization and increasing disposable incomes in developing economies are leading to a surge in demand for processed beverages.
The Dairy & Frozen Products segment also exhibits strong growth, driven by the popularity of ice cream, yogurt, and frozen desserts, all of which heavily rely on appealing flavor profiles. The Savory & Snacks segment is experiencing significant innovation, with demand for bold and exotic flavors in chips, crackers, and ready-to-eat meals. The Animal & Pet Food segment, while smaller, is growing steadily as pet owners increasingly seek high-quality, palatable food options for their companions.
Dominant Type Segment: Natural Flavors
The Natural Flavors segment is witnessing an unprecedented surge in demand, consistently outperforming artificial counterparts.
- Key Drivers for Natural Flavor Dominance:
- Consumer Demand for Clean Labels: Consumers are increasingly scrutinizing ingredient lists, actively seeking products made with natural ingredients and avoiding artificial additives. This trend is a primary catalyst for the growth of natural flavors.
- Health and Wellness Trends: The perception that natural ingredients are healthier and safer than artificial alternatives is a significant driver. This extends to flavors derived from fruits, vegetables, herbs, and spices.
- Technological Advancements in Extraction: Innovations in extraction and processing technologies are making it more feasible and cost-effective to produce high-quality natural flavors from a wider range of sources.
- Regulatory Support for Natural Claims: Many regulatory bodies are increasingly supportive of "natural" claims, provided they meet specific criteria, further encouraging manufacturers to adopt natural flavorings.
- Sustainability Concerns: A growing awareness of environmental impact is also influencing consumer choices, with a preference for naturally sourced ingredients that align with sustainable practices.
While Artificial Flavors still hold a significant market share due to their cost-effectiveness and consistency, their growth trajectory is being outpaced by the natural segment. The focus on natural is a fundamental shift reshaping the entire food flavors industry.
Food Flavors Product Developments
Product innovation in the food flavors sector is characterized by a strong emphasis on natural origin, health benefits, and sensory appeal. Companies are developing novel flavor profiles that mimic traditional taste experiences while meeting contemporary consumer demands for clean labels and reduced sugar/sodium content. Key advancements include the creation of plant-based flavor extracts, fermented flavorings, and a wider array of exotic fruit and botanical essences. Encapsulation technologies are also improving, enabling better flavor stability, controlled release, and enhanced mouthfeel. These innovations allow food manufacturers to create differentiated products that resonate with evolving consumer preferences, offering a competitive edge in a crowded marketplace. The estimated market value for innovative flavor solutions is projected to exceed one million dollars in the coming years.
Key Drivers of Food Flavors Growth
The global food flavors market's growth is propelled by several interconnected factors. Technological advancements in areas like biotechnology and fermentation are enabling the creation of more authentic and sustainable natural flavors, catering to the rising demand for clean-label products. The increasing global middle class, particularly in emerging economies, is driving higher consumption of processed foods and beverages, thereby increasing the demand for flavorings. Furthermore, evolving consumer preferences towards healthier, plant-based, and ethically sourced food options are pushing manufacturers to invest in natural and specialty flavors. Regulatory support for natural claims and the growing awareness of the role of flavors in enhancing the sensory appeal of food products are also significant growth accelerators.
Challenges in the Food Flavors Market
Despite robust growth prospects, the food flavors market faces several challenges. Stringent and evolving regulatory frameworks across different regions can create hurdles for market entry and product compliance, particularly for novel ingredients. Supply chain disruptions, influenced by factors like climate change and geopolitical instability, can impact the availability and cost of raw materials, affecting flavor production. Intense competition from both established players and emerging startups necessitates continuous innovation and competitive pricing strategies. Moreover, consumer perception regarding artificial versus natural flavors, coupled with the high cost of sourcing and producing certain natural ingredients, presents a persistent challenge. The market is estimated to face potential value losses of up to XX million dollars due to these restraints.
Emerging Opportunities in Food Flavors
The food flavors market is ripe with emerging opportunities driven by unmet consumer needs and technological breakthroughs. The demand for personalized nutrition and functional foods presents a significant avenue for developing flavors that complement health-promoting ingredients and mask less palatable active compounds. The growing trend towards plant-based diets is creating a demand for authentic, meat-like flavors derived from sustainable sources. Furthermore, the expansion of e-commerce and direct-to-consumer models offers opportunities for niche flavor producers to reach a wider audience. Strategic partnerships with food manufacturers focused on product reformulation and innovation, as well as investments in research and development for novel flavor creation, are key catalysts for long-term growth, with potential to add millions in new revenue streams.
Leading Players in the Food Flavors Sector
- Givaudan
- International Flavors & Fragrances
- Firmenich
- Symrise
- Sensient
- MANE
- Takasago
- T. Hasegawa
- Robertet
- Frutarom Industries
- Huabao International
- Kerry
- DuPont
- Archer Daniels Midland
- Taiyo International
- Synergy Flavors
- Bell Flavors and Fragrances
- McCormick & Company
- DSM
- Dharampal Satyapal Group
- KIS
- Ungerer & Company
- Kotanyi
- Nilon
- AVT Natural
Key Milestones in Food Flavors Industry
- 2019: Increased focus on clean-label ingredients and plant-based alternatives gains momentum.
- 2020: COVID-19 pandemic accelerates demand for convenient, home-consumption food products, influencing flavor development.
- 2021: Significant investment in biotechnology for sustainable flavor production.
- 2022: Growing consumer interest in exotic and international flavor profiles.
- 2023: Emergence of AI in flavor formulation for predictive taste outcomes.
- 2024: Increased regulatory scrutiny on artificial sweeteners and a push for natural sugar replacements.
- 2025 (Estimated): Continued strong growth in the natural flavors segment, driven by consumer preference.
- 2026-2030: Expansion of functional flavors in beverages and supplements.
- 2030-2033: Further integration of sustainability principles in flavor sourcing and production.
Strategic Outlook for Food Flavors Market
The strategic outlook for the food flavors market is exceptionally positive, driven by ongoing shifts in consumer behavior and technological innovation. The unwavering demand for natural and clean-label ingredients will continue to shape product development, pushing manufacturers to invest in sustainable sourcing and production methods. The rise of personalized nutrition and functional foods presents a significant opportunity for tailored flavor solutions that enhance both taste and health benefits. Strategic partnerships between flavor houses and food manufacturers, focused on co-creation and rapid product development, will become increasingly crucial. Furthermore, the exploration of novel flavor sources and advanced delivery systems will unlock new product categories and market segments, ensuring sustained growth and profitability in this dynamic industry. The market is projected to grow by over one million dollars annually in the coming years.
Food Flavors Segmentation
-
1. Application
- 1.1. Beverages
- 1.2. Dairy & Frozen Products
- 1.3. Savory & Snacks
- 1.4. Animal & Pet Food
-
2. Type
- 2.1. Natural
- 2.2. Artificial
Food Flavors Segmentation By Geography
-
1. North America
- 1.1. United States
- 1.2. Canada
- 1.3. Mexico
-
2. South America
- 2.1. Brazil
- 2.2. Argentina
- 2.3. Rest of South America
-
3. Europe
- 3.1. United Kingdom
- 3.2. Germany
- 3.3. France
- 3.4. Italy
- 3.5. Spain
- 3.6. Russia
- 3.7. Benelux
- 3.8. Nordics
- 3.9. Rest of Europe
-
4. Middle East & Africa
- 4.1. Turkey
- 4.2. Israel
- 4.3. GCC
- 4.4. North Africa
- 4.5. South Africa
- 4.6. Rest of Middle East & Africa
-
5. Asia Pacific
- 5.1. China
- 5.2. India
- 5.3. Japan
- 5.4. South Korea
- 5.5. ASEAN
- 5.6. Oceania
- 5.7. Rest of Asia Pacific
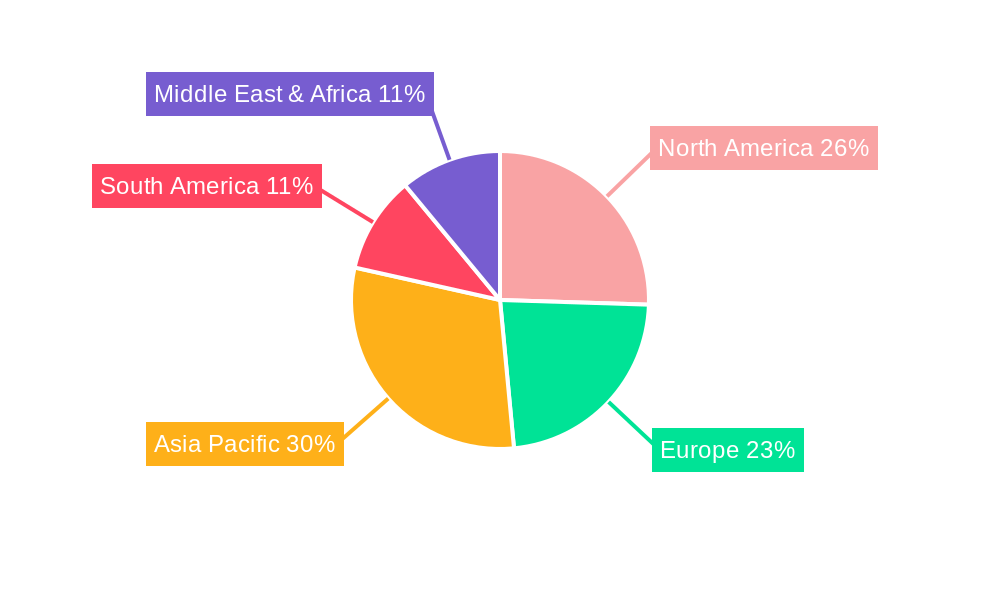
Food Flavors Regional Market Share
Geographic Coverage of Food Flavors
Food Flavors REPORT HIGHLIGHTS
| Aspects | Details |
|---|---|
| Study Period | 2020-2034 |
| Base Year | 2025 |
| Estimated Year | 2026 |
| Forecast Period | 2026-2034 |
| Historical Period | 2020-2025 |
| Growth Rate | CAGR of 4.7% from 2020-2034 |
| Segmentation |
|
Table of Contents
- 1. Introduction
- 1.1. Research Scope
- 1.2. Market Segmentation
- 1.3. Research Methodology
- 1.4. Definitions and Assumptions
- 2. Executive Summary
- 2.1. Introduction
- 3. Market Dynamics
- 3.1. Introduction
- 3.2. Market Drivers
- 3.3. Market Restrains
- 3.4. Market Trends
- 4. Market Factor Analysis
- 4.1. Porters Five Forces
- 4.2. Supply/Value Chain
- 4.3. PESTEL analysis
- 4.4. Market Entropy
- 4.5. Patent/Trademark Analysis
- 5. Global Food Flavors Analysis, Insights and Forecast, 2020-2032
- 5.1. Market Analysis, Insights and Forecast - by Application
- 5.1.1. Beverages
- 5.1.2. Dairy & Frozen Products
- 5.1.3. Savory & Snacks
- 5.1.4. Animal & Pet Food
- 5.2. Market Analysis, Insights and Forecast - by Type
- 5.2.1. Natural
- 5.2.2. Artificial
- 5.3. Market Analysis, Insights and Forecast - by Region
- 5.3.1. North America
- 5.3.2. South America
- 5.3.3. Europe
- 5.3.4. Middle East & Africa
- 5.3.5. Asia Pacific
- 5.1. Market Analysis, Insights and Forecast - by Application
- 6. North America Food Flavors Analysis, Insights and Forecast, 2020-2032
- 6.1. Market Analysis, Insights and Forecast - by Application
- 6.1.1. Beverages
- 6.1.2. Dairy & Frozen Products
- 6.1.3. Savory & Snacks
- 6.1.4. Animal & Pet Food
- 6.2. Market Analysis, Insights and Forecast - by Type
- 6.2.1. Natural
- 6.2.2. Artificial
- 6.1. Market Analysis, Insights and Forecast - by Application
- 7. South America Food Flavors Analysis, Insights and Forecast, 2020-2032
- 7.1. Market Analysis, Insights and Forecast - by Application
- 7.1.1. Beverages
- 7.1.2. Dairy & Frozen Products
- 7.1.3. Savory & Snacks
- 7.1.4. Animal & Pet Food
- 7.2. Market Analysis, Insights and Forecast - by Type
- 7.2.1. Natural
- 7.2.2. Artificial
- 7.1. Market Analysis, Insights and Forecast - by Application
- 8. Europe Food Flavors Analysis, Insights and Forecast, 2020-2032
- 8.1. Market Analysis, Insights and Forecast - by Application
- 8.1.1. Beverages
- 8.1.2. Dairy & Frozen Products
- 8.1.3. Savory & Snacks
- 8.1.4. Animal & Pet Food
- 8.2. Market Analysis, Insights and Forecast - by Type
- 8.2.1. Natural
- 8.2.2. Artificial
- 8.1. Market Analysis, Insights and Forecast - by Application
- 9. Middle East & Africa Food Flavors Analysis, Insights and Forecast, 2020-2032
- 9.1. Market Analysis, Insights and Forecast - by Application
- 9.1.1. Beverages
- 9.1.2. Dairy & Frozen Products
- 9.1.3. Savory & Snacks
- 9.1.4. Animal & Pet Food
- 9.2. Market Analysis, Insights and Forecast - by Type
- 9.2.1. Natural
- 9.2.2. Artificial
- 9.1. Market Analysis, Insights and Forecast - by Application
- 10. Asia Pacific Food Flavors Analysis, Insights and Forecast, 2020-2032
- 10.1. Market Analysis, Insights and Forecast - by Application
- 10.1.1. Beverages
- 10.1.2. Dairy & Frozen Products
- 10.1.3. Savory & Snacks
- 10.1.4. Animal & Pet Food
- 10.2. Market Analysis, Insights and Forecast - by Type
- 10.2.1. Natural
- 10.2.2. Artificial
- 10.1. Market Analysis, Insights and Forecast - by Application
- 11. Competitive Analysis
- 11.1. Global Market Share Analysis 2025
- 11.2. Company Profiles
- 11.2.1 Givaudan
- 11.2.1.1. Overview
- 11.2.1.2. Products
- 11.2.1.3. SWOT Analysis
- 11.2.1.4. Recent Developments
- 11.2.1.5. Financials (Based on Availability)
- 11.2.2 International Flavors & Fragrances
- 11.2.2.1. Overview
- 11.2.2.2. Products
- 11.2.2.3. SWOT Analysis
- 11.2.2.4. Recent Developments
- 11.2.2.5. Financials (Based on Availability)
- 11.2.3 Firmenich
- 11.2.3.1. Overview
- 11.2.3.2. Products
- 11.2.3.3. SWOT Analysis
- 11.2.3.4. Recent Developments
- 11.2.3.5. Financials (Based on Availability)
- 11.2.4 Symrise
- 11.2.4.1. Overview
- 11.2.4.2. Products
- 11.2.4.3. SWOT Analysis
- 11.2.4.4. Recent Developments
- 11.2.4.5. Financials (Based on Availability)
- 11.2.5 Sensient
- 11.2.5.1. Overview
- 11.2.5.2. Products
- 11.2.5.3. SWOT Analysis
- 11.2.5.4. Recent Developments
- 11.2.5.5. Financials (Based on Availability)
- 11.2.6 MANE
- 11.2.6.1. Overview
- 11.2.6.2. Products
- 11.2.6.3. SWOT Analysis
- 11.2.6.4. Recent Developments
- 11.2.6.5. Financials (Based on Availability)
- 11.2.7 Takasago
- 11.2.7.1. Overview
- 11.2.7.2. Products
- 11.2.7.3. SWOT Analysis
- 11.2.7.4. Recent Developments
- 11.2.7.5. Financials (Based on Availability)
- 11.2.8 T. Hasegawa
- 11.2.8.1. Overview
- 11.2.8.2. Products
- 11.2.8.3. SWOT Analysis
- 11.2.8.4. Recent Developments
- 11.2.8.5. Financials (Based on Availability)
- 11.2.9 Robertet
- 11.2.9.1. Overview
- 11.2.9.2. Products
- 11.2.9.3. SWOT Analysis
- 11.2.9.4. Recent Developments
- 11.2.9.5. Financials (Based on Availability)
- 11.2.10 Frutarom Industries
- 11.2.10.1. Overview
- 11.2.10.2. Products
- 11.2.10.3. SWOT Analysis
- 11.2.10.4. Recent Developments
- 11.2.10.5. Financials (Based on Availability)
- 11.2.11 Huabao International
- 11.2.11.1. Overview
- 11.2.11.2. Products
- 11.2.11.3. SWOT Analysis
- 11.2.11.4. Recent Developments
- 11.2.11.5. Financials (Based on Availability)
- 11.2.12 Kerry
- 11.2.12.1. Overview
- 11.2.12.2. Products
- 11.2.12.3. SWOT Analysis
- 11.2.12.4. Recent Developments
- 11.2.12.5. Financials (Based on Availability)
- 11.2.13 DuPont
- 11.2.13.1. Overview
- 11.2.13.2. Products
- 11.2.13.3. SWOT Analysis
- 11.2.13.4. Recent Developments
- 11.2.13.5. Financials (Based on Availability)
- 11.2.14 Archer Daniels Midland
- 11.2.14.1. Overview
- 11.2.14.2. Products
- 11.2.14.3. SWOT Analysis
- 11.2.14.4. Recent Developments
- 11.2.14.5. Financials (Based on Availability)
- 11.2.15 Taiyo International
- 11.2.15.1. Overview
- 11.2.15.2. Products
- 11.2.15.3. SWOT Analysis
- 11.2.15.4. Recent Developments
- 11.2.15.5. Financials (Based on Availability)
- 11.2.16 Synergy Flavors
- 11.2.16.1. Overview
- 11.2.16.2. Products
- 11.2.16.3. SWOT Analysis
- 11.2.16.4. Recent Developments
- 11.2.16.5. Financials (Based on Availability)
- 11.2.17 Bell Flavors and Fragrances
- 11.2.17.1. Overview
- 11.2.17.2. Products
- 11.2.17.3. SWOT Analysis
- 11.2.17.4. Recent Developments
- 11.2.17.5. Financials (Based on Availability)
- 11.2.18 McCormick & Company
- 11.2.18.1. Overview
- 11.2.18.2. Products
- 11.2.18.3. SWOT Analysis
- 11.2.18.4. Recent Developments
- 11.2.18.5. Financials (Based on Availability)
- 11.2.19 DSM
- 11.2.19.1. Overview
- 11.2.19.2. Products
- 11.2.19.3. SWOT Analysis
- 11.2.19.4. Recent Developments
- 11.2.19.5. Financials (Based on Availability)
- 11.2.20 Dharampal Satyapal Group
- 11.2.20.1. Overview
- 11.2.20.2. Products
- 11.2.20.3. SWOT Analysis
- 11.2.20.4. Recent Developments
- 11.2.20.5. Financials (Based on Availability)
- 11.2.21 KIS
- 11.2.21.1. Overview
- 11.2.21.2. Products
- 11.2.21.3. SWOT Analysis
- 11.2.21.4. Recent Developments
- 11.2.21.5. Financials (Based on Availability)
- 11.2.22 Ungerer & Company
- 11.2.22.1. Overview
- 11.2.22.2. Products
- 11.2.22.3. SWOT Analysis
- 11.2.22.4. Recent Developments
- 11.2.22.5. Financials (Based on Availability)
- 11.2.23 Kotanyi
- 11.2.23.1. Overview
- 11.2.23.2. Products
- 11.2.23.3. SWOT Analysis
- 11.2.23.4. Recent Developments
- 11.2.23.5. Financials (Based on Availability)
- 11.2.24 Nilon
- 11.2.24.1. Overview
- 11.2.24.2. Products
- 11.2.24.3. SWOT Analysis
- 11.2.24.4. Recent Developments
- 11.2.24.5. Financials (Based on Availability)
- 11.2.25 AVT Natural
- 11.2.25.1. Overview
- 11.2.25.2. Products
- 11.2.25.3. SWOT Analysis
- 11.2.25.4. Recent Developments
- 11.2.25.5. Financials (Based on Availability)
- 11.2.1 Givaudan
List of Figures
- Figure 1: Global Food Flavors Revenue Breakdown (billion, %) by Region 2025 & 2033
- Figure 2: Global Food Flavors Volume Breakdown (K, %) by Region 2025 & 2033
- Figure 3: North America Food Flavors Revenue (billion), by Application 2025 & 2033
- Figure 4: North America Food Flavors Volume (K), by Application 2025 & 2033
- Figure 5: North America Food Flavors Revenue Share (%), by Application 2025 & 2033
- Figure 6: North America Food Flavors Volume Share (%), by Application 2025 & 2033
- Figure 7: North America Food Flavors Revenue (billion), by Type 2025 & 2033
- Figure 8: North America Food Flavors Volume (K), by Type 2025 & 2033
- Figure 9: North America Food Flavors Revenue Share (%), by Type 2025 & 2033
- Figure 10: North America Food Flavors Volume Share (%), by Type 2025 & 2033
- Figure 11: North America Food Flavors Revenue (billion), by Country 2025 & 2033
- Figure 12: North America Food Flavors Volume (K), by Country 2025 & 2033
- Figure 13: North America Food Flavors Revenue Share (%), by Country 2025 & 2033
- Figure 14: North America Food Flavors Volume Share (%), by Country 2025 & 2033
- Figure 15: South America Food Flavors Revenue (billion), by Application 2025 & 2033
- Figure 16: South America Food Flavors Volume (K), by Application 2025 & 2033
- Figure 17: South America Food Flavors Revenue Share (%), by Application 2025 & 2033
- Figure 18: South America Food Flavors Volume Share (%), by Application 2025 & 2033
- Figure 19: South America Food Flavors Revenue (billion), by Type 2025 & 2033
- Figure 20: South America Food Flavors Volume (K), by Type 2025 & 2033
- Figure 21: South America Food Flavors Revenue Share (%), by Type 2025 & 2033
- Figure 22: South America Food Flavors Volume Share (%), by Type 2025 & 2033
- Figure 23: South America Food Flavors Revenue (billion), by Country 2025 & 2033
- Figure 24: South America Food Flavors Volume (K), by Country 2025 & 2033
- Figure 25: South America Food Flavors Revenue Share (%), by Country 2025 & 2033
- Figure 26: South America Food Flavors Volume Share (%), by Country 2025 & 2033
- Figure 27: Europe Food Flavors Revenue (billion), by Application 2025 & 2033
- Figure 28: Europe Food Flavors Volume (K), by Application 2025 & 2033
- Figure 29: Europe Food Flavors Revenue Share (%), by Application 2025 & 2033
- Figure 30: Europe Food Flavors Volume Share (%), by Application 2025 & 2033
- Figure 31: Europe Food Flavors Revenue (billion), by Type 2025 & 2033
- Figure 32: Europe Food Flavors Volume (K), by Type 2025 & 2033
- Figure 33: Europe Food Flavors Revenue Share (%), by Type 2025 & 2033
- Figure 34: Europe Food Flavors Volume Share (%), by Type 2025 & 2033
- Figure 35: Europe Food Flavors Revenue (billion), by Country 2025 & 2033
- Figure 36: Europe Food Flavors Volume (K), by Country 2025 & 2033
- Figure 37: Europe Food Flavors Revenue Share (%), by Country 2025 & 2033
- Figure 38: Europe Food Flavors Volume Share (%), by Country 2025 & 2033
- Figure 39: Middle East & Africa Food Flavors Revenue (billion), by Application 2025 & 2033
- Figure 40: Middle East & Africa Food Flavors Volume (K), by Application 2025 & 2033
- Figure 41: Middle East & Africa Food Flavors Revenue Share (%), by Application 2025 & 2033
- Figure 42: Middle East & Africa Food Flavors Volume Share (%), by Application 2025 & 2033
- Figure 43: Middle East & Africa Food Flavors Revenue (billion), by Type 2025 & 2033
- Figure 44: Middle East & Africa Food Flavors Volume (K), by Type 2025 & 2033
- Figure 45: Middle East & Africa Food Flavors Revenue Share (%), by Type 2025 & 2033
- Figure 46: Middle East & Africa Food Flavors Volume Share (%), by Type 2025 & 2033
- Figure 47: Middle East & Africa Food Flavors Revenue (billion), by Country 2025 & 2033
- Figure 48: Middle East & Africa Food Flavors Volume (K), by Country 2025 & 2033
- Figure 49: Middle East & Africa Food Flavors Revenue Share (%), by Country 2025 & 2033
- Figure 50: Middle East & Africa Food Flavors Volume Share (%), by Country 2025 & 2033
- Figure 51: Asia Pacific Food Flavors Revenue (billion), by Application 2025 & 2033
- Figure 52: Asia Pacific Food Flavors Volume (K), by Application 2025 & 2033
- Figure 53: Asia Pacific Food Flavors Revenue Share (%), by Application 2025 & 2033
- Figure 54: Asia Pacific Food Flavors Volume Share (%), by Application 2025 & 2033
- Figure 55: Asia Pacific Food Flavors Revenue (billion), by Type 2025 & 2033
- Figure 56: Asia Pacific Food Flavors Volume (K), by Type 2025 & 2033
- Figure 57: Asia Pacific Food Flavors Revenue Share (%), by Type 2025 & 2033
- Figure 58: Asia Pacific Food Flavors Volume Share (%), by Type 2025 & 2033
- Figure 59: Asia Pacific Food Flavors Revenue (billion), by Country 2025 & 2033
- Figure 60: Asia Pacific Food Flavors Volume (K), by Country 2025 & 2033
- Figure 61: Asia Pacific Food Flavors Revenue Share (%), by Country 2025 & 2033
- Figure 62: Asia Pacific Food Flavors Volume Share (%), by Country 2025 & 2033
List of Tables
- Table 1: Global Food Flavors Revenue billion Forecast, by Application 2020 & 2033
- Table 2: Global Food Flavors Volume K Forecast, by Application 2020 & 2033
- Table 3: Global Food Flavors Revenue billion Forecast, by Type 2020 & 2033
- Table 4: Global Food Flavors Volume K Forecast, by Type 2020 & 2033
- Table 5: Global Food Flavors Revenue billion Forecast, by Region 2020 & 2033
- Table 6: Global Food Flavors Volume K Forecast, by Region 2020 & 2033
- Table 7: Global Food Flavors Revenue billion Forecast, by Application 2020 & 2033
- Table 8: Global Food Flavors Volume K Forecast, by Application 2020 & 2033
- Table 9: Global Food Flavors Revenue billion Forecast, by Type 2020 & 2033
- Table 10: Global Food Flavors Volume K Forecast, by Type 2020 & 2033
- Table 11: Global Food Flavors Revenue billion Forecast, by Country 2020 & 2033
- Table 12: Global Food Flavors Volume K Forecast, by Country 2020 & 2033
- Table 13: United States Food Flavors Revenue (billion) Forecast, by Application 2020 & 2033
- Table 14: United States Food Flavors Volume (K) Forecast, by Application 2020 & 2033
- Table 15: Canada Food Flavors Revenue (billion) Forecast, by Application 2020 & 2033
- Table 16: Canada Food Flavors Volume (K) Forecast, by Application 2020 & 2033
- Table 17: Mexico Food Flavors Revenue (billion) Forecast, by Application 2020 & 2033
- Table 18: Mexico Food Flavors Volume (K) Forecast, by Application 2020 & 2033
- Table 19: Global Food Flavors Revenue billion Forecast, by Application 2020 & 2033
- Table 20: Global Food Flavors Volume K Forecast, by Application 2020 & 2033
- Table 21: Global Food Flavors Revenue billion Forecast, by Type 2020 & 2033
- Table 22: Global Food Flavors Volume K Forecast, by Type 2020 & 2033
- Table 23: Global Food Flavors Revenue billion Forecast, by Country 2020 & 2033
- Table 24: Global Food Flavors Volume K Forecast, by Country 2020 & 2033
- Table 25: Brazil Food Flavors Revenue (billion) Forecast, by Application 2020 & 2033
- Table 26: Brazil Food Flavors Volume (K) Forecast, by Application 2020 & 2033
- Table 27: Argentina Food Flavors Revenue (billion) Forecast, by Application 2020 & 2033
- Table 28: Argentina Food Flavors Volume (K) Forecast, by Application 2020 & 2033
- Table 29: Rest of South America Food Flavors Revenue (billion) Forecast, by Application 2020 & 2033
- Table 30: Rest of South America Food Flavors Volume (K) Forecast, by Application 2020 & 2033
- Table 31: Global Food Flavors Revenue billion Forecast, by Application 2020 & 2033
- Table 32: Global Food Flavors Volume K Forecast, by Application 2020 & 2033
- Table 33: Global Food Flavors Revenue billion Forecast, by Type 2020 & 2033
- Table 34: Global Food Flavors Volume K Forecast, by Type 2020 & 2033
- Table 35: Global Food Flavors Revenue billion Forecast, by Country 2020 & 2033
- Table 36: Global Food Flavors Volume K Forecast, by Country 2020 & 2033
- Table 37: United Kingdom Food Flavors Revenue (billion) Forecast, by Application 2020 & 2033
- Table 38: United Kingdom Food Flavors Volume (K) Forecast, by Application 2020 & 2033
- Table 39: Germany Food Flavors Revenue (billion) Forecast, by Application 2020 & 2033
- Table 40: Germany Food Flavors Volume (K) Forecast, by Application 2020 & 2033
- Table 41: France Food Flavors Revenue (billion) Forecast, by Application 2020 & 2033
- Table 42: France Food Flavors Volume (K) Forecast, by Application 2020 & 2033
- Table 43: Italy Food Flavors Revenue (billion) Forecast, by Application 2020 & 2033
- Table 44: Italy Food Flavors Volume (K) Forecast, by Application 2020 & 2033
- Table 45: Spain Food Flavors Revenue (billion) Forecast, by Application 2020 & 2033
- Table 46: Spain Food Flavors Volume (K) Forecast, by Application 2020 & 2033
- Table 47: Russia Food Flavors Revenue (billion) Forecast, by Application 2020 & 2033
- Table 48: Russia Food Flavors Volume (K) Forecast, by Application 2020 & 2033
- Table 49: Benelux Food Flavors Revenue (billion) Forecast, by Application 2020 & 2033
- Table 50: Benelux Food Flavors Volume (K) Forecast, by Application 2020 & 2033
- Table 51: Nordics Food Flavors Revenue (billion) Forecast, by Application 2020 & 2033
- Table 52: Nordics Food Flavors Volume (K) Forecast, by Application 2020 & 2033
- Table 53: Rest of Europe Food Flavors Revenue (billion) Forecast, by Application 2020 & 2033
- Table 54: Rest of Europe Food Flavors Volume (K) Forecast, by Application 2020 & 2033
- Table 55: Global Food Flavors Revenue billion Forecast, by Application 2020 & 2033
- Table 56: Global Food Flavors Volume K Forecast, by Application 2020 & 2033
- Table 57: Global Food Flavors Revenue billion Forecast, by Type 2020 & 2033
- Table 58: Global Food Flavors Volume K Forecast, by Type 2020 & 2033
- Table 59: Global Food Flavors Revenue billion Forecast, by Country 2020 & 2033
- Table 60: Global Food Flavors Volume K Forecast, by Country 2020 & 2033
- Table 61: Turkey Food Flavors Revenue (billion) Forecast, by Application 2020 & 2033
- Table 62: Turkey Food Flavors Volume (K) Forecast, by Application 2020 & 2033
- Table 63: Israel Food Flavors Revenue (billion) Forecast, by Application 2020 & 2033
- Table 64: Israel Food Flavors Volume (K) Forecast, by Application 2020 & 2033
- Table 65: GCC Food Flavors Revenue (billion) Forecast, by Application 2020 & 2033
- Table 66: GCC Food Flavors Volume (K) Forecast, by Application 2020 & 2033
- Table 67: North Africa Food Flavors Revenue (billion) Forecast, by Application 2020 & 2033
- Table 68: North Africa Food Flavors Volume (K) Forecast, by Application 2020 & 2033
- Table 69: South Africa Food Flavors Revenue (billion) Forecast, by Application 2020 & 2033
- Table 70: South Africa Food Flavors Volume (K) Forecast, by Application 2020 & 2033
- Table 71: Rest of Middle East & Africa Food Flavors Revenue (billion) Forecast, by Application 2020 & 2033
- Table 72: Rest of Middle East & Africa Food Flavors Volume (K) Forecast, by Application 2020 & 2033
- Table 73: Global Food Flavors Revenue billion Forecast, by Application 2020 & 2033
- Table 74: Global Food Flavors Volume K Forecast, by Application 2020 & 2033
- Table 75: Global Food Flavors Revenue billion Forecast, by Type 2020 & 2033
- Table 76: Global Food Flavors Volume K Forecast, by Type 2020 & 2033
- Table 77: Global Food Flavors Revenue billion Forecast, by Country 2020 & 2033
- Table 78: Global Food Flavors Volume K Forecast, by Country 2020 & 2033
- Table 79: China Food Flavors Revenue (billion) Forecast, by Application 2020 & 2033
- Table 80: China Food Flavors Volume (K) Forecast, by Application 2020 & 2033
- Table 81: India Food Flavors Revenue (billion) Forecast, by Application 2020 & 2033
- Table 82: India Food Flavors Volume (K) Forecast, by Application 2020 & 2033
- Table 83: Japan Food Flavors Revenue (billion) Forecast, by Application 2020 & 2033
- Table 84: Japan Food Flavors Volume (K) Forecast, by Application 2020 & 2033
- Table 85: South Korea Food Flavors Revenue (billion) Forecast, by Application 2020 & 2033
- Table 86: South Korea Food Flavors Volume (K) Forecast, by Application 2020 & 2033
- Table 87: ASEAN Food Flavors Revenue (billion) Forecast, by Application 2020 & 2033
- Table 88: ASEAN Food Flavors Volume (K) Forecast, by Application 2020 & 2033
- Table 89: Oceania Food Flavors Revenue (billion) Forecast, by Application 2020 & 2033
- Table 90: Oceania Food Flavors Volume (K) Forecast, by Application 2020 & 2033
- Table 91: Rest of Asia Pacific Food Flavors Revenue (billion) Forecast, by Application 2020 & 2033
- Table 92: Rest of Asia Pacific Food Flavors Volume (K) Forecast, by Application 2020 & 2033
Frequently Asked Questions
1. What is the projected Compound Annual Growth Rate (CAGR) of the Food Flavors?
The projected CAGR is approximately 4.7%.
2. Which companies are prominent players in the Food Flavors?
Key companies in the market include Givaudan, International Flavors & Fragrances, Firmenich, Symrise, Sensient, MANE, Takasago, T. Hasegawa, Robertet, Frutarom Industries, Huabao International, Kerry, DuPont, Archer Daniels Midland, Taiyo International, Synergy Flavors, Bell Flavors and Fragrances, McCormick & Company, DSM, Dharampal Satyapal Group, KIS, Ungerer & Company, Kotanyi, Nilon, AVT Natural.
3. What are the main segments of the Food Flavors?
The market segments include Application, Type.
4. Can you provide details about the market size?
The market size is estimated to be USD 11.6 billion as of 2022.
5. What are some drivers contributing to market growth?
N/A
6. What are the notable trends driving market growth?
N/A
7. Are there any restraints impacting market growth?
N/A
8. Can you provide examples of recent developments in the market?
N/A
9. What pricing options are available for accessing the report?
Pricing options include single-user, multi-user, and enterprise licenses priced at USD 3950.00, USD 5925.00, and USD 7900.00 respectively.
10. Is the market size provided in terms of value or volume?
The market size is provided in terms of value, measured in billion and volume, measured in K.
11. Are there any specific market keywords associated with the report?
Yes, the market keyword associated with the report is "Food Flavors," which aids in identifying and referencing the specific market segment covered.
12. How do I determine which pricing option suits my needs best?
The pricing options vary based on user requirements and access needs. Individual users may opt for single-user licenses, while businesses requiring broader access may choose multi-user or enterprise licenses for cost-effective access to the report.
13. Are there any additional resources or data provided in the Food Flavors report?
While the report offers comprehensive insights, it's advisable to review the specific contents or supplementary materials provided to ascertain if additional resources or data are available.
14. How can I stay updated on further developments or reports in the Food Flavors?
To stay informed about further developments, trends, and reports in the Food Flavors, consider subscribing to industry newsletters, following relevant companies and organizations, or regularly checking reputable industry news sources and publications.
Methodology
Step 1 - Identification of Relevant Samples Size from Population Database


Step 2 - Approaches for Defining Global Market Size (Value, Volume* & Price*)

Note*: In applicable scenarios
Step 3 - Data Sources
Primary Research
- Web Analytics
- Survey Reports
- Research Institute
- Latest Research Reports
- Opinion Leaders
Secondary Research
- Annual Reports
- White Paper
- Latest Press Release
- Industry Association
- Paid Database
- Investor Presentations

Step 4 - Data Triangulation
Involves using different sources of information in order to increase the validity of a study
These sources are likely to be stakeholders in a program - participants, other researchers, program staff, other community members, and so on.
Then we put all data in single framework & apply various statistical tools to find out the dynamic on the market.
During the analysis stage, feedback from the stakeholder groups would be compared to determine areas of agreement as well as areas of divergence