

Key Insights
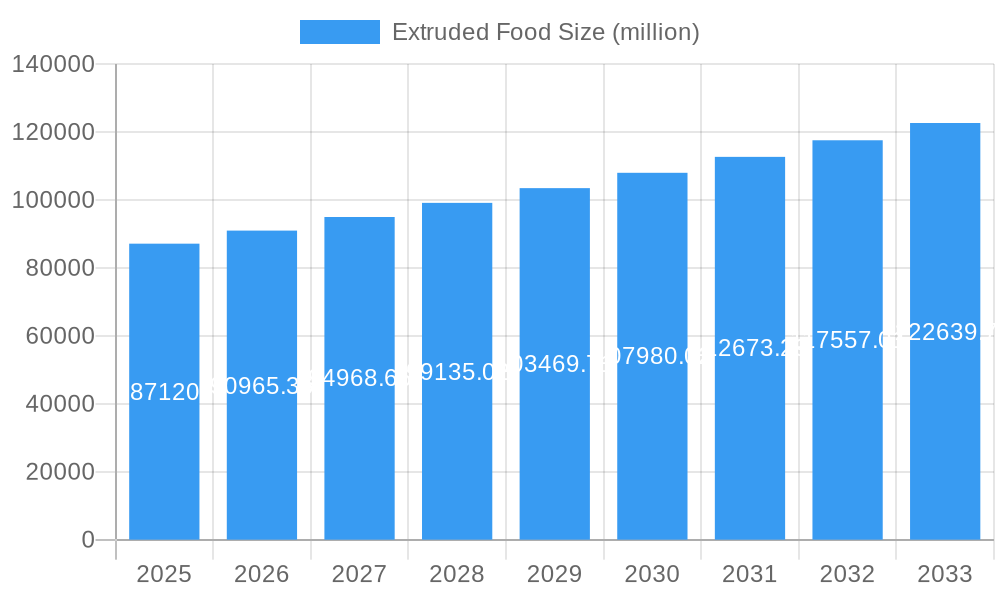
The extruded food market, valued at $87.12 billion in 2025, is projected to experience robust growth, driven by several key factors. The rising demand for convenient and ready-to-eat snacks, coupled with increasing consumer preference for healthier, fortified options, fuels market expansion. Innovation in product formulation, encompassing diverse flavors, textures, and healthier ingredients like whole grains and reduced sodium, further stimulates demand. The expansion of e-commerce channels and the growing popularity of online grocery shopping provide additional impetus for market growth. Major players like Frito-Lay, Kellogg's, and Calbee are strategically investing in research and development, expanding their product portfolios, and exploring new distribution channels to maintain their competitive edge. This competitive landscape fosters innovation and drives market expansion, benefiting consumers with a wider range of choices.
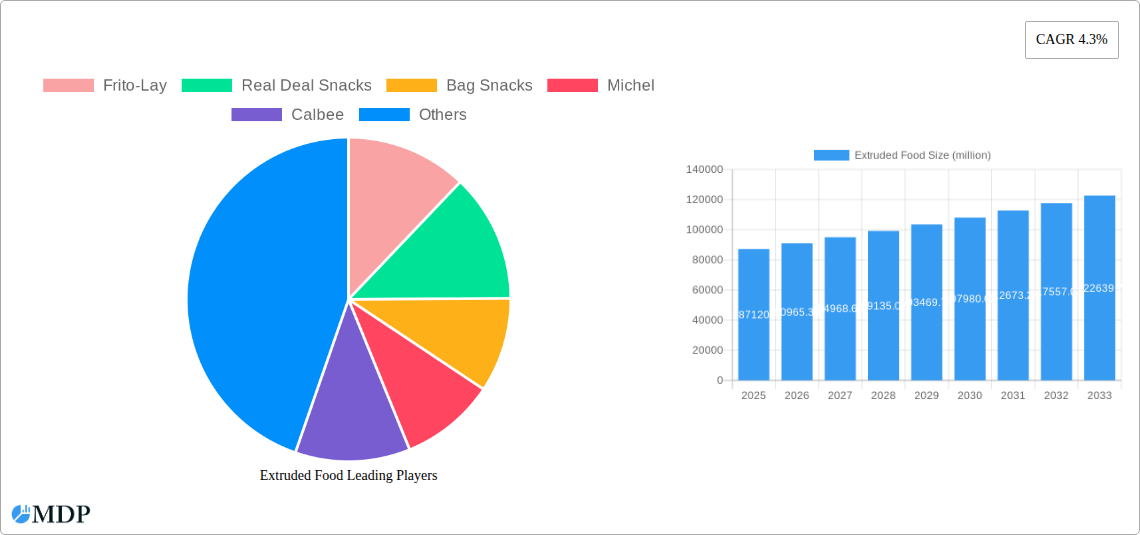
Extruded Food Market Size (In Billion)
However, several factors could potentially restrain market growth. Fluctuations in raw material prices, particularly agricultural commodities, can impact profitability and pricing strategies. Growing health concerns regarding high-sodium and processed food intake may lead to a shift towards more naturally processed alternatives, although the extruded food market is proactively addressing this through healthier product innovations. Stringent regulatory frameworks and evolving consumer preferences present ongoing challenges that require companies to continuously adapt their product offerings and manufacturing processes. Despite these restraints, the overall market outlook for extruded foods remains positive, driven by sustained demand, innovation, and strategic market penetration by major players. The projected Compound Annual Growth Rate (CAGR) of 4.3% from 2025 to 2033 indicates significant growth potential over the forecast period. This implies a market size exceeding $125 billion by 2033, assuming consistent market dynamics.
Extruded Food Company Market Share
Extruded Food Market Report: 2019-2033 - A Comprehensive Analysis
This comprehensive report provides an in-depth analysis of the extruded food market from 2019 to 2033, offering invaluable insights for industry stakeholders. The report covers market dynamics, leading players, emerging trends, and future growth opportunities, leveraging extensive data and expert analysis to deliver actionable intelligence. With a focus on key segments and geographical regions, this report is an essential resource for strategic decision-making in this dynamic market. The report covers a total market size exceeding $XX million in 2025, projected to reach $XX million by 2033, exhibiting a CAGR of XX% during the forecast period (2025-2033).
Extruded Food Market Dynamics & Concentration
The extruded food market is characterized by a moderately concentrated landscape, with several major players holding significant market share. Frito-Lay, Kellogg's, and Calbee are among the leading companies, collectively accounting for an estimated XX% of the global market in 2025. However, the market also features a number of smaller, niche players, particularly in the burgeoning healthy snacks segment.
Market concentration is influenced by several factors, including:
- Innovation: Continuous innovation in extrusion technology and product formulation drives market growth and allows companies to differentiate themselves.
- Regulatory Frameworks: Stringent food safety regulations and labeling requirements impact production costs and market entry barriers.
- Product Substitutes: The availability of alternative snack and food options poses a competitive challenge, necessitating ongoing product development.
- End-User Trends: Growing consumer demand for healthier, more convenient, and diverse snack options significantly shapes market dynamics.
- M&A Activities: Mergers and acquisitions play a crucial role in shaping market consolidation and driving innovation. Over the historical period (2019-2024), approximately XX M&A deals were recorded in the extruded food sector.
Extruded Food Industry Trends & Analysis
The extruded food market is experiencing robust growth driven by several key factors. Consumer demand for convenient and affordable snacks, particularly amongst younger demographics, is a major driver. The increasing popularity of extruded products in various food categories, such as breakfast cereals, pet food, and meat alternatives, further fuels market expansion. Technological advancements in extrusion technology enable the creation of novel textures and functionalities, enhancing product appeal and broadening applications.
The market's growth trajectory is further propelled by:
- Technological Disruptions: Advanced extrusion technologies are improving efficiency and product quality, leading to cost reductions and greater product variety.
- Consumer Preferences: The shift towards healthier and more natural snack options influences product development and market segmentation.
- Competitive Dynamics: Intense competition fosters innovation and drives the development of differentiated products.
The global extruded food market exhibited a CAGR of XX% during the historical period (2019-2024) and a market penetration of approximately XX% in 2025. This trend is expected to continue into the forecast period, with significant growth potential in emerging markets.
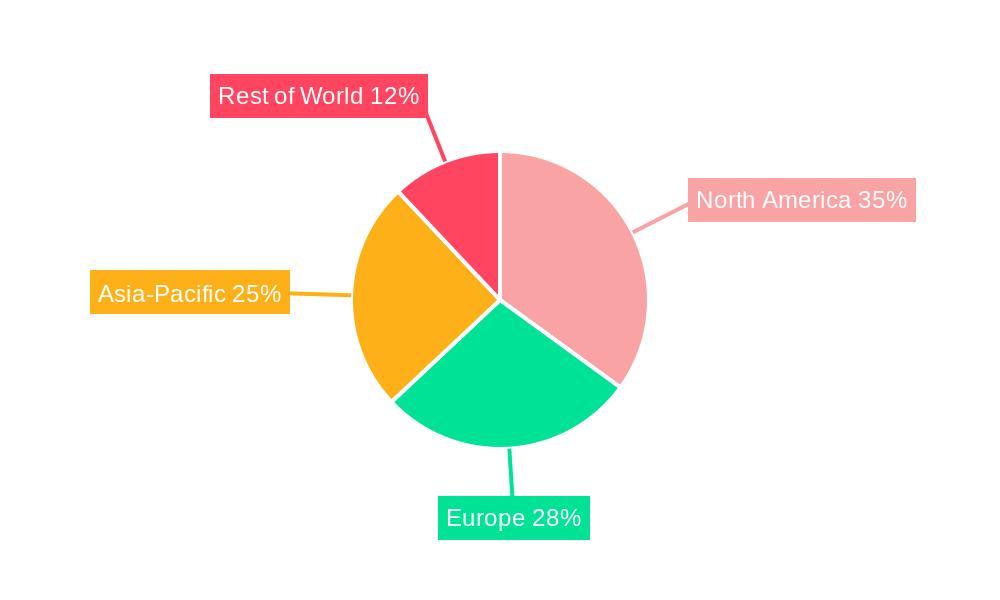
Leading Markets & Segments in Extruded Food
The North American region currently dominates the global extruded food market, accounting for approximately XX% of the total market value in 2025. This dominance is attributed to several factors:
- Strong Consumer Demand: High disposable incomes and a preference for convenient snack foods drive robust consumption.
- Developed Infrastructure: Established food processing and distribution networks facilitate efficient production and supply.
- Innovation Hub: Significant investment in research and development leads to the creation of innovative products.
Other regions, such as Asia-Pacific and Europe, also demonstrate significant growth potential, driven by factors including rising middle-class populations and increasing adoption of westernized diets. Within segments, the savory snacks category maintains a leading position, followed by breakfast cereals and pet foods.
Extruded Food Product Developments
Recent innovations in extruded food products focus on enhancing nutritional value, improving texture, and broadening flavor profiles. Advances in extrusion technology allow for greater control over product characteristics such as porosity, density, and shape. This has led to the development of novel products such as healthier snacks with reduced fat and sodium content and extruded meat and plant-based alternatives. These developments reflect the growing consumer demand for healthier, more sustainable, and convenient food options, effectively expanding the applications of extruded foods across various markets.
Key Drivers of Extruded Food Growth
The extruded food market's growth is fueled by a confluence of factors:
- Technological Advancements: Improved extrusion techniques enable cost-effective production of high-quality products with enhanced nutritional and sensory attributes.
- Economic Growth: Rising disposable incomes in emerging economies fuel demand for affordable and convenient snack options.
- Favorable Regulatory Environment: Supportive government policies and food safety regulations foster market development.
Challenges in the Extruded Food Market
The extruded food market faces several challenges:
- Regulatory Hurdles: Strict food safety regulations and labeling requirements increase production costs and complicate market entry. Non-compliance can result in penalties impacting profit margins.
- Supply Chain Disruptions: Fluctuations in raw material prices and geopolitical instability can impact production and distribution efficiency. This necessitates robust supply chain management.
- Intense Competition: The presence of numerous established and emerging players creates intense competition, requiring continuous product innovation and brand building.
Emerging Opportunities in Extruded Food
Significant opportunities exist for growth in the extruded food market, particularly within the healthy and functional foods segments. The incorporation of novel ingredients, such as superfoods and functional fibers, can cater to growing health-conscious consumer preferences. Furthermore, the development of sustainable and environmentally friendly extrusion processes can contribute to enhanced brand image and market appeal, fostering long-term market growth.
Key Milestones in Extruded Food Industry
- 2020: Introduction of plant-based extruded snacks by several major players.
- 2021: Increased focus on sustainable and eco-friendly extrusion processes.
- 2022: Several significant mergers and acquisitions consolidate market share.
- 2023: Launch of innovative extruded products with enhanced nutritional value.
- 2024: Growing adoption of advanced extrusion technologies for improved efficiency and product quality.
Strategic Outlook for Extruded Food Market
The extruded food market presents significant growth opportunities, driven by technological innovations, evolving consumer preferences, and expansion into new markets. Companies adopting strategic initiatives such as product diversification, sustainable sourcing, and targeted marketing strategies are poised to capture a larger market share. Focusing on health and wellness, coupled with sustainable production methods, will be crucial for long-term success in this dynamic market.
Extruded Food Segmentation
-
1. Application
- 1.1. Supermarket
- 1.2. Hypermarket
- 1.3. E-Commerce
- 1.4. Other
-
2. Type
- 2.1. Hot Extrusion Food Processing
- 2.2. Cold Extrusion Food Processing
Extruded Food Segmentation By Geography
-
1. North America
- 1.1. United States
- 1.2. Canada
- 1.3. Mexico
-
2. South America
- 2.1. Brazil
- 2.2. Argentina
- 2.3. Rest of South America
-
3. Europe
- 3.1. United Kingdom
- 3.2. Germany
- 3.3. France
- 3.4. Italy
- 3.5. Spain
- 3.6. Russia
- 3.7. Benelux
- 3.8. Nordics
- 3.9. Rest of Europe
-
4. Middle East & Africa
- 4.1. Turkey
- 4.2. Israel
- 4.3. GCC
- 4.4. North Africa
- 4.5. South Africa
- 4.6. Rest of Middle East & Africa
-
5. Asia Pacific
- 5.1. China
- 5.2. India
- 5.3. Japan
- 5.4. South Korea
- 5.5. ASEAN
- 5.6. Oceania
- 5.7. Rest of Asia Pacific
Extruded Food Regional Market Share
Geographic Coverage of Extruded Food
Extruded Food REPORT HIGHLIGHTS
| Aspects | Details |
|---|---|
| Study Period | 2020-2034 |
| Base Year | 2025 |
| Estimated Year | 2026 |
| Forecast Period | 2026-2034 |
| Historical Period | 2020-2025 |
| Growth Rate | CAGR of 4.3% from 2020-2034 |
| Segmentation |
|
Table of Contents
- 1. Introduction
- 1.1. Research Scope
- 1.2. Market Segmentation
- 1.3. Research Methodology
- 1.4. Definitions and Assumptions
- 2. Executive Summary
- 2.1. Introduction
- 3. Market Dynamics
- 3.1. Introduction
- 3.2. Market Drivers
- 3.3. Market Restrains
- 3.4. Market Trends
- 4. Market Factor Analysis
- 4.1. Porters Five Forces
- 4.2. Supply/Value Chain
- 4.3. PESTEL analysis
- 4.4. Market Entropy
- 4.5. Patent/Trademark Analysis
- 5. Global Extruded Food Analysis, Insights and Forecast, 2020-2032
- 5.1. Market Analysis, Insights and Forecast - by Application
- 5.1.1. Supermarket
- 5.1.2. Hypermarket
- 5.1.3. E-Commerce
- 5.1.4. Other
- 5.2. Market Analysis, Insights and Forecast - by Type
- 5.2.1. Hot Extrusion Food Processing
- 5.2.2. Cold Extrusion Food Processing
- 5.3. Market Analysis, Insights and Forecast - by Region
- 5.3.1. North America
- 5.3.2. South America
- 5.3.3. Europe
- 5.3.4. Middle East & Africa
- 5.3.5. Asia Pacific
- 5.1. Market Analysis, Insights and Forecast - by Application
- 6. North America Extruded Food Analysis, Insights and Forecast, 2020-2032
- 6.1. Market Analysis, Insights and Forecast - by Application
- 6.1.1. Supermarket
- 6.1.2. Hypermarket
- 6.1.3. E-Commerce
- 6.1.4. Other
- 6.2. Market Analysis, Insights and Forecast - by Type
- 6.2.1. Hot Extrusion Food Processing
- 6.2.2. Cold Extrusion Food Processing
- 6.1. Market Analysis, Insights and Forecast - by Application
- 7. South America Extruded Food Analysis, Insights and Forecast, 2020-2032
- 7.1. Market Analysis, Insights and Forecast - by Application
- 7.1.1. Supermarket
- 7.1.2. Hypermarket
- 7.1.3. E-Commerce
- 7.1.4. Other
- 7.2. Market Analysis, Insights and Forecast - by Type
- 7.2.1. Hot Extrusion Food Processing
- 7.2.2. Cold Extrusion Food Processing
- 7.1. Market Analysis, Insights and Forecast - by Application
- 8. Europe Extruded Food Analysis, Insights and Forecast, 2020-2032
- 8.1. Market Analysis, Insights and Forecast - by Application
- 8.1.1. Supermarket
- 8.1.2. Hypermarket
- 8.1.3. E-Commerce
- 8.1.4. Other
- 8.2. Market Analysis, Insights and Forecast - by Type
- 8.2.1. Hot Extrusion Food Processing
- 8.2.2. Cold Extrusion Food Processing
- 8.1. Market Analysis, Insights and Forecast - by Application
- 9. Middle East & Africa Extruded Food Analysis, Insights and Forecast, 2020-2032
- 9.1. Market Analysis, Insights and Forecast - by Application
- 9.1.1. Supermarket
- 9.1.2. Hypermarket
- 9.1.3. E-Commerce
- 9.1.4. Other
- 9.2. Market Analysis, Insights and Forecast - by Type
- 9.2.1. Hot Extrusion Food Processing
- 9.2.2. Cold Extrusion Food Processing
- 9.1. Market Analysis, Insights and Forecast - by Application
- 10. Asia Pacific Extruded Food Analysis, Insights and Forecast, 2020-2032
- 10.1. Market Analysis, Insights and Forecast - by Application
- 10.1.1. Supermarket
- 10.1.2. Hypermarket
- 10.1.3. E-Commerce
- 10.1.4. Other
- 10.2. Market Analysis, Insights and Forecast - by Type
- 10.2.1. Hot Extrusion Food Processing
- 10.2.2. Cold Extrusion Food Processing
- 10.1. Market Analysis, Insights and Forecast - by Application
- 11. Competitive Analysis
- 11.1. Global Market Share Analysis 2025
- 11.2. Company Profiles
- 11.2.1 Frito-Lay
- 11.2.1.1. Overview
- 11.2.1.2. Products
- 11.2.1.3. SWOT Analysis
- 11.2.1.4. Recent Developments
- 11.2.1.5. Financials (Based on Availability)
- 11.2.2 Real Deal Snacks
- 11.2.2.1. Overview
- 11.2.2.2. Products
- 11.2.2.3. SWOT Analysis
- 11.2.2.4. Recent Developments
- 11.2.2.5. Financials (Based on Availability)
- 11.2.3 Bag Snacks
- 11.2.3.1. Overview
- 11.2.3.2. Products
- 11.2.3.3. SWOT Analysis
- 11.2.3.4. Recent Developments
- 11.2.3.5. Financials (Based on Availability)
- 11.2.4 Michel
- 11.2.4.1. Overview
- 11.2.4.2. Products
- 11.2.4.3. SWOT Analysis
- 11.2.4.4. Recent Developments
- 11.2.4.5. Financials (Based on Availability)
- 11.2.5 Calbee
- 11.2.5.1. Overview
- 11.2.5.2. Products
- 11.2.5.3. SWOT Analysis
- 11.2.5.4. Recent Developments
- 11.2.5.5. Financials (Based on Availability)
- 11.2.6 Kelloggs
- 11.2.6.1. Overview
- 11.2.6.2. Products
- 11.2.6.3. SWOT Analysis
- 11.2.6.4. Recent Developments
- 11.2.6.5. Financials (Based on Availability)
- 11.2.7 Nature's Path
- 11.2.7.1. Overview
- 11.2.7.2. Products
- 11.2.7.3. SWOT Analysis
- 11.2.7.4. Recent Developments
- 11.2.7.5. Financials (Based on Availability)
- 11.2.8 Ralston Foods
- 11.2.8.1. Overview
- 11.2.8.2. Products
- 11.2.8.3. SWOT Analysis
- 11.2.8.4. Recent Developments
- 11.2.8.5. Financials (Based on Availability)
- 11.2.9 Intersnack
- 11.2.9.1. Overview
- 11.2.9.2. Products
- 11.2.9.3. SWOT Analysis
- 11.2.9.4. Recent Developments
- 11.2.9.5. Financials (Based on Availability)
- 11.2.10 Lengdor
- 11.2.10.1. Overview
- 11.2.10.2. Products
- 11.2.10.3. SWOT Analysis
- 11.2.10.4. Recent Developments
- 11.2.10.5. Financials (Based on Availability)
- 11.2.1 Frito-Lay
List of Figures
- Figure 1: Global Extruded Food Revenue Breakdown (million, %) by Region 2025 & 2033
- Figure 2: Global Extruded Food Volume Breakdown (K, %) by Region 2025 & 2033
- Figure 3: North America Extruded Food Revenue (million), by Application 2025 & 2033
- Figure 4: North America Extruded Food Volume (K), by Application 2025 & 2033
- Figure 5: North America Extruded Food Revenue Share (%), by Application 2025 & 2033
- Figure 6: North America Extruded Food Volume Share (%), by Application 2025 & 2033
- Figure 7: North America Extruded Food Revenue (million), by Type 2025 & 2033
- Figure 8: North America Extruded Food Volume (K), by Type 2025 & 2033
- Figure 9: North America Extruded Food Revenue Share (%), by Type 2025 & 2033
- Figure 10: North America Extruded Food Volume Share (%), by Type 2025 & 2033
- Figure 11: North America Extruded Food Revenue (million), by Country 2025 & 2033
- Figure 12: North America Extruded Food Volume (K), by Country 2025 & 2033
- Figure 13: North America Extruded Food Revenue Share (%), by Country 2025 & 2033
- Figure 14: North America Extruded Food Volume Share (%), by Country 2025 & 2033
- Figure 15: South America Extruded Food Revenue (million), by Application 2025 & 2033
- Figure 16: South America Extruded Food Volume (K), by Application 2025 & 2033
- Figure 17: South America Extruded Food Revenue Share (%), by Application 2025 & 2033
- Figure 18: South America Extruded Food Volume Share (%), by Application 2025 & 2033
- Figure 19: South America Extruded Food Revenue (million), by Type 2025 & 2033
- Figure 20: South America Extruded Food Volume (K), by Type 2025 & 2033
- Figure 21: South America Extruded Food Revenue Share (%), by Type 2025 & 2033
- Figure 22: South America Extruded Food Volume Share (%), by Type 2025 & 2033
- Figure 23: South America Extruded Food Revenue (million), by Country 2025 & 2033
- Figure 24: South America Extruded Food Volume (K), by Country 2025 & 2033
- Figure 25: South America Extruded Food Revenue Share (%), by Country 2025 & 2033
- Figure 26: South America Extruded Food Volume Share (%), by Country 2025 & 2033
- Figure 27: Europe Extruded Food Revenue (million), by Application 2025 & 2033
- Figure 28: Europe Extruded Food Volume (K), by Application 2025 & 2033
- Figure 29: Europe Extruded Food Revenue Share (%), by Application 2025 & 2033
- Figure 30: Europe Extruded Food Volume Share (%), by Application 2025 & 2033
- Figure 31: Europe Extruded Food Revenue (million), by Type 2025 & 2033
- Figure 32: Europe Extruded Food Volume (K), by Type 2025 & 2033
- Figure 33: Europe Extruded Food Revenue Share (%), by Type 2025 & 2033
- Figure 34: Europe Extruded Food Volume Share (%), by Type 2025 & 2033
- Figure 35: Europe Extruded Food Revenue (million), by Country 2025 & 2033
- Figure 36: Europe Extruded Food Volume (K), by Country 2025 & 2033
- Figure 37: Europe Extruded Food Revenue Share (%), by Country 2025 & 2033
- Figure 38: Europe Extruded Food Volume Share (%), by Country 2025 & 2033
- Figure 39: Middle East & Africa Extruded Food Revenue (million), by Application 2025 & 2033
- Figure 40: Middle East & Africa Extruded Food Volume (K), by Application 2025 & 2033
- Figure 41: Middle East & Africa Extruded Food Revenue Share (%), by Application 2025 & 2033
- Figure 42: Middle East & Africa Extruded Food Volume Share (%), by Application 2025 & 2033
- Figure 43: Middle East & Africa Extruded Food Revenue (million), by Type 2025 & 2033
- Figure 44: Middle East & Africa Extruded Food Volume (K), by Type 2025 & 2033
- Figure 45: Middle East & Africa Extruded Food Revenue Share (%), by Type 2025 & 2033
- Figure 46: Middle East & Africa Extruded Food Volume Share (%), by Type 2025 & 2033
- Figure 47: Middle East & Africa Extruded Food Revenue (million), by Country 2025 & 2033
- Figure 48: Middle East & Africa Extruded Food Volume (K), by Country 2025 & 2033
- Figure 49: Middle East & Africa Extruded Food Revenue Share (%), by Country 2025 & 2033
- Figure 50: Middle East & Africa Extruded Food Volume Share (%), by Country 2025 & 2033
- Figure 51: Asia Pacific Extruded Food Revenue (million), by Application 2025 & 2033
- Figure 52: Asia Pacific Extruded Food Volume (K), by Application 2025 & 2033
- Figure 53: Asia Pacific Extruded Food Revenue Share (%), by Application 2025 & 2033
- Figure 54: Asia Pacific Extruded Food Volume Share (%), by Application 2025 & 2033
- Figure 55: Asia Pacific Extruded Food Revenue (million), by Type 2025 & 2033
- Figure 56: Asia Pacific Extruded Food Volume (K), by Type 2025 & 2033
- Figure 57: Asia Pacific Extruded Food Revenue Share (%), by Type 2025 & 2033
- Figure 58: Asia Pacific Extruded Food Volume Share (%), by Type 2025 & 2033
- Figure 59: Asia Pacific Extruded Food Revenue (million), by Country 2025 & 2033
- Figure 60: Asia Pacific Extruded Food Volume (K), by Country 2025 & 2033
- Figure 61: Asia Pacific Extruded Food Revenue Share (%), by Country 2025 & 2033
- Figure 62: Asia Pacific Extruded Food Volume Share (%), by Country 2025 & 2033
List of Tables
- Table 1: Global Extruded Food Revenue million Forecast, by Application 2020 & 2033
- Table 2: Global Extruded Food Volume K Forecast, by Application 2020 & 2033
- Table 3: Global Extruded Food Revenue million Forecast, by Type 2020 & 2033
- Table 4: Global Extruded Food Volume K Forecast, by Type 2020 & 2033
- Table 5: Global Extruded Food Revenue million Forecast, by Region 2020 & 2033
- Table 6: Global Extruded Food Volume K Forecast, by Region 2020 & 2033
- Table 7: Global Extruded Food Revenue million Forecast, by Application 2020 & 2033
- Table 8: Global Extruded Food Volume K Forecast, by Application 2020 & 2033
- Table 9: Global Extruded Food Revenue million Forecast, by Type 2020 & 2033
- Table 10: Global Extruded Food Volume K Forecast, by Type 2020 & 2033
- Table 11: Global Extruded Food Revenue million Forecast, by Country 2020 & 2033
- Table 12: Global Extruded Food Volume K Forecast, by Country 2020 & 2033
- Table 13: United States Extruded Food Revenue (million) Forecast, by Application 2020 & 2033
- Table 14: United States Extruded Food Volume (K) Forecast, by Application 2020 & 2033
- Table 15: Canada Extruded Food Revenue (million) Forecast, by Application 2020 & 2033
- Table 16: Canada Extruded Food Volume (K) Forecast, by Application 2020 & 2033
- Table 17: Mexico Extruded Food Revenue (million) Forecast, by Application 2020 & 2033
- Table 18: Mexico Extruded Food Volume (K) Forecast, by Application 2020 & 2033
- Table 19: Global Extruded Food Revenue million Forecast, by Application 2020 & 2033
- Table 20: Global Extruded Food Volume K Forecast, by Application 2020 & 2033
- Table 21: Global Extruded Food Revenue million Forecast, by Type 2020 & 2033
- Table 22: Global Extruded Food Volume K Forecast, by Type 2020 & 2033
- Table 23: Global Extruded Food Revenue million Forecast, by Country 2020 & 2033
- Table 24: Global Extruded Food Volume K Forecast, by Country 2020 & 2033
- Table 25: Brazil Extruded Food Revenue (million) Forecast, by Application 2020 & 2033
- Table 26: Brazil Extruded Food Volume (K) Forecast, by Application 2020 & 2033
- Table 27: Argentina Extruded Food Revenue (million) Forecast, by Application 2020 & 2033
- Table 28: Argentina Extruded Food Volume (K) Forecast, by Application 2020 & 2033
- Table 29: Rest of South America Extruded Food Revenue (million) Forecast, by Application 2020 & 2033
- Table 30: Rest of South America Extruded Food Volume (K) Forecast, by Application 2020 & 2033
- Table 31: Global Extruded Food Revenue million Forecast, by Application 2020 & 2033
- Table 32: Global Extruded Food Volume K Forecast, by Application 2020 & 2033
- Table 33: Global Extruded Food Revenue million Forecast, by Type 2020 & 2033
- Table 34: Global Extruded Food Volume K Forecast, by Type 2020 & 2033
- Table 35: Global Extruded Food Revenue million Forecast, by Country 2020 & 2033
- Table 36: Global Extruded Food Volume K Forecast, by Country 2020 & 2033
- Table 37: United Kingdom Extruded Food Revenue (million) Forecast, by Application 2020 & 2033
- Table 38: United Kingdom Extruded Food Volume (K) Forecast, by Application 2020 & 2033
- Table 39: Germany Extruded Food Revenue (million) Forecast, by Application 2020 & 2033
- Table 40: Germany Extruded Food Volume (K) Forecast, by Application 2020 & 2033
- Table 41: France Extruded Food Revenue (million) Forecast, by Application 2020 & 2033
- Table 42: France Extruded Food Volume (K) Forecast, by Application 2020 & 2033
- Table 43: Italy Extruded Food Revenue (million) Forecast, by Application 2020 & 2033
- Table 44: Italy Extruded Food Volume (K) Forecast, by Application 2020 & 2033
- Table 45: Spain Extruded Food Revenue (million) Forecast, by Application 2020 & 2033
- Table 46: Spain Extruded Food Volume (K) Forecast, by Application 2020 & 2033
- Table 47: Russia Extruded Food Revenue (million) Forecast, by Application 2020 & 2033
- Table 48: Russia Extruded Food Volume (K) Forecast, by Application 2020 & 2033
- Table 49: Benelux Extruded Food Revenue (million) Forecast, by Application 2020 & 2033
- Table 50: Benelux Extruded Food Volume (K) Forecast, by Application 2020 & 2033
- Table 51: Nordics Extruded Food Revenue (million) Forecast, by Application 2020 & 2033
- Table 52: Nordics Extruded Food Volume (K) Forecast, by Application 2020 & 2033
- Table 53: Rest of Europe Extruded Food Revenue (million) Forecast, by Application 2020 & 2033
- Table 54: Rest of Europe Extruded Food Volume (K) Forecast, by Application 2020 & 2033
- Table 55: Global Extruded Food Revenue million Forecast, by Application 2020 & 2033
- Table 56: Global Extruded Food Volume K Forecast, by Application 2020 & 2033
- Table 57: Global Extruded Food Revenue million Forecast, by Type 2020 & 2033
- Table 58: Global Extruded Food Volume K Forecast, by Type 2020 & 2033
- Table 59: Global Extruded Food Revenue million Forecast, by Country 2020 & 2033
- Table 60: Global Extruded Food Volume K Forecast, by Country 2020 & 2033
- Table 61: Turkey Extruded Food Revenue (million) Forecast, by Application 2020 & 2033
- Table 62: Turkey Extruded Food Volume (K) Forecast, by Application 2020 & 2033
- Table 63: Israel Extruded Food Revenue (million) Forecast, by Application 2020 & 2033
- Table 64: Israel Extruded Food Volume (K) Forecast, by Application 2020 & 2033
- Table 65: GCC Extruded Food Revenue (million) Forecast, by Application 2020 & 2033
- Table 66: GCC Extruded Food Volume (K) Forecast, by Application 2020 & 2033
- Table 67: North Africa Extruded Food Revenue (million) Forecast, by Application 2020 & 2033
- Table 68: North Africa Extruded Food Volume (K) Forecast, by Application 2020 & 2033
- Table 69: South Africa Extruded Food Revenue (million) Forecast, by Application 2020 & 2033
- Table 70: South Africa Extruded Food Volume (K) Forecast, by Application 2020 & 2033
- Table 71: Rest of Middle East & Africa Extruded Food Revenue (million) Forecast, by Application 2020 & 2033
- Table 72: Rest of Middle East & Africa Extruded Food Volume (K) Forecast, by Application 2020 & 2033
- Table 73: Global Extruded Food Revenue million Forecast, by Application 2020 & 2033
- Table 74: Global Extruded Food Volume K Forecast, by Application 2020 & 2033
- Table 75: Global Extruded Food Revenue million Forecast, by Type 2020 & 2033
- Table 76: Global Extruded Food Volume K Forecast, by Type 2020 & 2033
- Table 77: Global Extruded Food Revenue million Forecast, by Country 2020 & 2033
- Table 78: Global Extruded Food Volume K Forecast, by Country 2020 & 2033
- Table 79: China Extruded Food Revenue (million) Forecast, by Application 2020 & 2033
- Table 80: China Extruded Food Volume (K) Forecast, by Application 2020 & 2033
- Table 81: India Extruded Food Revenue (million) Forecast, by Application 2020 & 2033
- Table 82: India Extruded Food Volume (K) Forecast, by Application 2020 & 2033
- Table 83: Japan Extruded Food Revenue (million) Forecast, by Application 2020 & 2033
- Table 84: Japan Extruded Food Volume (K) Forecast, by Application 2020 & 2033
- Table 85: South Korea Extruded Food Revenue (million) Forecast, by Application 2020 & 2033
- Table 86: South Korea Extruded Food Volume (K) Forecast, by Application 2020 & 2033
- Table 87: ASEAN Extruded Food Revenue (million) Forecast, by Application 2020 & 2033
- Table 88: ASEAN Extruded Food Volume (K) Forecast, by Application 2020 & 2033
- Table 89: Oceania Extruded Food Revenue (million) Forecast, by Application 2020 & 2033
- Table 90: Oceania Extruded Food Volume (K) Forecast, by Application 2020 & 2033
- Table 91: Rest of Asia Pacific Extruded Food Revenue (million) Forecast, by Application 2020 & 2033
- Table 92: Rest of Asia Pacific Extruded Food Volume (K) Forecast, by Application 2020 & 2033
Frequently Asked Questions
1. What is the projected Compound Annual Growth Rate (CAGR) of the Extruded Food?
The projected CAGR is approximately 4.3%.
2. Which companies are prominent players in the Extruded Food?
Key companies in the market include Frito-Lay, Real Deal Snacks, Bag Snacks, Michel, Calbee, Kelloggs, Nature's Path, Ralston Foods, Intersnack, Lengdor.
3. What are the main segments of the Extruded Food?
The market segments include Application, Type.
4. Can you provide details about the market size?
The market size is estimated to be USD 87120 million as of 2022.
5. What are some drivers contributing to market growth?
N/A
6. What are the notable trends driving market growth?
N/A
7. Are there any restraints impacting market growth?
N/A
8. Can you provide examples of recent developments in the market?
N/A
9. What pricing options are available for accessing the report?
Pricing options include single-user, multi-user, and enterprise licenses priced at USD 3950.00, USD 5925.00, and USD 7900.00 respectively.
10. Is the market size provided in terms of value or volume?
The market size is provided in terms of value, measured in million and volume, measured in K.
11. Are there any specific market keywords associated with the report?
Yes, the market keyword associated with the report is "Extruded Food," which aids in identifying and referencing the specific market segment covered.
12. How do I determine which pricing option suits my needs best?
The pricing options vary based on user requirements and access needs. Individual users may opt for single-user licenses, while businesses requiring broader access may choose multi-user or enterprise licenses for cost-effective access to the report.
13. Are there any additional resources or data provided in the Extruded Food report?
While the report offers comprehensive insights, it's advisable to review the specific contents or supplementary materials provided to ascertain if additional resources or data are available.
14. How can I stay updated on further developments or reports in the Extruded Food?
To stay informed about further developments, trends, and reports in the Extruded Food, consider subscribing to industry newsletters, following relevant companies and organizations, or regularly checking reputable industry news sources and publications.
Methodology
Step 1 - Identification of Relevant Samples Size from Population Database


Step 2 - Approaches for Defining Global Market Size (Value, Volume* & Price*)

Note*: In applicable scenarios
Step 3 - Data Sources
Primary Research
- Web Analytics
- Survey Reports
- Research Institute
- Latest Research Reports
- Opinion Leaders
Secondary Research
- Annual Reports
- White Paper
- Latest Press Release
- Industry Association
- Paid Database
- Investor Presentations

Step 4 - Data Triangulation
Involves using different sources of information in order to increase the validity of a study
These sources are likely to be stakeholders in a program - participants, other researchers, program staff, other community members, and so on.
Then we put all data in single framework & apply various statistical tools to find out the dynamic on the market.
During the analysis stage, feedback from the stakeholder groups would be compared to determine areas of agreement as well as areas of divergence