

Key Insights
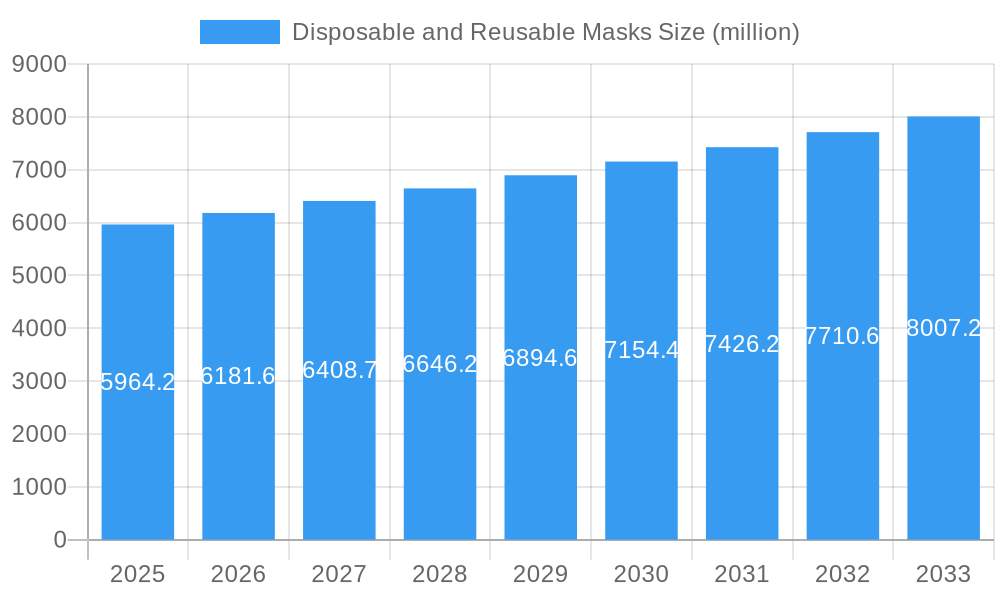
The global disposable and reusable masks market, valued at $5,964.2 million in 2025, is projected to experience steady growth with a Compound Annual Growth Rate (CAGR) of 3.6% from 2025 to 2033. This growth is driven by several factors. The enduring impact of the COVID-19 pandemic has heightened awareness of respiratory health and hygiene, leading to increased demand for both disposable and reusable masks, particularly in healthcare settings and for personal protection. Furthermore, increasing air pollution in urban areas contributes to a larger market for face masks as a protective measure. The market is segmented by application (industrial, medical, daily use) and type (disposable, reusable). The disposable mask segment currently holds a larger market share due to its convenience and affordability, though the reusable segment is expected to see growth driven by environmental concerns and cost savings over the long term. Government regulations promoting mask usage in specific environments further fuel market expansion, while economic fluctuations and the emergence of alternative respiratory protection methods could present potential restraints. Growth will vary across regions, with North America and Asia Pacific expected to be key market drivers due to high population density, robust healthcare infrastructure, and established manufacturing bases.
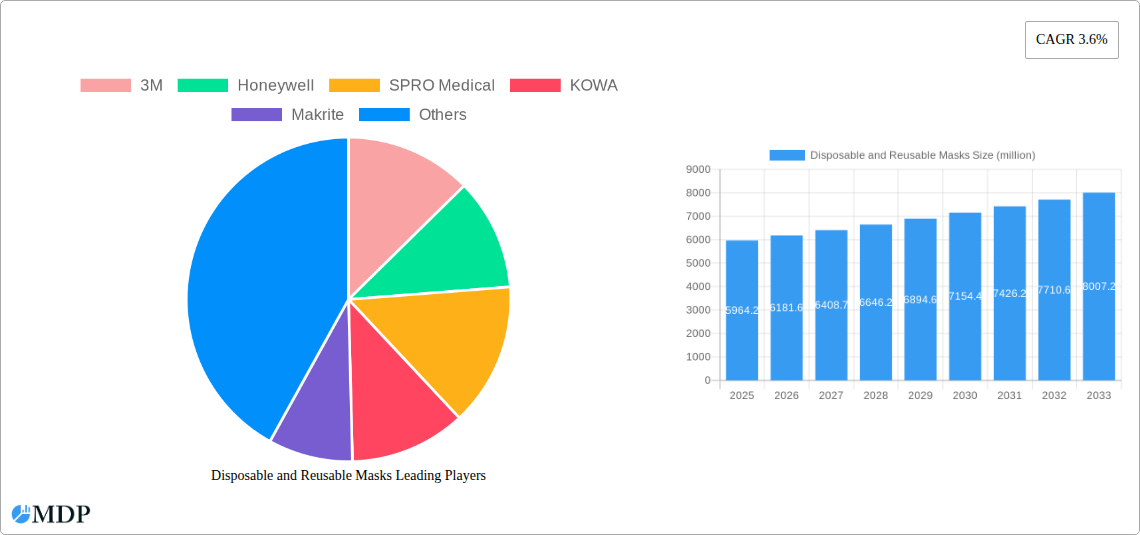
Disposable and Reusable Masks Market Size (In Billion)
The competitive landscape is populated by a mix of established multinational corporations like 3M and Honeywell, alongside smaller regional players. These companies are engaged in strategic initiatives including product innovation (e.g., developing advanced filtration technologies, incorporating sustainable materials), expansion into new markets, and mergers and acquisitions to strengthen their market position. Despite the post-pandemic market normalization, the market shows sustained growth reflecting the long-term significance of respiratory protection in multiple sectors. Factors like technological advancements in mask design (enhanced breathability, comfort), the rise of specialized masks (e.g., N95 masks for high-risk environments), and increasing demand from emerging economies will continue shaping the market trajectory. Analyzing regional variations in growth rates and regulatory landscapes will be crucial for market participants to optimize their strategies for success.
Disposable and Reusable Masks Company Market Share
Disposable and Reusable Masks Market Report: 2019-2033
This comprehensive report provides an in-depth analysis of the global disposable and reusable masks market, covering the period 2019-2033. With a focus on key market dynamics, leading players, and future trends, this report is an invaluable resource for industry stakeholders, investors, and market researchers seeking actionable insights. The report analyzes a market valued at millions, with a projected CAGR of xx% during the forecast period (2025-2033). The base year for this analysis is 2025, with historical data from 2019-2024.
Disposable and Reusable Masks Market Dynamics & Concentration
The global disposable and reusable masks market is characterized by a moderately concentrated landscape, with key players such as 3M, Honeywell, and Kimberly-Clark holding significant market share. However, the presence of numerous smaller players, especially in the manufacturing of disposable masks, contributes to competition. Market share is constantly fluctuating due to innovation, acquisitions, and shifts in demand driven by factors like pandemics and heightened public health concerns. The market concentration ratio (CRx) for the top xx players in 2025 is estimated at xx%.
- Innovation Drivers: Technological advancements in filtration technology, material science, and design are driving product differentiation and market expansion. The development of advanced filtration materials, such as N95 and KN95 masks, has significantly impacted market growth.
- Regulatory Frameworks: Stringent regulatory requirements regarding mask efficacy and safety standards vary across regions, impacting market access and competitiveness. Compliance costs vary depending on the regulatory landscape and add complexity to the market.
- Product Substitutes: While alternatives exist (e.g., face shields), masks remain the dominant personal protective equipment (PPE) for respiratory protection. The effectiveness of substitutes is largely dependent on the context of use, presenting a limited threat to market dominance.
- End-User Trends: Increased awareness of respiratory health and hygiene, coupled with recurrent outbreaks of infectious diseases, has fueled consistent demand, particularly for disposable masks. The post-pandemic shift towards heightened personal protective measures continues to support market growth.
- M&A Activities: The number of mergers and acquisitions (M&A) within the industry during 2019-2024 totaled approximately xx deals, mostly focusing on expanding production capacity and technological capabilities. Consolidation is expected to continue at a moderate pace, influencing the industry's concentration over the next decade.
Disposable and Reusable Masks Industry Trends & Analysis
The disposable and reusable masks market has witnessed significant growth over the past few years, predominantly driven by increased health awareness and the impact of global pandemics. The market exhibits a complex interplay of factors, including technological advancements, evolving consumer preferences, and intense competition. The market experienced a substantial surge during the COVID-19 pandemic and continues to grow at a steady pace due to heightened hygiene awareness. This industry trend analysis reveals a compounded annual growth rate (CAGR) of xx% from 2019 to 2024, projected to be xx% from 2025 to 2033. Market penetration for disposable masks is significantly higher compared to reusable masks, primarily due to convenience and perceived hygiene benefits.
Technological disruptions have introduced innovative materials, advanced filtration technologies, and improved designs, expanding the market for both disposable and reusable masks. Consumer preferences increasingly favor comfortable, durable, and eco-friendly options, with a growing demand for reusable masks that meet stringent filtration standards. The competitive landscape is marked by several key players competing on price, quality, and product features.
Leading Markets & Segments in Disposable and Reusable Masks
The Asia-Pacific region is projected to remain the dominant market segment throughout the forecast period. China and India are key countries within the region driving market growth. The high population density, increasing healthcare expenditure, and rising disposable incomes in these regions contribute significantly to demand.
Key Drivers:
- Economic Policies: Government initiatives promoting public health and industrial safety drive demand for masks, especially in emerging economies.
- Infrastructure: Well-established healthcare infrastructure, coupled with expanding industrial sectors, boosts demand across various segments.
- Stringent Health Regulations: Policies enforcing mask usage in public spaces significantly contribute to increased sales.
Dominance Analysis:
The medical use segment holds the largest market share due to the substantial demand from hospitals, healthcare facilities, and medical professionals. Disposable masks dominate the market, accounting for a larger share, despite the growing interest in reusable alternatives.
- Application: Medical use continues to be the leading application segment, followed by industrial use and daily use.
- Type: Disposable masks maintain their dominance, owing to cost-effectiveness and ease of use. However, the reusable mask segment is experiencing steady growth due to environmental concerns and long-term cost savings.
Disposable and Reusable Masks Product Developments
Recent innovations focus on improved filtration efficiency, enhanced breathability, and the incorporation of antimicrobial agents. The development of comfortable, lightweight, and reusable masks with effective filtration capabilities is gaining traction. Companies are focusing on sustainable materials and designs to cater to growing environmental concerns. The integration of smart technologies, such as sensors for monitoring air quality, is still emerging but holds potential for future growth.
Key Drivers of Disposable and Reusable Masks Growth
Several factors contribute to the market's growth. Technological advancements continuously improve filtration efficiency and user comfort. Economic growth in developing nations fuels increased disposable income, driving demand, particularly for disposable masks. Stringent government regulations regarding personal protective equipment and public health initiatives underpin market expansion. The ongoing concern about respiratory infections and emerging infectious diseases is a significant driver of growth.
Challenges in the Disposable and Reusable Masks Market
The market faces challenges such as fluctuations in raw material prices, impacting manufacturing costs and profitability. Supply chain disruptions can lead to shortages and price volatility. Intense competition among numerous market players, especially in the disposable mask sector, creates pressure on pricing and margins. Stringent regulatory requirements and compliance costs add complexity to operations.
Emerging Opportunities in Disposable and Reusable Masks
The market presents opportunities for growth through technological advancements focusing on improved filtration technologies, sustainable materials, and enhanced comfort. Strategic partnerships and collaborations between manufacturers and healthcare providers can enhance market penetration. Expansion into new markets, particularly in developing countries with expanding healthcare infrastructure, promises considerable growth potential.
Leading Players in the Disposable and Reusable Masks Sector
- 3M
- Honeywell
- SPRO Medical
- KOWA
- Makrite
- Owens & Minor
- Uvex
- Kimberly-Clark
- McKesson
- Prestige Ameritech
- CM
- Molnlycke Health
- Moldex-Metric
- Ansell
- Unicharm
- Cardinal Health
- Te Yin
- Japan Vilene
- Shanghai Dasheng
- Hakugen
- Essity (BSN Medical)
- Zhende
- Winner
- Jiangyin Chang-hung
- Tamagawa Eizai
- Gerson
- Suzhou Sanical
- Sinotextiles
- Alpha Pro Tech
- Irema
Key Milestones in Disposable and Reusable Masks Industry
- 2020: Significant surge in demand due to the COVID-19 pandemic. Many manufacturers rapidly scaled up production.
- 2021: Increased focus on reusable mask innovation and sustainability.
- 2022: Market stabilization, with a shift towards improved quality and advanced filtration technologies.
- 2023: Continued growth in the medical and industrial segments. Several M&A activities consolidate the market.
- 2024: Emerging trends include the incorporation of smart technologies and personalized mask designs.
Strategic Outlook for Disposable and Reusable Masks Market
The disposable and reusable masks market is expected to experience continued growth driven by ongoing health concerns, technological innovations, and the expansion of healthcare infrastructure globally. Strategic opportunities exist in developing sustainable and technologically advanced products, focusing on eco-friendly materials, smart features, and improved comfort. Strategic partnerships, market diversification, and investment in research and development will be crucial for achieving long-term success in this dynamic market.
Disposable and Reusable Masks Segmentation
-
1. Application
- 1.1. Industrial Use
- 1.2. Medical Use
- 1.3. Daily Use
-
2. Types
- 2.1. Disposable Masks
- 2.2. Reusable Masks
Disposable and Reusable Masks Segmentation By Geography
-
1. North America
- 1.1. United States
- 1.2. Canada
- 1.3. Mexico
-
2. South America
- 2.1. Brazil
- 2.2. Argentina
- 2.3. Rest of South America
-
3. Europe
- 3.1. United Kingdom
- 3.2. Germany
- 3.3. France
- 3.4. Italy
- 3.5. Spain
- 3.6. Russia
- 3.7. Benelux
- 3.8. Nordics
- 3.9. Rest of Europe
-
4. Middle East & Africa
- 4.1. Turkey
- 4.2. Israel
- 4.3. GCC
- 4.4. North Africa
- 4.5. South Africa
- 4.6. Rest of Middle East & Africa
-
5. Asia Pacific
- 5.1. China
- 5.2. India
- 5.3. Japan
- 5.4. South Korea
- 5.5. ASEAN
- 5.6. Oceania
- 5.7. Rest of Asia Pacific
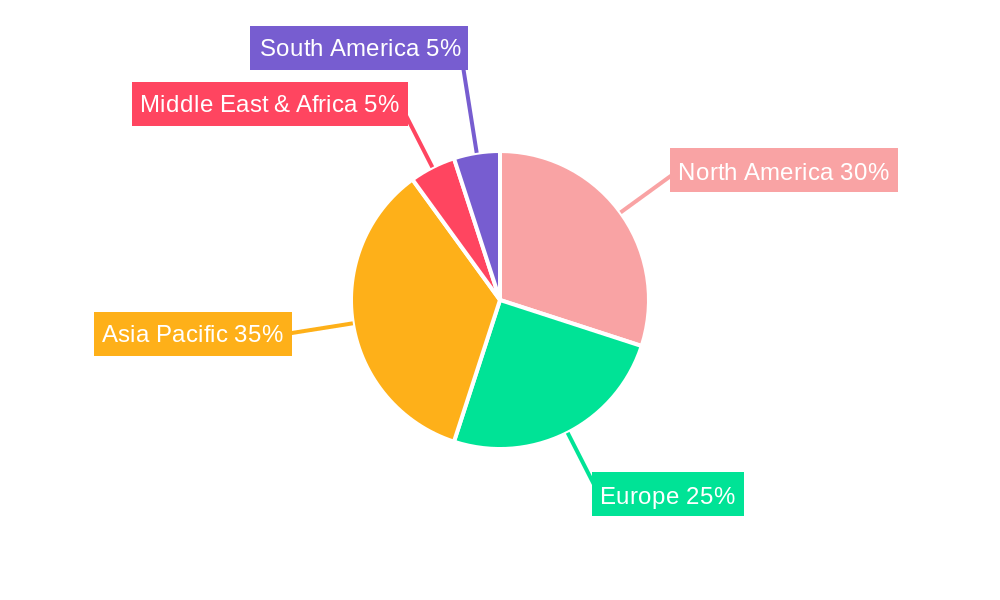
Disposable and Reusable Masks Regional Market Share
Geographic Coverage of Disposable and Reusable Masks
Disposable and Reusable Masks REPORT HIGHLIGHTS
| Aspects | Details |
|---|---|
| Study Period | 2020-2034 |
| Base Year | 2025 |
| Estimated Year | 2026 |
| Forecast Period | 2026-2034 |
| Historical Period | 2020-2025 |
| Growth Rate | CAGR of 3.6% from 2020-2034 |
| Segmentation |
|
Table of Contents
- 1. Introduction
- 1.1. Research Scope
- 1.2. Market Segmentation
- 1.3. Research Methodology
- 1.4. Definitions and Assumptions
- 2. Executive Summary
- 2.1. Introduction
- 3. Market Dynamics
- 3.1. Introduction
- 3.2. Market Drivers
- 3.3. Market Restrains
- 3.4. Market Trends
- 4. Market Factor Analysis
- 4.1. Porters Five Forces
- 4.2. Supply/Value Chain
- 4.3. PESTEL analysis
- 4.4. Market Entropy
- 4.5. Patent/Trademark Analysis
- 5. Global Disposable and Reusable Masks Analysis, Insights and Forecast, 2020-2032
- 5.1. Market Analysis, Insights and Forecast - by Application
- 5.1.1. Industrial Use
- 5.1.2. Medical Use
- 5.1.3. Daily Use
- 5.2. Market Analysis, Insights and Forecast - by Types
- 5.2.1. Disposable Masks
- 5.2.2. Reusable Masks
- 5.3. Market Analysis, Insights and Forecast - by Region
- 5.3.1. North America
- 5.3.2. South America
- 5.3.3. Europe
- 5.3.4. Middle East & Africa
- 5.3.5. Asia Pacific
- 5.1. Market Analysis, Insights and Forecast - by Application
- 6. North America Disposable and Reusable Masks Analysis, Insights and Forecast, 2020-2032
- 6.1. Market Analysis, Insights and Forecast - by Application
- 6.1.1. Industrial Use
- 6.1.2. Medical Use
- 6.1.3. Daily Use
- 6.2. Market Analysis, Insights and Forecast - by Types
- 6.2.1. Disposable Masks
- 6.2.2. Reusable Masks
- 6.1. Market Analysis, Insights and Forecast - by Application
- 7. South America Disposable and Reusable Masks Analysis, Insights and Forecast, 2020-2032
- 7.1. Market Analysis, Insights and Forecast - by Application
- 7.1.1. Industrial Use
- 7.1.2. Medical Use
- 7.1.3. Daily Use
- 7.2. Market Analysis, Insights and Forecast - by Types
- 7.2.1. Disposable Masks
- 7.2.2. Reusable Masks
- 7.1. Market Analysis, Insights and Forecast - by Application
- 8. Europe Disposable and Reusable Masks Analysis, Insights and Forecast, 2020-2032
- 8.1. Market Analysis, Insights and Forecast - by Application
- 8.1.1. Industrial Use
- 8.1.2. Medical Use
- 8.1.3. Daily Use
- 8.2. Market Analysis, Insights and Forecast - by Types
- 8.2.1. Disposable Masks
- 8.2.2. Reusable Masks
- 8.1. Market Analysis, Insights and Forecast - by Application
- 9. Middle East & Africa Disposable and Reusable Masks Analysis, Insights and Forecast, 2020-2032
- 9.1. Market Analysis, Insights and Forecast - by Application
- 9.1.1. Industrial Use
- 9.1.2. Medical Use
- 9.1.3. Daily Use
- 9.2. Market Analysis, Insights and Forecast - by Types
- 9.2.1. Disposable Masks
- 9.2.2. Reusable Masks
- 9.1. Market Analysis, Insights and Forecast - by Application
- 10. Asia Pacific Disposable and Reusable Masks Analysis, Insights and Forecast, 2020-2032
- 10.1. Market Analysis, Insights and Forecast - by Application
- 10.1.1. Industrial Use
- 10.1.2. Medical Use
- 10.1.3. Daily Use
- 10.2. Market Analysis, Insights and Forecast - by Types
- 10.2.1. Disposable Masks
- 10.2.2. Reusable Masks
- 10.1. Market Analysis, Insights and Forecast - by Application
- 11. Competitive Analysis
- 11.1. Global Market Share Analysis 2025
- 11.2. Company Profiles
- 11.2.1 3M
- 11.2.1.1. Overview
- 11.2.1.2. Products
- 11.2.1.3. SWOT Analysis
- 11.2.1.4. Recent Developments
- 11.2.1.5. Financials (Based on Availability)
- 11.2.2 Honeywell
- 11.2.2.1. Overview
- 11.2.2.2. Products
- 11.2.2.3. SWOT Analysis
- 11.2.2.4. Recent Developments
- 11.2.2.5. Financials (Based on Availability)
- 11.2.3 SPRO Medical
- 11.2.3.1. Overview
- 11.2.3.2. Products
- 11.2.3.3. SWOT Analysis
- 11.2.3.4. Recent Developments
- 11.2.3.5. Financials (Based on Availability)
- 11.2.4 KOWA
- 11.2.4.1. Overview
- 11.2.4.2. Products
- 11.2.4.3. SWOT Analysis
- 11.2.4.4. Recent Developments
- 11.2.4.5. Financials (Based on Availability)
- 11.2.5 Makrite
- 11.2.5.1. Overview
- 11.2.5.2. Products
- 11.2.5.3. SWOT Analysis
- 11.2.5.4. Recent Developments
- 11.2.5.5. Financials (Based on Availability)
- 11.2.6 Owens & Minor
- 11.2.6.1. Overview
- 11.2.6.2. Products
- 11.2.6.3. SWOT Analysis
- 11.2.6.4. Recent Developments
- 11.2.6.5. Financials (Based on Availability)
- 11.2.7 Uvex
- 11.2.7.1. Overview
- 11.2.7.2. Products
- 11.2.7.3. SWOT Analysis
- 11.2.7.4. Recent Developments
- 11.2.7.5. Financials (Based on Availability)
- 11.2.8 Kimberly-clark
- 11.2.8.1. Overview
- 11.2.8.2. Products
- 11.2.8.3. SWOT Analysis
- 11.2.8.4. Recent Developments
- 11.2.8.5. Financials (Based on Availability)
- 11.2.9 McKesson
- 11.2.9.1. Overview
- 11.2.9.2. Products
- 11.2.9.3. SWOT Analysis
- 11.2.9.4. Recent Developments
- 11.2.9.5. Financials (Based on Availability)
- 11.2.10 Prestige Ameritech
- 11.2.10.1. Overview
- 11.2.10.2. Products
- 11.2.10.3. SWOT Analysis
- 11.2.10.4. Recent Developments
- 11.2.10.5. Financials (Based on Availability)
- 11.2.11 CM
- 11.2.11.1. Overview
- 11.2.11.2. Products
- 11.2.11.3. SWOT Analysis
- 11.2.11.4. Recent Developments
- 11.2.11.5. Financials (Based on Availability)
- 11.2.12 Molnlycke Health
- 11.2.12.1. Overview
- 11.2.12.2. Products
- 11.2.12.3. SWOT Analysis
- 11.2.12.4. Recent Developments
- 11.2.12.5. Financials (Based on Availability)
- 11.2.13 Moldex-Metric
- 11.2.13.1. Overview
- 11.2.13.2. Products
- 11.2.13.3. SWOT Analysis
- 11.2.13.4. Recent Developments
- 11.2.13.5. Financials (Based on Availability)
- 11.2.14 Ansell
- 11.2.14.1. Overview
- 11.2.14.2. Products
- 11.2.14.3. SWOT Analysis
- 11.2.14.4. Recent Developments
- 11.2.14.5. Financials (Based on Availability)
- 11.2.15 Unicharm
- 11.2.15.1. Overview
- 11.2.15.2. Products
- 11.2.15.3. SWOT Analysis
- 11.2.15.4. Recent Developments
- 11.2.15.5. Financials (Based on Availability)
- 11.2.16 Cardinal Health
- 11.2.16.1. Overview
- 11.2.16.2. Products
- 11.2.16.3. SWOT Analysis
- 11.2.16.4. Recent Developments
- 11.2.16.5. Financials (Based on Availability)
- 11.2.17 Te Yin
- 11.2.17.1. Overview
- 11.2.17.2. Products
- 11.2.17.3. SWOT Analysis
- 11.2.17.4. Recent Developments
- 11.2.17.5. Financials (Based on Availability)
- 11.2.18 Japan Vilene
- 11.2.18.1. Overview
- 11.2.18.2. Products
- 11.2.18.3. SWOT Analysis
- 11.2.18.4. Recent Developments
- 11.2.18.5. Financials (Based on Availability)
- 11.2.19 Shanghai Dasheng
- 11.2.19.1. Overview
- 11.2.19.2. Products
- 11.2.19.3. SWOT Analysis
- 11.2.19.4. Recent Developments
- 11.2.19.5. Financials (Based on Availability)
- 11.2.20 Hakugen
- 11.2.20.1. Overview
- 11.2.20.2. Products
- 11.2.20.3. SWOT Analysis
- 11.2.20.4. Recent Developments
- 11.2.20.5. Financials (Based on Availability)
- 11.2.21 Essity (BSN Medical)
- 11.2.21.1. Overview
- 11.2.21.2. Products
- 11.2.21.3. SWOT Analysis
- 11.2.21.4. Recent Developments
- 11.2.21.5. Financials (Based on Availability)
- 11.2.22 Zhende
- 11.2.22.1. Overview
- 11.2.22.2. Products
- 11.2.22.3. SWOT Analysis
- 11.2.22.4. Recent Developments
- 11.2.22.5. Financials (Based on Availability)
- 11.2.23 Winner
- 11.2.23.1. Overview
- 11.2.23.2. Products
- 11.2.23.3. SWOT Analysis
- 11.2.23.4. Recent Developments
- 11.2.23.5. Financials (Based on Availability)
- 11.2.24 Jiangyin Chang-hung
- 11.2.24.1. Overview
- 11.2.24.2. Products
- 11.2.24.3. SWOT Analysis
- 11.2.24.4. Recent Developments
- 11.2.24.5. Financials (Based on Availability)
- 11.2.25 Tamagawa Eizai
- 11.2.25.1. Overview
- 11.2.25.2. Products
- 11.2.25.3. SWOT Analysis
- 11.2.25.4. Recent Developments
- 11.2.25.5. Financials (Based on Availability)
- 11.2.26 Gerson
- 11.2.26.1. Overview
- 11.2.26.2. Products
- 11.2.26.3. SWOT Analysis
- 11.2.26.4. Recent Developments
- 11.2.26.5. Financials (Based on Availability)
- 11.2.27 Suzhou Sanical
- 11.2.27.1. Overview
- 11.2.27.2. Products
- 11.2.27.3. SWOT Analysis
- 11.2.27.4. Recent Developments
- 11.2.27.5. Financials (Based on Availability)
- 11.2.28 Sinotextiles
- 11.2.28.1. Overview
- 11.2.28.2. Products
- 11.2.28.3. SWOT Analysis
- 11.2.28.4. Recent Developments
- 11.2.28.5. Financials (Based on Availability)
- 11.2.29 Alpha Pro Tech
- 11.2.29.1. Overview
- 11.2.29.2. Products
- 11.2.29.3. SWOT Analysis
- 11.2.29.4. Recent Developments
- 11.2.29.5. Financials (Based on Availability)
- 11.2.30 Irema
- 11.2.30.1. Overview
- 11.2.30.2. Products
- 11.2.30.3. SWOT Analysis
- 11.2.30.4. Recent Developments
- 11.2.30.5. Financials (Based on Availability)
- 11.2.1 3M
List of Figures
- Figure 1: Global Disposable and Reusable Masks Revenue Breakdown (million, %) by Region 2025 & 2033
- Figure 2: Global Disposable and Reusable Masks Volume Breakdown (K, %) by Region 2025 & 2033
- Figure 3: North America Disposable and Reusable Masks Revenue (million), by Application 2025 & 2033
- Figure 4: North America Disposable and Reusable Masks Volume (K), by Application 2025 & 2033
- Figure 5: North America Disposable and Reusable Masks Revenue Share (%), by Application 2025 & 2033
- Figure 6: North America Disposable and Reusable Masks Volume Share (%), by Application 2025 & 2033
- Figure 7: North America Disposable and Reusable Masks Revenue (million), by Types 2025 & 2033
- Figure 8: North America Disposable and Reusable Masks Volume (K), by Types 2025 & 2033
- Figure 9: North America Disposable and Reusable Masks Revenue Share (%), by Types 2025 & 2033
- Figure 10: North America Disposable and Reusable Masks Volume Share (%), by Types 2025 & 2033
- Figure 11: North America Disposable and Reusable Masks Revenue (million), by Country 2025 & 2033
- Figure 12: North America Disposable and Reusable Masks Volume (K), by Country 2025 & 2033
- Figure 13: North America Disposable and Reusable Masks Revenue Share (%), by Country 2025 & 2033
- Figure 14: North America Disposable and Reusable Masks Volume Share (%), by Country 2025 & 2033
- Figure 15: South America Disposable and Reusable Masks Revenue (million), by Application 2025 & 2033
- Figure 16: South America Disposable and Reusable Masks Volume (K), by Application 2025 & 2033
- Figure 17: South America Disposable and Reusable Masks Revenue Share (%), by Application 2025 & 2033
- Figure 18: South America Disposable and Reusable Masks Volume Share (%), by Application 2025 & 2033
- Figure 19: South America Disposable and Reusable Masks Revenue (million), by Types 2025 & 2033
- Figure 20: South America Disposable and Reusable Masks Volume (K), by Types 2025 & 2033
- Figure 21: South America Disposable and Reusable Masks Revenue Share (%), by Types 2025 & 2033
- Figure 22: South America Disposable and Reusable Masks Volume Share (%), by Types 2025 & 2033
- Figure 23: South America Disposable and Reusable Masks Revenue (million), by Country 2025 & 2033
- Figure 24: South America Disposable and Reusable Masks Volume (K), by Country 2025 & 2033
- Figure 25: South America Disposable and Reusable Masks Revenue Share (%), by Country 2025 & 2033
- Figure 26: South America Disposable and Reusable Masks Volume Share (%), by Country 2025 & 2033
- Figure 27: Europe Disposable and Reusable Masks Revenue (million), by Application 2025 & 2033
- Figure 28: Europe Disposable and Reusable Masks Volume (K), by Application 2025 & 2033
- Figure 29: Europe Disposable and Reusable Masks Revenue Share (%), by Application 2025 & 2033
- Figure 30: Europe Disposable and Reusable Masks Volume Share (%), by Application 2025 & 2033
- Figure 31: Europe Disposable and Reusable Masks Revenue (million), by Types 2025 & 2033
- Figure 32: Europe Disposable and Reusable Masks Volume (K), by Types 2025 & 2033
- Figure 33: Europe Disposable and Reusable Masks Revenue Share (%), by Types 2025 & 2033
- Figure 34: Europe Disposable and Reusable Masks Volume Share (%), by Types 2025 & 2033
- Figure 35: Europe Disposable and Reusable Masks Revenue (million), by Country 2025 & 2033
- Figure 36: Europe Disposable and Reusable Masks Volume (K), by Country 2025 & 2033
- Figure 37: Europe Disposable and Reusable Masks Revenue Share (%), by Country 2025 & 2033
- Figure 38: Europe Disposable and Reusable Masks Volume Share (%), by Country 2025 & 2033
- Figure 39: Middle East & Africa Disposable and Reusable Masks Revenue (million), by Application 2025 & 2033
- Figure 40: Middle East & Africa Disposable and Reusable Masks Volume (K), by Application 2025 & 2033
- Figure 41: Middle East & Africa Disposable and Reusable Masks Revenue Share (%), by Application 2025 & 2033
- Figure 42: Middle East & Africa Disposable and Reusable Masks Volume Share (%), by Application 2025 & 2033
- Figure 43: Middle East & Africa Disposable and Reusable Masks Revenue (million), by Types 2025 & 2033
- Figure 44: Middle East & Africa Disposable and Reusable Masks Volume (K), by Types 2025 & 2033
- Figure 45: Middle East & Africa Disposable and Reusable Masks Revenue Share (%), by Types 2025 & 2033
- Figure 46: Middle East & Africa Disposable and Reusable Masks Volume Share (%), by Types 2025 & 2033
- Figure 47: Middle East & Africa Disposable and Reusable Masks Revenue (million), by Country 2025 & 2033
- Figure 48: Middle East & Africa Disposable and Reusable Masks Volume (K), by Country 2025 & 2033
- Figure 49: Middle East & Africa Disposable and Reusable Masks Revenue Share (%), by Country 2025 & 2033
- Figure 50: Middle East & Africa Disposable and Reusable Masks Volume Share (%), by Country 2025 & 2033
- Figure 51: Asia Pacific Disposable and Reusable Masks Revenue (million), by Application 2025 & 2033
- Figure 52: Asia Pacific Disposable and Reusable Masks Volume (K), by Application 2025 & 2033
- Figure 53: Asia Pacific Disposable and Reusable Masks Revenue Share (%), by Application 2025 & 2033
- Figure 54: Asia Pacific Disposable and Reusable Masks Volume Share (%), by Application 2025 & 2033
- Figure 55: Asia Pacific Disposable and Reusable Masks Revenue (million), by Types 2025 & 2033
- Figure 56: Asia Pacific Disposable and Reusable Masks Volume (K), by Types 2025 & 2033
- Figure 57: Asia Pacific Disposable and Reusable Masks Revenue Share (%), by Types 2025 & 2033
- Figure 58: Asia Pacific Disposable and Reusable Masks Volume Share (%), by Types 2025 & 2033
- Figure 59: Asia Pacific Disposable and Reusable Masks Revenue (million), by Country 2025 & 2033
- Figure 60: Asia Pacific Disposable and Reusable Masks Volume (K), by Country 2025 & 2033
- Figure 61: Asia Pacific Disposable and Reusable Masks Revenue Share (%), by Country 2025 & 2033
- Figure 62: Asia Pacific Disposable and Reusable Masks Volume Share (%), by Country 2025 & 2033
List of Tables
- Table 1: Global Disposable and Reusable Masks Revenue million Forecast, by Application 2020 & 2033
- Table 2: Global Disposable and Reusable Masks Volume K Forecast, by Application 2020 & 2033
- Table 3: Global Disposable and Reusable Masks Revenue million Forecast, by Types 2020 & 2033
- Table 4: Global Disposable and Reusable Masks Volume K Forecast, by Types 2020 & 2033
- Table 5: Global Disposable and Reusable Masks Revenue million Forecast, by Region 2020 & 2033
- Table 6: Global Disposable and Reusable Masks Volume K Forecast, by Region 2020 & 2033
- Table 7: Global Disposable and Reusable Masks Revenue million Forecast, by Application 2020 & 2033
- Table 8: Global Disposable and Reusable Masks Volume K Forecast, by Application 2020 & 2033
- Table 9: Global Disposable and Reusable Masks Revenue million Forecast, by Types 2020 & 2033
- Table 10: Global Disposable and Reusable Masks Volume K Forecast, by Types 2020 & 2033
- Table 11: Global Disposable and Reusable Masks Revenue million Forecast, by Country 2020 & 2033
- Table 12: Global Disposable and Reusable Masks Volume K Forecast, by Country 2020 & 2033
- Table 13: United States Disposable and Reusable Masks Revenue (million) Forecast, by Application 2020 & 2033
- Table 14: United States Disposable and Reusable Masks Volume (K) Forecast, by Application 2020 & 2033
- Table 15: Canada Disposable and Reusable Masks Revenue (million) Forecast, by Application 2020 & 2033
- Table 16: Canada Disposable and Reusable Masks Volume (K) Forecast, by Application 2020 & 2033
- Table 17: Mexico Disposable and Reusable Masks Revenue (million) Forecast, by Application 2020 & 2033
- Table 18: Mexico Disposable and Reusable Masks Volume (K) Forecast, by Application 2020 & 2033
- Table 19: Global Disposable and Reusable Masks Revenue million Forecast, by Application 2020 & 2033
- Table 20: Global Disposable and Reusable Masks Volume K Forecast, by Application 2020 & 2033
- Table 21: Global Disposable and Reusable Masks Revenue million Forecast, by Types 2020 & 2033
- Table 22: Global Disposable and Reusable Masks Volume K Forecast, by Types 2020 & 2033
- Table 23: Global Disposable and Reusable Masks Revenue million Forecast, by Country 2020 & 2033
- Table 24: Global Disposable and Reusable Masks Volume K Forecast, by Country 2020 & 2033
- Table 25: Brazil Disposable and Reusable Masks Revenue (million) Forecast, by Application 2020 & 2033
- Table 26: Brazil Disposable and Reusable Masks Volume (K) Forecast, by Application 2020 & 2033
- Table 27: Argentina Disposable and Reusable Masks Revenue (million) Forecast, by Application 2020 & 2033
- Table 28: Argentina Disposable and Reusable Masks Volume (K) Forecast, by Application 2020 & 2033
- Table 29: Rest of South America Disposable and Reusable Masks Revenue (million) Forecast, by Application 2020 & 2033
- Table 30: Rest of South America Disposable and Reusable Masks Volume (K) Forecast, by Application 2020 & 2033
- Table 31: Global Disposable and Reusable Masks Revenue million Forecast, by Application 2020 & 2033
- Table 32: Global Disposable and Reusable Masks Volume K Forecast, by Application 2020 & 2033
- Table 33: Global Disposable and Reusable Masks Revenue million Forecast, by Types 2020 & 2033
- Table 34: Global Disposable and Reusable Masks Volume K Forecast, by Types 2020 & 2033
- Table 35: Global Disposable and Reusable Masks Revenue million Forecast, by Country 2020 & 2033
- Table 36: Global Disposable and Reusable Masks Volume K Forecast, by Country 2020 & 2033
- Table 37: United Kingdom Disposable and Reusable Masks Revenue (million) Forecast, by Application 2020 & 2033
- Table 38: United Kingdom Disposable and Reusable Masks Volume (K) Forecast, by Application 2020 & 2033
- Table 39: Germany Disposable and Reusable Masks Revenue (million) Forecast, by Application 2020 & 2033
- Table 40: Germany Disposable and Reusable Masks Volume (K) Forecast, by Application 2020 & 2033
- Table 41: France Disposable and Reusable Masks Revenue (million) Forecast, by Application 2020 & 2033
- Table 42: France Disposable and Reusable Masks Volume (K) Forecast, by Application 2020 & 2033
- Table 43: Italy Disposable and Reusable Masks Revenue (million) Forecast, by Application 2020 & 2033
- Table 44: Italy Disposable and Reusable Masks Volume (K) Forecast, by Application 2020 & 2033
- Table 45: Spain Disposable and Reusable Masks Revenue (million) Forecast, by Application 2020 & 2033
- Table 46: Spain Disposable and Reusable Masks Volume (K) Forecast, by Application 2020 & 2033
- Table 47: Russia Disposable and Reusable Masks Revenue (million) Forecast, by Application 2020 & 2033
- Table 48: Russia Disposable and Reusable Masks Volume (K) Forecast, by Application 2020 & 2033
- Table 49: Benelux Disposable and Reusable Masks Revenue (million) Forecast, by Application 2020 & 2033
- Table 50: Benelux Disposable and Reusable Masks Volume (K) Forecast, by Application 2020 & 2033
- Table 51: Nordics Disposable and Reusable Masks Revenue (million) Forecast, by Application 2020 & 2033
- Table 52: Nordics Disposable and Reusable Masks Volume (K) Forecast, by Application 2020 & 2033
- Table 53: Rest of Europe Disposable and Reusable Masks Revenue (million) Forecast, by Application 2020 & 2033
- Table 54: Rest of Europe Disposable and Reusable Masks Volume (K) Forecast, by Application 2020 & 2033
- Table 55: Global Disposable and Reusable Masks Revenue million Forecast, by Application 2020 & 2033
- Table 56: Global Disposable and Reusable Masks Volume K Forecast, by Application 2020 & 2033
- Table 57: Global Disposable and Reusable Masks Revenue million Forecast, by Types 2020 & 2033
- Table 58: Global Disposable and Reusable Masks Volume K Forecast, by Types 2020 & 2033
- Table 59: Global Disposable and Reusable Masks Revenue million Forecast, by Country 2020 & 2033
- Table 60: Global Disposable and Reusable Masks Volume K Forecast, by Country 2020 & 2033
- Table 61: Turkey Disposable and Reusable Masks Revenue (million) Forecast, by Application 2020 & 2033
- Table 62: Turkey Disposable and Reusable Masks Volume (K) Forecast, by Application 2020 & 2033
- Table 63: Israel Disposable and Reusable Masks Revenue (million) Forecast, by Application 2020 & 2033
- Table 64: Israel Disposable and Reusable Masks Volume (K) Forecast, by Application 2020 & 2033
- Table 65: GCC Disposable and Reusable Masks Revenue (million) Forecast, by Application 2020 & 2033
- Table 66: GCC Disposable and Reusable Masks Volume (K) Forecast, by Application 2020 & 2033
- Table 67: North Africa Disposable and Reusable Masks Revenue (million) Forecast, by Application 2020 & 2033
- Table 68: North Africa Disposable and Reusable Masks Volume (K) Forecast, by Application 2020 & 2033
- Table 69: South Africa Disposable and Reusable Masks Revenue (million) Forecast, by Application 2020 & 2033
- Table 70: South Africa Disposable and Reusable Masks Volume (K) Forecast, by Application 2020 & 2033
- Table 71: Rest of Middle East & Africa Disposable and Reusable Masks Revenue (million) Forecast, by Application 2020 & 2033
- Table 72: Rest of Middle East & Africa Disposable and Reusable Masks Volume (K) Forecast, by Application 2020 & 2033
- Table 73: Global Disposable and Reusable Masks Revenue million Forecast, by Application 2020 & 2033
- Table 74: Global Disposable and Reusable Masks Volume K Forecast, by Application 2020 & 2033
- Table 75: Global Disposable and Reusable Masks Revenue million Forecast, by Types 2020 & 2033
- Table 76: Global Disposable and Reusable Masks Volume K Forecast, by Types 2020 & 2033
- Table 77: Global Disposable and Reusable Masks Revenue million Forecast, by Country 2020 & 2033
- Table 78: Global Disposable and Reusable Masks Volume K Forecast, by Country 2020 & 2033
- Table 79: China Disposable and Reusable Masks Revenue (million) Forecast, by Application 2020 & 2033
- Table 80: China Disposable and Reusable Masks Volume (K) Forecast, by Application 2020 & 2033
- Table 81: India Disposable and Reusable Masks Revenue (million) Forecast, by Application 2020 & 2033
- Table 82: India Disposable and Reusable Masks Volume (K) Forecast, by Application 2020 & 2033
- Table 83: Japan Disposable and Reusable Masks Revenue (million) Forecast, by Application 2020 & 2033
- Table 84: Japan Disposable and Reusable Masks Volume (K) Forecast, by Application 2020 & 2033
- Table 85: South Korea Disposable and Reusable Masks Revenue (million) Forecast, by Application 2020 & 2033
- Table 86: South Korea Disposable and Reusable Masks Volume (K) Forecast, by Application 2020 & 2033
- Table 87: ASEAN Disposable and Reusable Masks Revenue (million) Forecast, by Application 2020 & 2033
- Table 88: ASEAN Disposable and Reusable Masks Volume (K) Forecast, by Application 2020 & 2033
- Table 89: Oceania Disposable and Reusable Masks Revenue (million) Forecast, by Application 2020 & 2033
- Table 90: Oceania Disposable and Reusable Masks Volume (K) Forecast, by Application 2020 & 2033
- Table 91: Rest of Asia Pacific Disposable and Reusable Masks Revenue (million) Forecast, by Application 2020 & 2033
- Table 92: Rest of Asia Pacific Disposable and Reusable Masks Volume (K) Forecast, by Application 2020 & 2033
Frequently Asked Questions
1. What is the projected Compound Annual Growth Rate (CAGR) of the Disposable and Reusable Masks?
The projected CAGR is approximately 3.6%.
2. Which companies are prominent players in the Disposable and Reusable Masks?
Key companies in the market include 3M, Honeywell, SPRO Medical, KOWA, Makrite, Owens & Minor, Uvex, Kimberly-clark, McKesson, Prestige Ameritech, CM, Molnlycke Health, Moldex-Metric, Ansell, Unicharm, Cardinal Health, Te Yin, Japan Vilene, Shanghai Dasheng, Hakugen, Essity (BSN Medical), Zhende, Winner, Jiangyin Chang-hung, Tamagawa Eizai, Gerson, Suzhou Sanical, Sinotextiles, Alpha Pro Tech, Irema.
3. What are the main segments of the Disposable and Reusable Masks?
The market segments include Application, Types.
4. Can you provide details about the market size?
The market size is estimated to be USD 5964.2 million as of 2022.
5. What are some drivers contributing to market growth?
N/A
6. What are the notable trends driving market growth?
N/A
7. Are there any restraints impacting market growth?
N/A
8. Can you provide examples of recent developments in the market?
N/A
9. What pricing options are available for accessing the report?
Pricing options include single-user, multi-user, and enterprise licenses priced at USD 3950.00, USD 5925.00, and USD 7900.00 respectively.
10. Is the market size provided in terms of value or volume?
The market size is provided in terms of value, measured in million and volume, measured in K.
11. Are there any specific market keywords associated with the report?
Yes, the market keyword associated with the report is "Disposable and Reusable Masks," which aids in identifying and referencing the specific market segment covered.
12. How do I determine which pricing option suits my needs best?
The pricing options vary based on user requirements and access needs. Individual users may opt for single-user licenses, while businesses requiring broader access may choose multi-user or enterprise licenses for cost-effective access to the report.
13. Are there any additional resources or data provided in the Disposable and Reusable Masks report?
While the report offers comprehensive insights, it's advisable to review the specific contents or supplementary materials provided to ascertain if additional resources or data are available.
14. How can I stay updated on further developments or reports in the Disposable and Reusable Masks?
To stay informed about further developments, trends, and reports in the Disposable and Reusable Masks, consider subscribing to industry newsletters, following relevant companies and organizations, or regularly checking reputable industry news sources and publications.
Methodology
Step 1 - Identification of Relevant Samples Size from Population Database


Step 2 - Approaches for Defining Global Market Size (Value, Volume* & Price*)

Note*: In applicable scenarios
Step 3 - Data Sources
Primary Research
- Web Analytics
- Survey Reports
- Research Institute
- Latest Research Reports
- Opinion Leaders
Secondary Research
- Annual Reports
- White Paper
- Latest Press Release
- Industry Association
- Paid Database
- Investor Presentations

Step 4 - Data Triangulation
Involves using different sources of information in order to increase the validity of a study
These sources are likely to be stakeholders in a program - participants, other researchers, program staff, other community members, and so on.
Then we put all data in single framework & apply various statistical tools to find out the dynamic on the market.
During the analysis stage, feedback from the stakeholder groups would be compared to determine areas of agreement as well as areas of divergence