

Key Insights
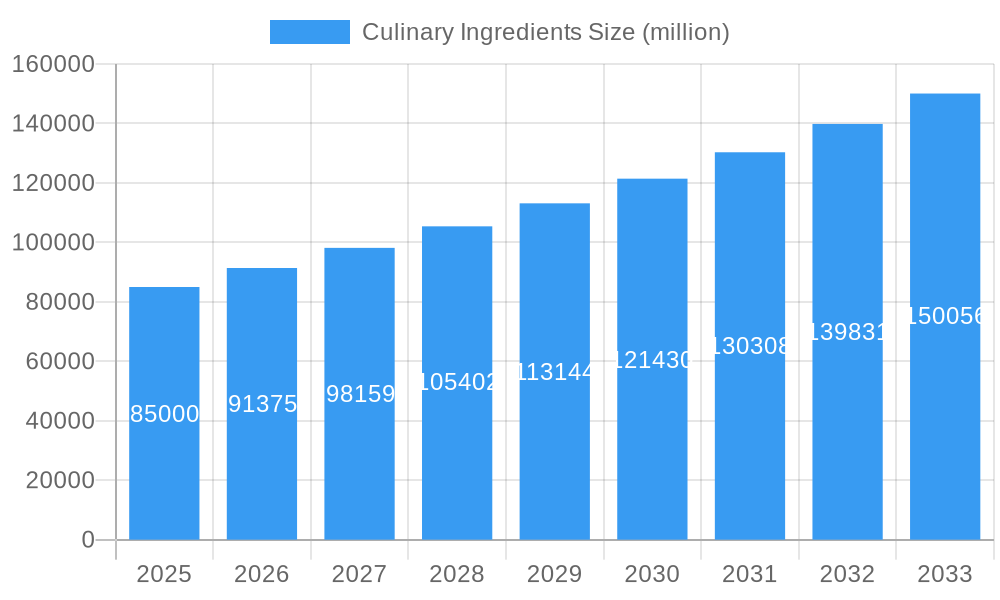
The global culinary ingredients market is experiencing robust growth, estimated to reach approximately $85 billion in 2025. This expansion is propelled by a confluence of factors, primarily the increasing consumer demand for diverse and innovative food experiences, coupled with a rising awareness of health and wellness. Key drivers include the growing popularity of convenience foods, the demand for natural and ethically sourced ingredients, and the influence of global cuisines on local palates. Furthermore, advancements in food processing technologies and the development of novel ingredient formulations are contributing significantly to market expansion. The market is projected to grow at a Compound Annual Growth Rate (CAGR) of around 7.5%, indicating sustained momentum and substantial opportunities for market players.
Culinary Ingredients Market Size (In Billion)
The market is segmented across various applications, with Modern Trade and Online Stores emerging as dominant distribution channels, reflecting evolving consumer purchasing habits. Specialty stores also hold a significant share, catering to niche demands for premium and exotic ingredients. In terms of type, both Natural and Synthetic ingredients find considerable application, though the demand for natural and clean-label products is steadily increasing. Leading companies such as Archer Daniels Midland, Cargill, DSM, and McCormick are actively investing in research and development to cater to these evolving trends, focusing on sustainable sourcing, functional ingredients, and innovative flavor profiles. Geographically, the Asia Pacific region, led by China and India, is expected to witness the fastest growth, driven by rapid urbanization, a burgeoning middle class, and increasing disposable incomes, leading to higher spending on processed foods and culinary ingredients.
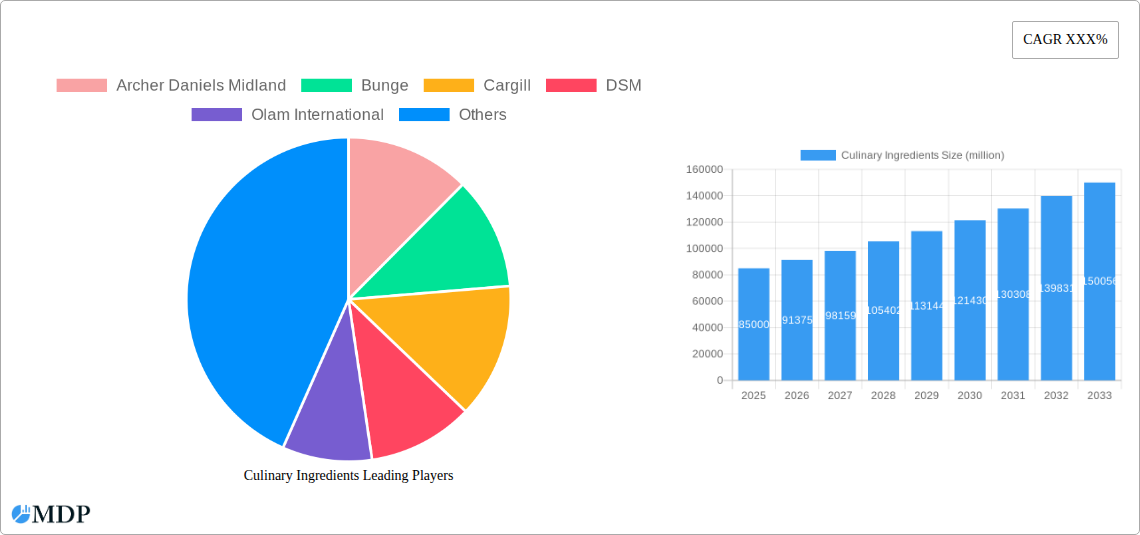
Culinary Ingredients Company Market Share
This comprehensive report delves into the dynamic culinary ingredients market, a sector projected to witness significant expansion and innovation. Examining the period from 2019 to 2033, with a base year of 2025, this analysis provides critical insights for food manufacturers, ingredient suppliers, retailers, and investment firms seeking to capitalize on evolving consumer tastes and technological advancements. The report details market dynamics, industry trends, leading segments, product developments, growth drivers, challenges, emerging opportunities, key players, pivotal milestones, and a strategic outlook, all presented with actionable data and forecasts valued in the millions.
Culinary Ingredients Market Dynamics & Concentration
The global culinary ingredients market exhibits a moderate concentration, with several dominant players accounting for a substantial share, estimated at over 100 million in market share value for the top five companies. Innovation is a key driver, fueled by demand for natural, clean-label, and functional ingredients. Regulatory frameworks, such as those surrounding food safety and labeling, play a crucial role in shaping market entry and product development. Product substitutes, ranging from natural alternatives to processed enhancers, influence consumer choice and manufacturer strategies. End-user trends, particularly the growing preference for plant-based diets and artisanal flavors, are reshaping the product landscape. Mergers and acquisitions (M&A) activities are ongoing, with an estimated 50 million M&A deal counts observed in the historical period (2019-2024), signaling consolidation and strategic expansion by leading entities like Cargill, Archer Daniels Midland, and DSM.
- Market Concentration: Moderate, with a significant share held by multinational corporations.
- Innovation Drivers: Clean-label, natural ingredients, functional benefits, flavor enhancement.
- Regulatory Frameworks: Food safety standards (e.g., FDA, EFSA), labeling requirements, sustainability mandates.
- Product Substitutes: Natural extracts, synthetic flavors, texture modifiers, alternative proteins.
- End-User Trends: Plant-based diets, health and wellness focus, demand for convenience, global flavor exploration.
- M&A Activities: Strategic acquisitions for market expansion, technology acquisition, and portfolio diversification.
Culinary Ingredients Industry Trends & Analysis
The culinary ingredients industry is experiencing robust growth, driven by several interconnected factors. The increasing global population and rising disposable incomes in emerging economies are directly contributing to a higher demand for processed foods and prepared meals, consequently boosting the consumption of culinary ingredients. The estimated Compound Annual Growth Rate (CAGR) for the market is projected to be 5.5% over the forecast period (2025-2033). Technological disruptions, including advancements in biotechnology, fermentation processes, and food processing techniques, are enabling the development of novel ingredients with enhanced nutritional profiles and improved functional properties. Consumer preferences are evolving rapidly, with a discernible shift towards healthier, more sustainable, and ethically sourced food products. This includes a growing demand for natural, organic, and non-GMO ingredients, as well as a keen interest in functional ingredients that offer health benefits beyond basic nutrition. The penetration of online retail channels for food products is also significantly impacting ingredient sourcing and distribution strategies. Competitive dynamics are intensifying, with established players continually innovating and new entrants vying for market share. The market penetration of specialty ingredients is expected to reach 35% by 2033. The integration of artificial intelligence in flavor development and recipe optimization is another emerging trend. Furthermore, the growing popularity of global cuisines and fusion food concepts is creating opportunities for a wider array of exotic and ethnic culinary ingredients. The demand for personalized nutrition solutions is also influencing ingredient innovation, with a focus on tailor-made formulations.
Leading Markets & Segments in Culinary Ingredients
The Natural segment holds a dominant position within the culinary ingredients market, driven by increasing consumer preference for clean-label products and a heightened awareness of health and wellness. This segment's market share is estimated to reach 800 million by 2025. Within the Application category, Modern Trade channels, including supermarkets and hypermarkets, represent the largest distribution network, projected to account for a market share of 750 million. This dominance is attributed to their wide reach, accessibility, and ability to cater to diverse consumer needs.
Dominant Type Segment: Natural
- Key Drivers: Consumer demand for clean labels, health consciousness, perception of natural ingredients as safer and healthier, rising awareness of synthetic ingredient concerns.
- Dominance Analysis: The natural ingredients segment is experiencing accelerated growth due to its alignment with prevailing consumer sentiments. Manufacturers are increasingly investing in natural sourcing, extraction technologies, and certifications to cater to this demand. This trend is further supported by stringent regulations in various regions that favor natural additives and flavors.
Dominant Application Segment: Modern Trade
- Key Drivers: Extensive store networks, economies of scale in distribution, strategic product placement, promotional activities, and the ability to offer a wide variety of product choices to consumers.
- Dominance Analysis: Modern retail formats have become the primary point of purchase for a majority of consumers globally. Their infrastructure allows for efficient stocking, merchandising, and consumer engagement, making them the most effective channels for distributing culinary ingredients. The increasing adoption of private label brands by modern retailers also contributes to the demand for ingredients.
Other Significant Segments:
- Online Store: Experiencing rapid growth due to convenience and accessibility, especially for niche and specialty ingredients.
- Specialty Stores: Catering to specific dietary needs and gourmet preferences, driving demand for premium and unique ingredients.
- Traditional Grocery Stores: Maintaining a steady presence, particularly in developing regions, offering essential culinary ingredients.
- Synthetic: While facing some consumer backlash, synthetic ingredients remain crucial for cost-effectiveness and specific functional properties in certain applications.
Culinary Ingredients Product Developments
Product innovations in the culinary ingredients sector are heavily focused on enhancing flavor, texture, and nutritional value while adhering to clean-label principles. Key developments include the rise of plant-based protein isolates, fermentation-derived flavor enhancers, and natural food colorants extracted from fruits and vegetables. Companies are also investing in encapsulation technologies to improve ingredient stability and controlled release in food products. Competitive advantages are being gained through novel processing techniques that preserve natural compounds and offer extended shelf life. Technological trends are steering product development towards functional ingredients that support gut health, immunity, and stress reduction, mirroring consumer demand for holistic wellness.
Key Drivers of Culinary Ingredients Growth
The culinary ingredients market is propelled by a confluence of growth drivers. Technological advancements in extraction, fermentation, and synthesis are enabling the creation of novel ingredients with superior functionalities and cost-effectiveness. The economic factor of rising disposable incomes and a growing middle class in emerging economies is fueling demand for processed and convenience foods, thus increasing the consumption of culinary ingredients. Regulatory shifts that favor natural and sustainable sourcing, coupled with stringent food safety standards, also encourage innovation and market growth. Furthermore, the global trend towards healthier eating habits and the increasing popularity of plant-based diets are significant catalysts.
Challenges in the Culinary Ingredients Market
Despite robust growth, the culinary ingredients market faces several challenges. Regulatory hurdles, including evolving food safety standards and complex international trade regulations, can impede market access and increase compliance costs, estimated at 20 million annually for compliance. Supply chain volatility, driven by geopolitical instability, climate change, and raw material price fluctuations, poses a significant risk to ingredient availability and cost. Intense competitive pressures from both established multinational corporations and agile niche players necessitate continuous innovation and efficient cost management. Consumer perception regarding the safety and health implications of certain synthetic ingredients also presents a restraint.
Emerging Opportunities in Culinary Ingredients
Emerging opportunities in the culinary ingredients market are vast and varied. The surging demand for plant-based alternatives to meat and dairy products presents a significant avenue for growth, with innovative ingredient formulations and protein sources taking center stage. Strategic partnerships between ingredient suppliers and food manufacturers are crucial for co-development and market penetration of new products. The increasing focus on sustainability and circular economy principles is creating opportunities for upcycled ingredients and waste reduction technologies. Furthermore, the burgeoning market for functional ingredients that offer health benefits beyond basic nutrition, such as probiotics, prebiotics, and adaptogens, represents a lucrative long-term growth prospect.
Leading Players in the Culinary Ingredients Sector
- Archer Daniels Midland
- Bunge
- Cargill
- DSM
- Olam International
- McCormick
- Associated British Food (ABF)
- Tate & Lyle
- Givaudan
- Ingredion
- Kerry
- Lallemand
- Lesaffre
- Frieslandcampina
- Fonterra
- Arla Foods
- Glanbia
- Kanegrade
- Hansen Holding
- Angel Yeast
Key Milestones in Culinary Ingredients Industry
- 2019: Increased focus on plant-based ingredient innovation and acquisitions.
- 2020: Surge in demand for shelf-stable ingredients and those supporting immunity due to global health events.
- 2021: Greater emphasis on sustainable sourcing and transparent supply chains by major players.
- 2022: Expansion of fermentation technologies for novel flavor compounds and functional ingredients.
- 2023: Growing investment in AI-driven flavor development and personalized nutrition ingredients.
- 2024: Intensified M&A activity to consolidate market share and acquire innovative technologies.
Strategic Outlook for Culinary Ingredients Market
The strategic outlook for the culinary ingredients market remains exceptionally positive, characterized by sustained growth and innovation. Key growth accelerators include the continuous evolution of consumer preferences towards healthier, natural, and sustainable food options, driving demand for specialty ingredients. The ongoing advancements in food science and biotechnology will unlock new functionalities and cost-effective production methods. Strategic opportunities lie in expanding into high-growth emerging markets, fostering collaborative partnerships for product development, and embracing digital transformation to enhance supply chain efficiency and customer engagement. The market is poised for significant value creation through a focus on R&D, market responsiveness, and a commitment to addressing evolving global food needs.
Culinary Ingredients Segmentation
-
1. Application
- 1.1. Modern Trade
- 1.2. Specialty Stores
- 1.3. Convenience Stores
- 1.4. Traditional Grocery Stores
- 1.5. Online store
- 1.6. Other Distribution Channels
-
2. Type
- 2.1. Natural
- 2.2. Synthetic
Culinary Ingredients Segmentation By Geography
-
1. North America
- 1.1. United States
- 1.2. Canada
- 1.3. Mexico
-
2. South America
- 2.1. Brazil
- 2.2. Argentina
- 2.3. Rest of South America
-
3. Europe
- 3.1. United Kingdom
- 3.2. Germany
- 3.3. France
- 3.4. Italy
- 3.5. Spain
- 3.6. Russia
- 3.7. Benelux
- 3.8. Nordics
- 3.9. Rest of Europe
-
4. Middle East & Africa
- 4.1. Turkey
- 4.2. Israel
- 4.3. GCC
- 4.4. North Africa
- 4.5. South Africa
- 4.6. Rest of Middle East & Africa
-
5. Asia Pacific
- 5.1. China
- 5.2. India
- 5.3. Japan
- 5.4. South Korea
- 5.5. ASEAN
- 5.6. Oceania
- 5.7. Rest of Asia Pacific
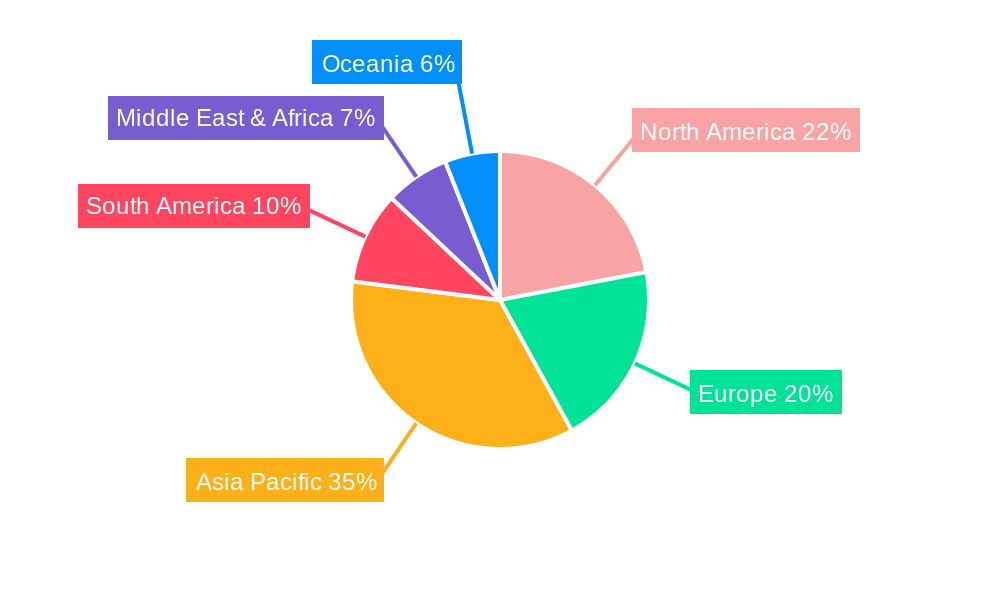
Culinary Ingredients Regional Market Share
Geographic Coverage of Culinary Ingredients
Culinary Ingredients REPORT HIGHLIGHTS
| Aspects | Details |
|---|---|
| Study Period | 2020-2034 |
| Base Year | 2025 |
| Estimated Year | 2026 |
| Forecast Period | 2026-2034 |
| Historical Period | 2020-2025 |
| Growth Rate | CAGR of XXX% from 2020-2034 |
| Segmentation |
|
Table of Contents
- 1. Introduction
- 1.1. Research Scope
- 1.2. Market Segmentation
- 1.3. Research Methodology
- 1.4. Definitions and Assumptions
- 2. Executive Summary
- 2.1. Introduction
- 3. Market Dynamics
- 3.1. Introduction
- 3.2. Market Drivers
- 3.3. Market Restrains
- 3.4. Market Trends
- 4. Market Factor Analysis
- 4.1. Porters Five Forces
- 4.2. Supply/Value Chain
- 4.3. PESTEL analysis
- 4.4. Market Entropy
- 4.5. Patent/Trademark Analysis
- 5. Global Culinary Ingredients Analysis, Insights and Forecast, 2020-2032
- 5.1. Market Analysis, Insights and Forecast - by Application
- 5.1.1. Modern Trade
- 5.1.2. Specialty Stores
- 5.1.3. Convenience Stores
- 5.1.4. Traditional Grocery Stores
- 5.1.5. Online store
- 5.1.6. Other Distribution Channels
- 5.2. Market Analysis, Insights and Forecast - by Type
- 5.2.1. Natural
- 5.2.2. Synthetic
- 5.3. Market Analysis, Insights and Forecast - by Region
- 5.3.1. North America
- 5.3.2. South America
- 5.3.3. Europe
- 5.3.4. Middle East & Africa
- 5.3.5. Asia Pacific
- 5.1. Market Analysis, Insights and Forecast - by Application
- 6. North America Culinary Ingredients Analysis, Insights and Forecast, 2020-2032
- 6.1. Market Analysis, Insights and Forecast - by Application
- 6.1.1. Modern Trade
- 6.1.2. Specialty Stores
- 6.1.3. Convenience Stores
- 6.1.4. Traditional Grocery Stores
- 6.1.5. Online store
- 6.1.6. Other Distribution Channels
- 6.2. Market Analysis, Insights and Forecast - by Type
- 6.2.1. Natural
- 6.2.2. Synthetic
- 6.1. Market Analysis, Insights and Forecast - by Application
- 7. South America Culinary Ingredients Analysis, Insights and Forecast, 2020-2032
- 7.1. Market Analysis, Insights and Forecast - by Application
- 7.1.1. Modern Trade
- 7.1.2. Specialty Stores
- 7.1.3. Convenience Stores
- 7.1.4. Traditional Grocery Stores
- 7.1.5. Online store
- 7.1.6. Other Distribution Channels
- 7.2. Market Analysis, Insights and Forecast - by Type
- 7.2.1. Natural
- 7.2.2. Synthetic
- 7.1. Market Analysis, Insights and Forecast - by Application
- 8. Europe Culinary Ingredients Analysis, Insights and Forecast, 2020-2032
- 8.1. Market Analysis, Insights and Forecast - by Application
- 8.1.1. Modern Trade
- 8.1.2. Specialty Stores
- 8.1.3. Convenience Stores
- 8.1.4. Traditional Grocery Stores
- 8.1.5. Online store
- 8.1.6. Other Distribution Channels
- 8.2. Market Analysis, Insights and Forecast - by Type
- 8.2.1. Natural
- 8.2.2. Synthetic
- 8.1. Market Analysis, Insights and Forecast - by Application
- 9. Middle East & Africa Culinary Ingredients Analysis, Insights and Forecast, 2020-2032
- 9.1. Market Analysis, Insights and Forecast - by Application
- 9.1.1. Modern Trade
- 9.1.2. Specialty Stores
- 9.1.3. Convenience Stores
- 9.1.4. Traditional Grocery Stores
- 9.1.5. Online store
- 9.1.6. Other Distribution Channels
- 9.2. Market Analysis, Insights and Forecast - by Type
- 9.2.1. Natural
- 9.2.2. Synthetic
- 9.1. Market Analysis, Insights and Forecast - by Application
- 10. Asia Pacific Culinary Ingredients Analysis, Insights and Forecast, 2020-2032
- 10.1. Market Analysis, Insights and Forecast - by Application
- 10.1.1. Modern Trade
- 10.1.2. Specialty Stores
- 10.1.3. Convenience Stores
- 10.1.4. Traditional Grocery Stores
- 10.1.5. Online store
- 10.1.6. Other Distribution Channels
- 10.2. Market Analysis, Insights and Forecast - by Type
- 10.2.1. Natural
- 10.2.2. Synthetic
- 10.1. Market Analysis, Insights and Forecast - by Application
- 11. Competitive Analysis
- 11.1. Global Market Share Analysis 2025
- 11.2. Company Profiles
- 11.2.1 Archer Daniels Midland
- 11.2.1.1. Overview
- 11.2.1.2. Products
- 11.2.1.3. SWOT Analysis
- 11.2.1.4. Recent Developments
- 11.2.1.5. Financials (Based on Availability)
- 11.2.2 Bunge
- 11.2.2.1. Overview
- 11.2.2.2. Products
- 11.2.2.3. SWOT Analysis
- 11.2.2.4. Recent Developments
- 11.2.2.5. Financials (Based on Availability)
- 11.2.3 Cargill
- 11.2.3.1. Overview
- 11.2.3.2. Products
- 11.2.3.3. SWOT Analysis
- 11.2.3.4. Recent Developments
- 11.2.3.5. Financials (Based on Availability)
- 11.2.4 DSM
- 11.2.4.1. Overview
- 11.2.4.2. Products
- 11.2.4.3. SWOT Analysis
- 11.2.4.4. Recent Developments
- 11.2.4.5. Financials (Based on Availability)
- 11.2.5 Olam International
- 11.2.5.1. Overview
- 11.2.5.2. Products
- 11.2.5.3. SWOT Analysis
- 11.2.5.4. Recent Developments
- 11.2.5.5. Financials (Based on Availability)
- 11.2.6 McCormick
- 11.2.6.1. Overview
- 11.2.6.2. Products
- 11.2.6.3. SWOT Analysis
- 11.2.6.4. Recent Developments
- 11.2.6.5. Financials (Based on Availability)
- 11.2.7 Associated British Food(ABF)
- 11.2.7.1. Overview
- 11.2.7.2. Products
- 11.2.7.3. SWOT Analysis
- 11.2.7.4. Recent Developments
- 11.2.7.5. Financials (Based on Availability)
- 11.2.8 Tate & Lyle
- 11.2.8.1. Overview
- 11.2.8.2. Products
- 11.2.8.3. SWOT Analysis
- 11.2.8.4. Recent Developments
- 11.2.8.5. Financials (Based on Availability)
- 11.2.9 Givaudan
- 11.2.9.1. Overview
- 11.2.9.2. Products
- 11.2.9.3. SWOT Analysis
- 11.2.9.4. Recent Developments
- 11.2.9.5. Financials (Based on Availability)
- 11.2.10 Ingredion
- 11.2.10.1. Overview
- 11.2.10.2. Products
- 11.2.10.3. SWOT Analysis
- 11.2.10.4. Recent Developments
- 11.2.10.5. Financials (Based on Availability)
- 11.2.11 Kerry
- 11.2.11.1. Overview
- 11.2.11.2. Products
- 11.2.11.3. SWOT Analysis
- 11.2.11.4. Recent Developments
- 11.2.11.5. Financials (Based on Availability)
- 11.2.12 Lallemand
- 11.2.12.1. Overview
- 11.2.12.2. Products
- 11.2.12.3. SWOT Analysis
- 11.2.12.4. Recent Developments
- 11.2.12.5. Financials (Based on Availability)
- 11.2.13 Lesaffre
- 11.2.13.1. Overview
- 11.2.13.2. Products
- 11.2.13.3. SWOT Analysis
- 11.2.13.4. Recent Developments
- 11.2.13.5. Financials (Based on Availability)
- 11.2.14 Frieslandcampina
- 11.2.14.1. Overview
- 11.2.14.2. Products
- 11.2.14.3. SWOT Analysis
- 11.2.14.4. Recent Developments
- 11.2.14.5. Financials (Based on Availability)
- 11.2.15 Fonterra
- 11.2.15.1. Overview
- 11.2.15.2. Products
- 11.2.15.3. SWOT Analysis
- 11.2.15.4. Recent Developments
- 11.2.15.5. Financials (Based on Availability)
- 11.2.16 Arla Foods
- 11.2.16.1. Overview
- 11.2.16.2. Products
- 11.2.16.3. SWOT Analysis
- 11.2.16.4. Recent Developments
- 11.2.16.5. Financials (Based on Availability)
- 11.2.17 Glanbia
- 11.2.17.1. Overview
- 11.2.17.2. Products
- 11.2.17.3. SWOT Analysis
- 11.2.17.4. Recent Developments
- 11.2.17.5. Financials (Based on Availability)
- 11.2.18 Kanegrade
- 11.2.18.1. Overview
- 11.2.18.2. Products
- 11.2.18.3. SWOT Analysis
- 11.2.18.4. Recent Developments
- 11.2.18.5. Financials (Based on Availability)
- 11.2.19 Hansen Holding
- 11.2.19.1. Overview
- 11.2.19.2. Products
- 11.2.19.3. SWOT Analysis
- 11.2.19.4. Recent Developments
- 11.2.19.5. Financials (Based on Availability)
- 11.2.20 Angel Yeast
- 11.2.20.1. Overview
- 11.2.20.2. Products
- 11.2.20.3. SWOT Analysis
- 11.2.20.4. Recent Developments
- 11.2.20.5. Financials (Based on Availability)
- 11.2.1 Archer Daniels Midland
List of Figures
- Figure 1: Global Culinary Ingredients Revenue Breakdown (million, %) by Region 2025 & 2033
- Figure 2: Global Culinary Ingredients Volume Breakdown (K, %) by Region 2025 & 2033
- Figure 3: North America Culinary Ingredients Revenue (million), by Application 2025 & 2033
- Figure 4: North America Culinary Ingredients Volume (K), by Application 2025 & 2033
- Figure 5: North America Culinary Ingredients Revenue Share (%), by Application 2025 & 2033
- Figure 6: North America Culinary Ingredients Volume Share (%), by Application 2025 & 2033
- Figure 7: North America Culinary Ingredients Revenue (million), by Type 2025 & 2033
- Figure 8: North America Culinary Ingredients Volume (K), by Type 2025 & 2033
- Figure 9: North America Culinary Ingredients Revenue Share (%), by Type 2025 & 2033
- Figure 10: North America Culinary Ingredients Volume Share (%), by Type 2025 & 2033
- Figure 11: North America Culinary Ingredients Revenue (million), by Country 2025 & 2033
- Figure 12: North America Culinary Ingredients Volume (K), by Country 2025 & 2033
- Figure 13: North America Culinary Ingredients Revenue Share (%), by Country 2025 & 2033
- Figure 14: North America Culinary Ingredients Volume Share (%), by Country 2025 & 2033
- Figure 15: South America Culinary Ingredients Revenue (million), by Application 2025 & 2033
- Figure 16: South America Culinary Ingredients Volume (K), by Application 2025 & 2033
- Figure 17: South America Culinary Ingredients Revenue Share (%), by Application 2025 & 2033
- Figure 18: South America Culinary Ingredients Volume Share (%), by Application 2025 & 2033
- Figure 19: South America Culinary Ingredients Revenue (million), by Type 2025 & 2033
- Figure 20: South America Culinary Ingredients Volume (K), by Type 2025 & 2033
- Figure 21: South America Culinary Ingredients Revenue Share (%), by Type 2025 & 2033
- Figure 22: South America Culinary Ingredients Volume Share (%), by Type 2025 & 2033
- Figure 23: South America Culinary Ingredients Revenue (million), by Country 2025 & 2033
- Figure 24: South America Culinary Ingredients Volume (K), by Country 2025 & 2033
- Figure 25: South America Culinary Ingredients Revenue Share (%), by Country 2025 & 2033
- Figure 26: South America Culinary Ingredients Volume Share (%), by Country 2025 & 2033
- Figure 27: Europe Culinary Ingredients Revenue (million), by Application 2025 & 2033
- Figure 28: Europe Culinary Ingredients Volume (K), by Application 2025 & 2033
- Figure 29: Europe Culinary Ingredients Revenue Share (%), by Application 2025 & 2033
- Figure 30: Europe Culinary Ingredients Volume Share (%), by Application 2025 & 2033
- Figure 31: Europe Culinary Ingredients Revenue (million), by Type 2025 & 2033
- Figure 32: Europe Culinary Ingredients Volume (K), by Type 2025 & 2033
- Figure 33: Europe Culinary Ingredients Revenue Share (%), by Type 2025 & 2033
- Figure 34: Europe Culinary Ingredients Volume Share (%), by Type 2025 & 2033
- Figure 35: Europe Culinary Ingredients Revenue (million), by Country 2025 & 2033
- Figure 36: Europe Culinary Ingredients Volume (K), by Country 2025 & 2033
- Figure 37: Europe Culinary Ingredients Revenue Share (%), by Country 2025 & 2033
- Figure 38: Europe Culinary Ingredients Volume Share (%), by Country 2025 & 2033
- Figure 39: Middle East & Africa Culinary Ingredients Revenue (million), by Application 2025 & 2033
- Figure 40: Middle East & Africa Culinary Ingredients Volume (K), by Application 2025 & 2033
- Figure 41: Middle East & Africa Culinary Ingredients Revenue Share (%), by Application 2025 & 2033
- Figure 42: Middle East & Africa Culinary Ingredients Volume Share (%), by Application 2025 & 2033
- Figure 43: Middle East & Africa Culinary Ingredients Revenue (million), by Type 2025 & 2033
- Figure 44: Middle East & Africa Culinary Ingredients Volume (K), by Type 2025 & 2033
- Figure 45: Middle East & Africa Culinary Ingredients Revenue Share (%), by Type 2025 & 2033
- Figure 46: Middle East & Africa Culinary Ingredients Volume Share (%), by Type 2025 & 2033
- Figure 47: Middle East & Africa Culinary Ingredients Revenue (million), by Country 2025 & 2033
- Figure 48: Middle East & Africa Culinary Ingredients Volume (K), by Country 2025 & 2033
- Figure 49: Middle East & Africa Culinary Ingredients Revenue Share (%), by Country 2025 & 2033
- Figure 50: Middle East & Africa Culinary Ingredients Volume Share (%), by Country 2025 & 2033
- Figure 51: Asia Pacific Culinary Ingredients Revenue (million), by Application 2025 & 2033
- Figure 52: Asia Pacific Culinary Ingredients Volume (K), by Application 2025 & 2033
- Figure 53: Asia Pacific Culinary Ingredients Revenue Share (%), by Application 2025 & 2033
- Figure 54: Asia Pacific Culinary Ingredients Volume Share (%), by Application 2025 & 2033
- Figure 55: Asia Pacific Culinary Ingredients Revenue (million), by Type 2025 & 2033
- Figure 56: Asia Pacific Culinary Ingredients Volume (K), by Type 2025 & 2033
- Figure 57: Asia Pacific Culinary Ingredients Revenue Share (%), by Type 2025 & 2033
- Figure 58: Asia Pacific Culinary Ingredients Volume Share (%), by Type 2025 & 2033
- Figure 59: Asia Pacific Culinary Ingredients Revenue (million), by Country 2025 & 2033
- Figure 60: Asia Pacific Culinary Ingredients Volume (K), by Country 2025 & 2033
- Figure 61: Asia Pacific Culinary Ingredients Revenue Share (%), by Country 2025 & 2033
- Figure 62: Asia Pacific Culinary Ingredients Volume Share (%), by Country 2025 & 2033
List of Tables
- Table 1: Global Culinary Ingredients Revenue million Forecast, by Application 2020 & 2033
- Table 2: Global Culinary Ingredients Volume K Forecast, by Application 2020 & 2033
- Table 3: Global Culinary Ingredients Revenue million Forecast, by Type 2020 & 2033
- Table 4: Global Culinary Ingredients Volume K Forecast, by Type 2020 & 2033
- Table 5: Global Culinary Ingredients Revenue million Forecast, by Region 2020 & 2033
- Table 6: Global Culinary Ingredients Volume K Forecast, by Region 2020 & 2033
- Table 7: Global Culinary Ingredients Revenue million Forecast, by Application 2020 & 2033
- Table 8: Global Culinary Ingredients Volume K Forecast, by Application 2020 & 2033
- Table 9: Global Culinary Ingredients Revenue million Forecast, by Type 2020 & 2033
- Table 10: Global Culinary Ingredients Volume K Forecast, by Type 2020 & 2033
- Table 11: Global Culinary Ingredients Revenue million Forecast, by Country 2020 & 2033
- Table 12: Global Culinary Ingredients Volume K Forecast, by Country 2020 & 2033
- Table 13: United States Culinary Ingredients Revenue (million) Forecast, by Application 2020 & 2033
- Table 14: United States Culinary Ingredients Volume (K) Forecast, by Application 2020 & 2033
- Table 15: Canada Culinary Ingredients Revenue (million) Forecast, by Application 2020 & 2033
- Table 16: Canada Culinary Ingredients Volume (K) Forecast, by Application 2020 & 2033
- Table 17: Mexico Culinary Ingredients Revenue (million) Forecast, by Application 2020 & 2033
- Table 18: Mexico Culinary Ingredients Volume (K) Forecast, by Application 2020 & 2033
- Table 19: Global Culinary Ingredients Revenue million Forecast, by Application 2020 & 2033
- Table 20: Global Culinary Ingredients Volume K Forecast, by Application 2020 & 2033
- Table 21: Global Culinary Ingredients Revenue million Forecast, by Type 2020 & 2033
- Table 22: Global Culinary Ingredients Volume K Forecast, by Type 2020 & 2033
- Table 23: Global Culinary Ingredients Revenue million Forecast, by Country 2020 & 2033
- Table 24: Global Culinary Ingredients Volume K Forecast, by Country 2020 & 2033
- Table 25: Brazil Culinary Ingredients Revenue (million) Forecast, by Application 2020 & 2033
- Table 26: Brazil Culinary Ingredients Volume (K) Forecast, by Application 2020 & 2033
- Table 27: Argentina Culinary Ingredients Revenue (million) Forecast, by Application 2020 & 2033
- Table 28: Argentina Culinary Ingredients Volume (K) Forecast, by Application 2020 & 2033
- Table 29: Rest of South America Culinary Ingredients Revenue (million) Forecast, by Application 2020 & 2033
- Table 30: Rest of South America Culinary Ingredients Volume (K) Forecast, by Application 2020 & 2033
- Table 31: Global Culinary Ingredients Revenue million Forecast, by Application 2020 & 2033
- Table 32: Global Culinary Ingredients Volume K Forecast, by Application 2020 & 2033
- Table 33: Global Culinary Ingredients Revenue million Forecast, by Type 2020 & 2033
- Table 34: Global Culinary Ingredients Volume K Forecast, by Type 2020 & 2033
- Table 35: Global Culinary Ingredients Revenue million Forecast, by Country 2020 & 2033
- Table 36: Global Culinary Ingredients Volume K Forecast, by Country 2020 & 2033
- Table 37: United Kingdom Culinary Ingredients Revenue (million) Forecast, by Application 2020 & 2033
- Table 38: United Kingdom Culinary Ingredients Volume (K) Forecast, by Application 2020 & 2033
- Table 39: Germany Culinary Ingredients Revenue (million) Forecast, by Application 2020 & 2033
- Table 40: Germany Culinary Ingredients Volume (K) Forecast, by Application 2020 & 2033
- Table 41: France Culinary Ingredients Revenue (million) Forecast, by Application 2020 & 2033
- Table 42: France Culinary Ingredients Volume (K) Forecast, by Application 2020 & 2033
- Table 43: Italy Culinary Ingredients Revenue (million) Forecast, by Application 2020 & 2033
- Table 44: Italy Culinary Ingredients Volume (K) Forecast, by Application 2020 & 2033
- Table 45: Spain Culinary Ingredients Revenue (million) Forecast, by Application 2020 & 2033
- Table 46: Spain Culinary Ingredients Volume (K) Forecast, by Application 2020 & 2033
- Table 47: Russia Culinary Ingredients Revenue (million) Forecast, by Application 2020 & 2033
- Table 48: Russia Culinary Ingredients Volume (K) Forecast, by Application 2020 & 2033
- Table 49: Benelux Culinary Ingredients Revenue (million) Forecast, by Application 2020 & 2033
- Table 50: Benelux Culinary Ingredients Volume (K) Forecast, by Application 2020 & 2033
- Table 51: Nordics Culinary Ingredients Revenue (million) Forecast, by Application 2020 & 2033
- Table 52: Nordics Culinary Ingredients Volume (K) Forecast, by Application 2020 & 2033
- Table 53: Rest of Europe Culinary Ingredients Revenue (million) Forecast, by Application 2020 & 2033
- Table 54: Rest of Europe Culinary Ingredients Volume (K) Forecast, by Application 2020 & 2033
- Table 55: Global Culinary Ingredients Revenue million Forecast, by Application 2020 & 2033
- Table 56: Global Culinary Ingredients Volume K Forecast, by Application 2020 & 2033
- Table 57: Global Culinary Ingredients Revenue million Forecast, by Type 2020 & 2033
- Table 58: Global Culinary Ingredients Volume K Forecast, by Type 2020 & 2033
- Table 59: Global Culinary Ingredients Revenue million Forecast, by Country 2020 & 2033
- Table 60: Global Culinary Ingredients Volume K Forecast, by Country 2020 & 2033
- Table 61: Turkey Culinary Ingredients Revenue (million) Forecast, by Application 2020 & 2033
- Table 62: Turkey Culinary Ingredients Volume (K) Forecast, by Application 2020 & 2033
- Table 63: Israel Culinary Ingredients Revenue (million) Forecast, by Application 2020 & 2033
- Table 64: Israel Culinary Ingredients Volume (K) Forecast, by Application 2020 & 2033
- Table 65: GCC Culinary Ingredients Revenue (million) Forecast, by Application 2020 & 2033
- Table 66: GCC Culinary Ingredients Volume (K) Forecast, by Application 2020 & 2033
- Table 67: North Africa Culinary Ingredients Revenue (million) Forecast, by Application 2020 & 2033
- Table 68: North Africa Culinary Ingredients Volume (K) Forecast, by Application 2020 & 2033
- Table 69: South Africa Culinary Ingredients Revenue (million) Forecast, by Application 2020 & 2033
- Table 70: South Africa Culinary Ingredients Volume (K) Forecast, by Application 2020 & 2033
- Table 71: Rest of Middle East & Africa Culinary Ingredients Revenue (million) Forecast, by Application 2020 & 2033
- Table 72: Rest of Middle East & Africa Culinary Ingredients Volume (K) Forecast, by Application 2020 & 2033
- Table 73: Global Culinary Ingredients Revenue million Forecast, by Application 2020 & 2033
- Table 74: Global Culinary Ingredients Volume K Forecast, by Application 2020 & 2033
- Table 75: Global Culinary Ingredients Revenue million Forecast, by Type 2020 & 2033
- Table 76: Global Culinary Ingredients Volume K Forecast, by Type 2020 & 2033
- Table 77: Global Culinary Ingredients Revenue million Forecast, by Country 2020 & 2033
- Table 78: Global Culinary Ingredients Volume K Forecast, by Country 2020 & 2033
- Table 79: China Culinary Ingredients Revenue (million) Forecast, by Application 2020 & 2033
- Table 80: China Culinary Ingredients Volume (K) Forecast, by Application 2020 & 2033
- Table 81: India Culinary Ingredients Revenue (million) Forecast, by Application 2020 & 2033
- Table 82: India Culinary Ingredients Volume (K) Forecast, by Application 2020 & 2033
- Table 83: Japan Culinary Ingredients Revenue (million) Forecast, by Application 2020 & 2033
- Table 84: Japan Culinary Ingredients Volume (K) Forecast, by Application 2020 & 2033
- Table 85: South Korea Culinary Ingredients Revenue (million) Forecast, by Application 2020 & 2033
- Table 86: South Korea Culinary Ingredients Volume (K) Forecast, by Application 2020 & 2033
- Table 87: ASEAN Culinary Ingredients Revenue (million) Forecast, by Application 2020 & 2033
- Table 88: ASEAN Culinary Ingredients Volume (K) Forecast, by Application 2020 & 2033
- Table 89: Oceania Culinary Ingredients Revenue (million) Forecast, by Application 2020 & 2033
- Table 90: Oceania Culinary Ingredients Volume (K) Forecast, by Application 2020 & 2033
- Table 91: Rest of Asia Pacific Culinary Ingredients Revenue (million) Forecast, by Application 2020 & 2033
- Table 92: Rest of Asia Pacific Culinary Ingredients Volume (K) Forecast, by Application 2020 & 2033
Frequently Asked Questions
1. What is the projected Compound Annual Growth Rate (CAGR) of the Culinary Ingredients?
The projected CAGR is approximately XXX%.
2. Which companies are prominent players in the Culinary Ingredients?
Key companies in the market include Archer Daniels Midland, Bunge, Cargill, DSM, Olam International, McCormick, Associated British Food(ABF), Tate & Lyle, Givaudan, Ingredion, Kerry, Lallemand, Lesaffre, Frieslandcampina, Fonterra, Arla Foods, Glanbia, Kanegrade, Hansen Holding, Angel Yeast.
3. What are the main segments of the Culinary Ingredients?
The market segments include Application, Type.
4. Can you provide details about the market size?
The market size is estimated to be USD XXX million as of 2022.
5. What are some drivers contributing to market growth?
N/A
6. What are the notable trends driving market growth?
N/A
7. Are there any restraints impacting market growth?
N/A
8. Can you provide examples of recent developments in the market?
N/A
9. What pricing options are available for accessing the report?
Pricing options include single-user, multi-user, and enterprise licenses priced at USD 3950.00, USD 5925.00, and USD 7900.00 respectively.
10. Is the market size provided in terms of value or volume?
The market size is provided in terms of value, measured in million and volume, measured in K.
11. Are there any specific market keywords associated with the report?
Yes, the market keyword associated with the report is "Culinary Ingredients," which aids in identifying and referencing the specific market segment covered.
12. How do I determine which pricing option suits my needs best?
The pricing options vary based on user requirements and access needs. Individual users may opt for single-user licenses, while businesses requiring broader access may choose multi-user or enterprise licenses for cost-effective access to the report.
13. Are there any additional resources or data provided in the Culinary Ingredients report?
While the report offers comprehensive insights, it's advisable to review the specific contents or supplementary materials provided to ascertain if additional resources or data are available.
14. How can I stay updated on further developments or reports in the Culinary Ingredients?
To stay informed about further developments, trends, and reports in the Culinary Ingredients, consider subscribing to industry newsletters, following relevant companies and organizations, or regularly checking reputable industry news sources and publications.
Methodology
Step 1 - Identification of Relevant Samples Size from Population Database


Step 2 - Approaches for Defining Global Market Size (Value, Volume* & Price*)

Note*: In applicable scenarios
Step 3 - Data Sources
Primary Research
- Web Analytics
- Survey Reports
- Research Institute
- Latest Research Reports
- Opinion Leaders
Secondary Research
- Annual Reports
- White Paper
- Latest Press Release
- Industry Association
- Paid Database
- Investor Presentations

Step 4 - Data Triangulation
Involves using different sources of information in order to increase the validity of a study
These sources are likely to be stakeholders in a program - participants, other researchers, program staff, other community members, and so on.
Then we put all data in single framework & apply various statistical tools to find out the dynamic on the market.
During the analysis stage, feedback from the stakeholder groups would be compared to determine areas of agreement as well as areas of divergence