

Key Insights
The global cranberry market, valued at approximately $2.9 billion in 2025, is projected to experience robust growth, exhibiting a Compound Annual Growth Rate (CAGR) of 4.2% from 2025 to 2033. This expansion is propelled by heightened consumer awareness of cranberries' significant health benefits, particularly their high antioxidant content and efficacy in supporting urinary tract health. The increasing demand for functional foods and dietary supplements, coupled with the widespread adoption of cranberries in the food and beverage sector (juices, sauces, snacks), are key drivers. Processed cranberries, offering enhanced convenience and extended shelf life, represent a substantial market segment. Value-added products, including cranberry extracts and powders, cater to the growing segment of health-conscious consumers. North America, led by the United States and Canada, maintains its leadership position, benefiting from established cultivation practices and strong consumer demand. However, the Asia-Pacific region presents significant growth opportunities, driven by rising disposable incomes and increasing health consciousness in key markets such as China and Japan. Despite challenges such as weather-dependent yield fluctuations and potential competition from alternative berries, the market outlook remains positive, supported by ongoing product innovation and expanding global distribution.
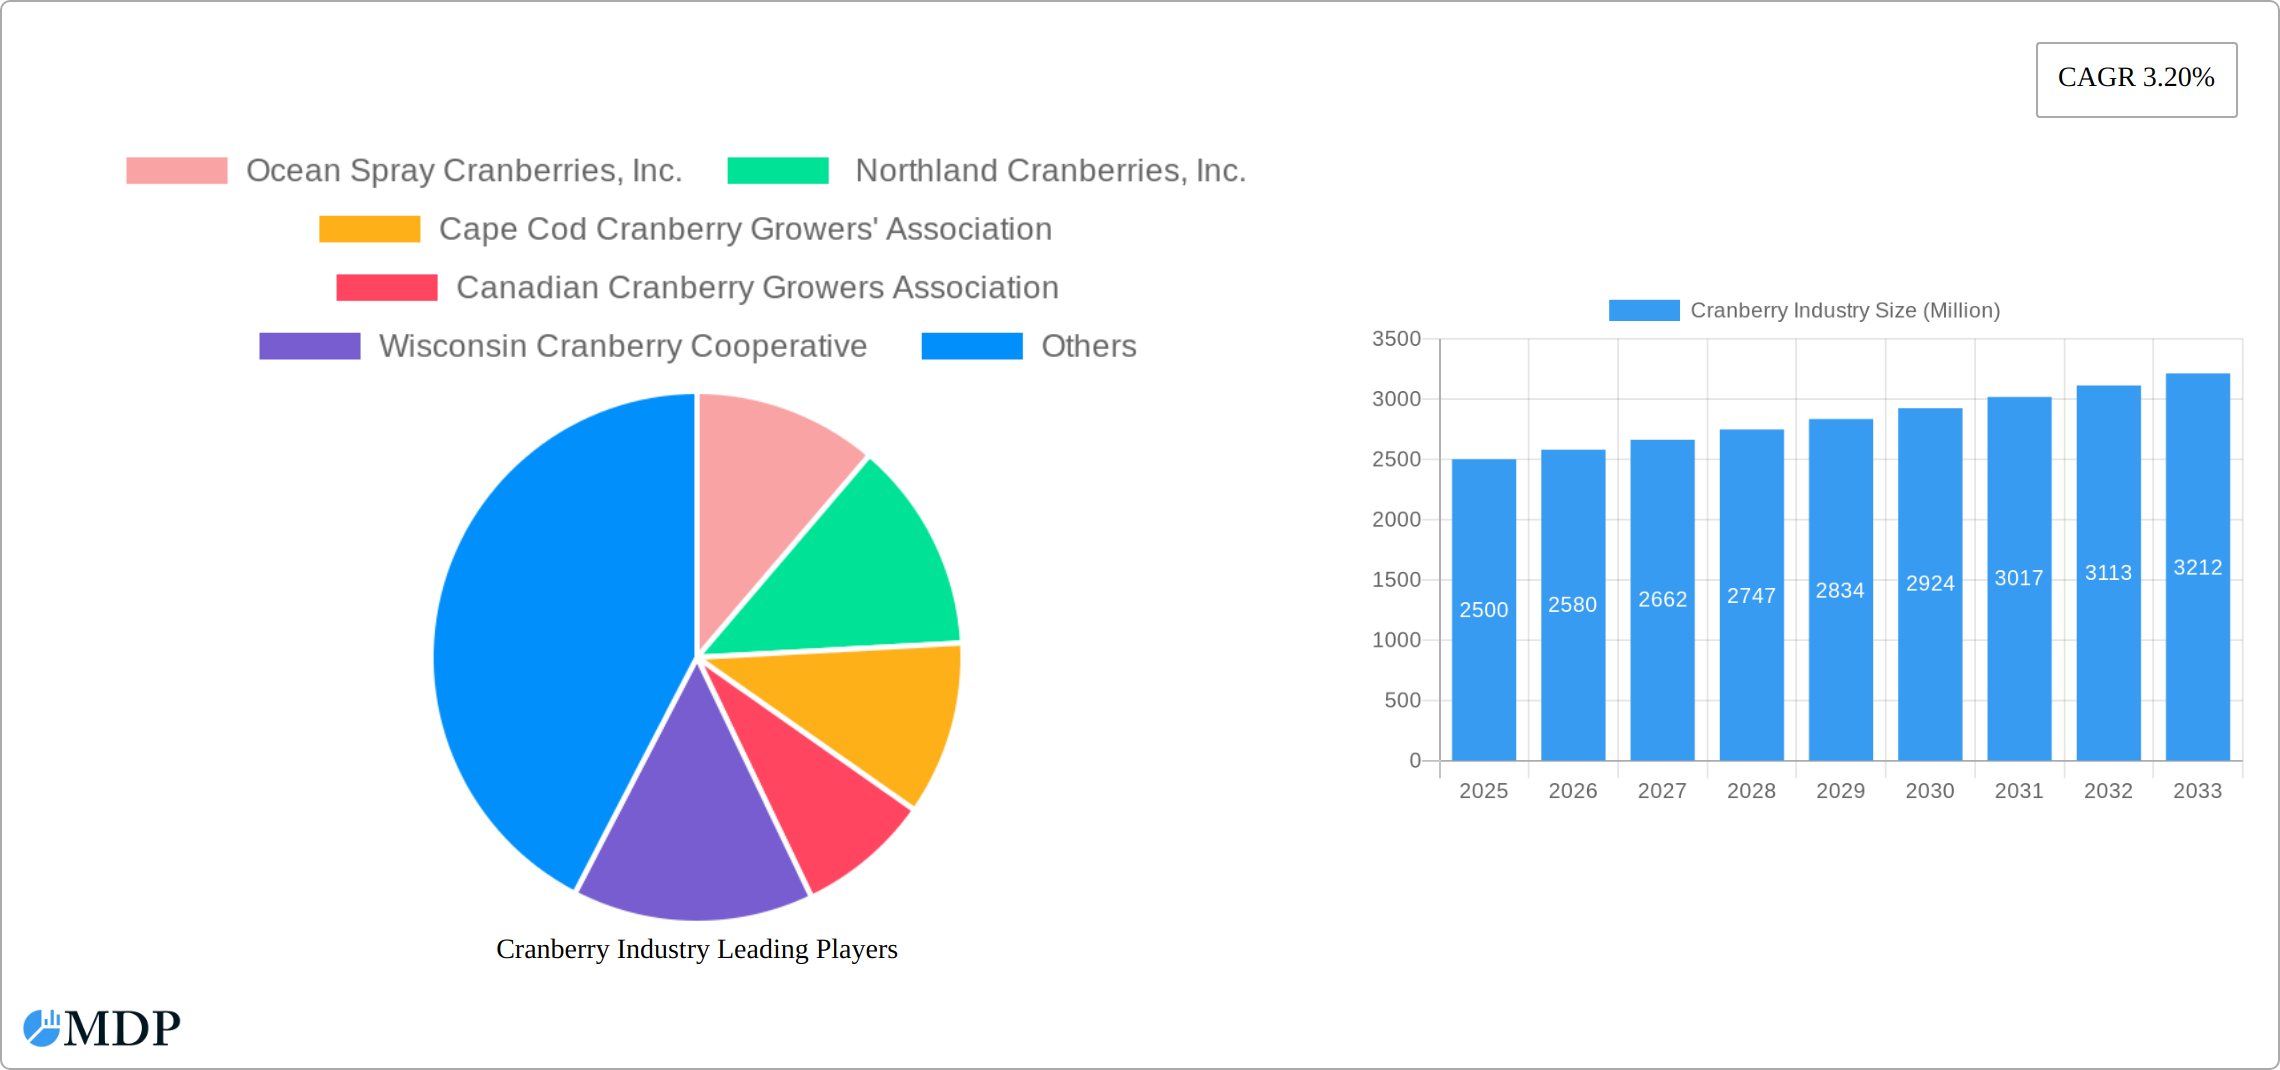
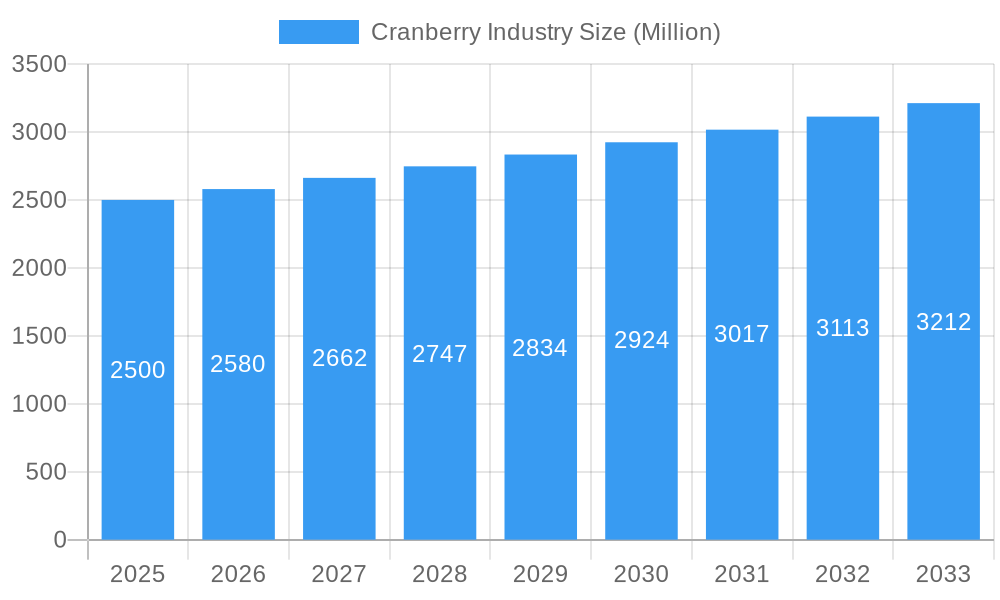
Cranberry Industry Market Size (In Billion)
Market segmentation analysis indicates a dynamic landscape. The processed cranberry segment is poised for substantial growth due to its extended shelf life and diverse applications across multiple industries. Within the application segments, food and beverages currently lead, with dietary supplements and pharmaceuticals demonstrating considerable potential as research continues to highlight cranberry's health advantages. Key industry players, including Ocean Spray Cranberries, Inc., and regional cooperatives, are instrumental in market development through their established brand equity and extensive distribution networks. Market expansion strategies encompass product diversification, entry into emerging markets (especially in Asia-Pacific), and strategic alliances to broaden distribution channels and reach new consumer demographics. The forecast period anticipates sustained market growth, driven by consistent demand and continuous product innovation.
Cranberry Industry Company Market Share
Deep Dive into the Thriving Cranberry Industry: A Comprehensive Market Report (2019-2033)
This comprehensive report provides an in-depth analysis of the global cranberry industry, offering invaluable insights for stakeholders, investors, and industry professionals. With a focus on market dynamics, trends, and future projections, this report covers the period from 2019 to 2033, utilizing 2025 as the base and estimated year. The report leverages data and analysis to uncover key opportunities and challenges within this dynamic sector. Expect detailed breakdowns by product type (fresh, processed, value-added) and application (food & beverage, dietary supplements, pharmaceuticals), featuring leading players like Ocean Spray Cranberries, Inc., and others. This report is essential for navigating the complexities of the cranberry market and making informed strategic decisions. The total market value is predicted to reach xx Million by 2033.
Cranberry Industry Market Dynamics & Concentration
The global cranberry market, valued at xx Million in 2024, exhibits a moderately concentrated structure. Ocean Spray Cranberries, Inc. holds a significant market share, estimated at xx%, followed by other major players like Northland Cranberries, Inc., and regional cooperatives such as the Wisconsin Cranberry Cooperative. The industry is witnessing increasing innovation driven by the growing demand for functional foods and health-conscious consumer preferences. Regulatory frameworks concerning food safety and labeling play a significant role, impacting production and distribution. Product substitutes, such as other berries and fruit juices, present competition. The increasing consumer preference for healthy and natural food products is a major growth driver.
- Market Share: Ocean Spray: xx%; Northland Cranberries: xx%; Others: xx%
- M&A Activity (2019-2024): xx deals, primarily focused on consolidation and expansion into value-added products.
- Innovation Drivers: Growing demand for functional foods, health benefits research, technological advancements in processing and packaging.
- Regulatory Frameworks: Stringent food safety regulations, labeling requirements, and sustainable farming practices.
- End-User Trends: Rising health consciousness, increasing preference for natural and organic products, growing demand for convenient and ready-to-consume options.
Cranberry Industry Trends & Analysis
The cranberry industry is experiencing robust growth, driven by rising health awareness and the increasing popularity of cranberries as a superfood. The market is projected to witness a Compound Annual Growth Rate (CAGR) of xx% during the forecast period (2025-2033). This growth is fueled by several factors, including technological advancements in cultivation and processing, expanding product applications in the food and beverage, dietary supplement, and pharmaceutical sectors, and increasing consumer demand for convenient and value-added cranberry products. The market penetration of cranberry products in various regions is also increasing, further contributing to market growth. Competitive dynamics are characterized by both established players and emerging businesses focusing on innovation and expansion into new markets. Consumer preferences for organic and sustainably sourced cranberries are also influencing market trends.
Leading Markets & Segments in Cranberry Industry
The cranberry industry is a dynamic market characterized by significant regional variations and evolving consumer preferences. North America, specifically the United States and Canada, remains the dominant force, boasting established cultivation infrastructure, robust processing capabilities, and high domestic consumption. Within this landscape, processed cranberries—encompassing juices, sauces, dried cranberries, and various other value-added products—command the largest market share, reflecting their adaptability and appeal in diverse culinary and beverage applications.
- Dominant Regions: North America (primarily the United States and Canada), with emerging markets in Europe and Asia.
- Leading Product Segments: Processed cranberries (juices, sauces, dried cranberries, extracts, powders), whole cranberries (fresh and frozen), and increasingly, functional food and beverage ingredients.
- Key Application Segments: Food and beverage manufacturing (including juice blends, sauces, baked goods, confectionery), dietary supplements, and increasingly, pharmaceutical and cosmetic applications.
Factors Contributing to North American Market Leadership:
- Mature Production Infrastructure: Extensive cranberry bogs, advanced harvesting technologies, and efficient processing facilities.
- High Domestic Consumption: Strong consumer preference for cranberries, driven by health and wellness trends.
- Favorable Climate and Soil Conditions: Regions with optimal environmental factors for cranberry cultivation.
- Government Support and Research: Agricultural policies and research initiatives fostering innovation and sustainability.
- Established Supply Chains: Efficient distribution networks ensuring product availability to consumers.
Beyond North America, the global market shows promising growth potential, especially in regions with increasing health consciousness and rising disposable incomes.
Cranberry Industry Product Developments
Innovation is a key driver of growth within the cranberry industry. Companies are continually developing new products that cater to evolving consumer demands. This includes a surge in functional beverages, incorporating cranberries for their antioxidant and health benefits; the expansion into dietary supplements; and creative applications in various food items ranging from snacks to gourmet meals. Furthermore, advancements in processing and preservation techniques are enhancing product shelf-life and overall quality, opening doors to wider distribution and market penetration. The industry's focus remains steadfast on offering convenient, high-quality, and health-conscious options to meet consumer preferences.
Key Drivers of Cranberry Growth
The growth of the cranberry industry is driven by several key factors:
- Growing Health Awareness: Cranberries are increasingly recognized for their health benefits, leading to higher demand.
- Technological Advancements: Improved cultivation techniques and processing methods enhance production efficiency and product quality.
- Strategic Partnerships: Collaborations between cranberry producers and other companies to expand product applications and market reach.
Challenges in the Cranberry Industry Market
The cranberry industry faces several dynamic challenges that necessitate strategic adaptation:
- Supply Chain Volatility: Weather patterns, transportation costs, and geopolitical events can disrupt supply chains and impact profitability.
- Intense Competition: The industry faces competition from other berries and fruit products, requiring continuous innovation and differentiation to maintain market share.
- Price Fluctuations: Yield variations and market demand influence cranberry prices, impacting both producers and consumers.
- Sustainability Concerns: Growing pressure to adopt environmentally friendly cultivation and processing practices.
- Consumer Preferences: Keeping pace with the ever-changing health and wellness trends, and dietary preferences.
Emerging Opportunities in Cranberry Industry
The future holds promising opportunities for growth, including:
- Expanding into New Markets: Targeting emerging markets with growing consumer demand for healthy foods.
- Functional Food Development: Developing new products emphasizing health benefits (e.g., antioxidant properties).
- Technological Innovations: Exploring new technologies for sustainable cultivation and processing.
Leading Players in the Cranberry Industry Sector
- Ocean Spray Cranberries, Inc.
- Northland Cranberries, Inc.
- Cape Cod Cranberry Growers' Association
- Canadian Cranberry Growers Association
- Wisconsin Cranberry Cooperative
- Other regional and national producers and cooperatives
Key Milestones in Cranberry Industry
- November 2021: Ocean Spray partners with Brightseed to utilize AI in profiling cranberry compounds and exploring health connections.
- March 2022: Ocean Spray and Canomiks collaborate to use AI in testing and certifying cranberry's biological efficacy.
Strategic Outlook for Cranberry Industry Market
The future of the cranberry industry is promising, driven by sustained consumer demand for healthy and convenient food options. Strategic growth will hinge on several key factors: developing innovative products, expanding into new and emerging markets globally, forging strategic partnerships for distribution and market access, and adopting sustainable practices to meet environmental concerns. Companies prioritizing technological innovation in both production and processing, combined with a strong focus on marketing and brand building, are likely to experience the greatest success in this evolving market.
Cranberry Industry Segmentation
- 1. Production Analysis
- 2. Consumption Analysis
- 3. Import Market Analysis (Value & Volume)
- 4. Export Market Analysis (Value & Volume)
- 5. Price Trend Analysis
Cranberry Industry Segmentation By Geography
-
1. North America
- 1.1. United States
-
2. Europe
- 2.1. Germany
-
3. Asia Pacific
- 3.1. China
-
4. South America
- 4.1. Chile
-
5. Africa
- 5.1. South Africa
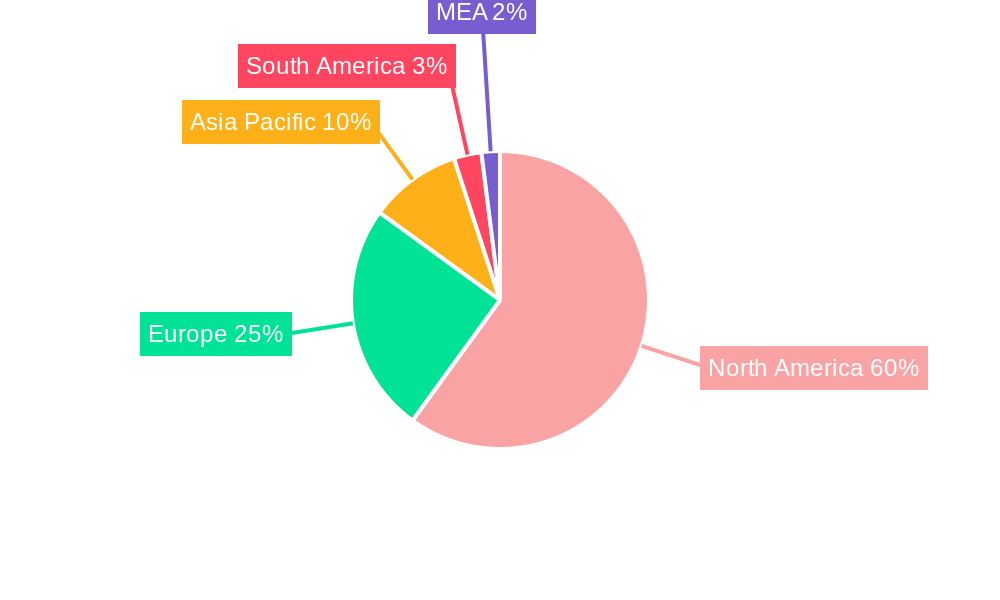
Cranberry Industry Regional Market Share
Geographic Coverage of Cranberry Industry
Cranberry Industry REPORT HIGHLIGHTS
| Aspects | Details |
|---|---|
| Study Period | 2020-2034 |
| Base Year | 2025 |
| Estimated Year | 2026 |
| Forecast Period | 2026-2034 |
| Historical Period | 2020-2025 |
| Growth Rate | CAGR of 4.2% from 2020-2034 |
| Segmentation |
|
Table of Contents
- 1. Introduction
- 1.1. Research Scope
- 1.2. Market Segmentation
- 1.3. Research Methodology
- 1.4. Definitions and Assumptions
- 2. Executive Summary
- 2.1. Introduction
- 3. Market Dynamics
- 3.1. Introduction
- 3.2. Market Drivers
- 3.2.1. Rise in Percentage of Area Harvested Under Almond Cultivation; Demand for Healthy Snacking Options
- 3.3. Market Restrains
- 3.3.1. Water Scarcity in Almond Producing Regions; Drop in the Prices of Almonds
- 3.4. Market Trends
- 3.4.1. Increasing Demand from Processing Industry
- 4. Market Factor Analysis
- 4.1. Porters Five Forces
- 4.2. Supply/Value Chain
- 4.3. PESTEL analysis
- 4.4. Market Entropy
- 4.5. Patent/Trademark Analysis
- 5. Global Cranberry Industry Analysis, Insights and Forecast, 2020-2032
- 5.1. Market Analysis, Insights and Forecast - by Production Analysis
- 5.2. Market Analysis, Insights and Forecast - by Consumption Analysis
- 5.3. Market Analysis, Insights and Forecast - by Import Market Analysis (Value & Volume)
- 5.4. Market Analysis, Insights and Forecast - by Export Market Analysis (Value & Volume)
- 5.5. Market Analysis, Insights and Forecast - by Price Trend Analysis
- 5.6. Market Analysis, Insights and Forecast - by Region
- 5.6.1. North America
- 5.6.2. Europe
- 5.6.3. Asia Pacific
- 5.6.4. South America
- 5.6.5. Africa
- 5.1. Market Analysis, Insights and Forecast - by Production Analysis
- 6. North America Cranberry Industry Analysis, Insights and Forecast, 2020-2032
- 6.1. Market Analysis, Insights and Forecast - by Production Analysis
- 6.2. Market Analysis, Insights and Forecast - by Consumption Analysis
- 6.3. Market Analysis, Insights and Forecast - by Import Market Analysis (Value & Volume)
- 6.4. Market Analysis, Insights and Forecast - by Export Market Analysis (Value & Volume)
- 6.5. Market Analysis, Insights and Forecast - by Price Trend Analysis
- 6.1. Market Analysis, Insights and Forecast - by Production Analysis
- 7. Europe Cranberry Industry Analysis, Insights and Forecast, 2020-2032
- 7.1. Market Analysis, Insights and Forecast - by Production Analysis
- 7.2. Market Analysis, Insights and Forecast - by Consumption Analysis
- 7.3. Market Analysis, Insights and Forecast - by Import Market Analysis (Value & Volume)
- 7.4. Market Analysis, Insights and Forecast - by Export Market Analysis (Value & Volume)
- 7.5. Market Analysis, Insights and Forecast - by Price Trend Analysis
- 7.1. Market Analysis, Insights and Forecast - by Production Analysis
- 8. Asia Pacific Cranberry Industry Analysis, Insights and Forecast, 2020-2032
- 8.1. Market Analysis, Insights and Forecast - by Production Analysis
- 8.2. Market Analysis, Insights and Forecast - by Consumption Analysis
- 8.3. Market Analysis, Insights and Forecast - by Import Market Analysis (Value & Volume)
- 8.4. Market Analysis, Insights and Forecast - by Export Market Analysis (Value & Volume)
- 8.5. Market Analysis, Insights and Forecast - by Price Trend Analysis
- 8.1. Market Analysis, Insights and Forecast - by Production Analysis
- 9. South America Cranberry Industry Analysis, Insights and Forecast, 2020-2032
- 9.1. Market Analysis, Insights and Forecast - by Production Analysis
- 9.2. Market Analysis, Insights and Forecast - by Consumption Analysis
- 9.3. Market Analysis, Insights and Forecast - by Import Market Analysis (Value & Volume)
- 9.4. Market Analysis, Insights and Forecast - by Export Market Analysis (Value & Volume)
- 9.5. Market Analysis, Insights and Forecast - by Price Trend Analysis
- 9.1. Market Analysis, Insights and Forecast - by Production Analysis
- 10. Africa Cranberry Industry Analysis, Insights and Forecast, 2020-2032
- 10.1. Market Analysis, Insights and Forecast - by Production Analysis
- 10.2. Market Analysis, Insights and Forecast - by Consumption Analysis
- 10.3. Market Analysis, Insights and Forecast - by Import Market Analysis (Value & Volume)
- 10.4. Market Analysis, Insights and Forecast - by Export Market Analysis (Value & Volume)
- 10.5. Market Analysis, Insights and Forecast - by Price Trend Analysis
- 10.1. Market Analysis, Insights and Forecast - by Production Analysis
- 11. Competitive Analysis
- 11.1. Global Market Share Analysis 2025
- 11.2. Company Profiles
- 11.2.1 Ocean Spray Cranberries Inc.
- 11.2.1.1. Overview
- 11.2.1.2. Products
- 11.2.1.3. SWOT Analysis
- 11.2.1.4. Recent Developments
- 11.2.1.5. Financials (Based on Availability)
- 11.2.2 Northland Cranberries Inc.
- 11.2.2.1. Overview
- 11.2.2.2. Products
- 11.2.2.3. SWOT Analysis
- 11.2.2.4. Recent Developments
- 11.2.2.5. Financials (Based on Availability)
- 11.2.3 Cape Cod Cranberry Growers' Association
- 11.2.3.1. Overview
- 11.2.3.2. Products
- 11.2.3.3. SWOT Analysis
- 11.2.3.4. Recent Developments
- 11.2.3.5. Financials (Based on Availability)
- 11.2.4 Canadian Cranberry Growers Association
- 11.2.4.1. Overview
- 11.2.4.2. Products
- 11.2.4.3. SWOT Analysis
- 11.2.4.4. Recent Developments
- 11.2.4.5. Financials (Based on Availability)
- 11.2.5 Wisconsin Cranberry Cooperative
- 11.2.5.1. Overview
- 11.2.5.2. Products
- 11.2.5.3. SWOT Analysis
- 11.2.5.4. Recent Developments
- 11.2.5.5. Financials (Based on Availability)
- 11.2.1 Ocean Spray Cranberries Inc.
List of Figures
- Figure 1: Global Cranberry Industry Revenue Breakdown (billion, %) by Region 2025 & 2033
- Figure 2: North America Cranberry Industry Revenue (billion), by Production Analysis 2025 & 2033
- Figure 3: North America Cranberry Industry Revenue Share (%), by Production Analysis 2025 & 2033
- Figure 4: North America Cranberry Industry Revenue (billion), by Consumption Analysis 2025 & 2033
- Figure 5: North America Cranberry Industry Revenue Share (%), by Consumption Analysis 2025 & 2033
- Figure 6: North America Cranberry Industry Revenue (billion), by Import Market Analysis (Value & Volume) 2025 & 2033
- Figure 7: North America Cranberry Industry Revenue Share (%), by Import Market Analysis (Value & Volume) 2025 & 2033
- Figure 8: North America Cranberry Industry Revenue (billion), by Export Market Analysis (Value & Volume) 2025 & 2033
- Figure 9: North America Cranberry Industry Revenue Share (%), by Export Market Analysis (Value & Volume) 2025 & 2033
- Figure 10: North America Cranberry Industry Revenue (billion), by Price Trend Analysis 2025 & 2033
- Figure 11: North America Cranberry Industry Revenue Share (%), by Price Trend Analysis 2025 & 2033
- Figure 12: North America Cranberry Industry Revenue (billion), by Country 2025 & 2033
- Figure 13: North America Cranberry Industry Revenue Share (%), by Country 2025 & 2033
- Figure 14: Europe Cranberry Industry Revenue (billion), by Production Analysis 2025 & 2033
- Figure 15: Europe Cranberry Industry Revenue Share (%), by Production Analysis 2025 & 2033
- Figure 16: Europe Cranberry Industry Revenue (billion), by Consumption Analysis 2025 & 2033
- Figure 17: Europe Cranberry Industry Revenue Share (%), by Consumption Analysis 2025 & 2033
- Figure 18: Europe Cranberry Industry Revenue (billion), by Import Market Analysis (Value & Volume) 2025 & 2033
- Figure 19: Europe Cranberry Industry Revenue Share (%), by Import Market Analysis (Value & Volume) 2025 & 2033
- Figure 20: Europe Cranberry Industry Revenue (billion), by Export Market Analysis (Value & Volume) 2025 & 2033
- Figure 21: Europe Cranberry Industry Revenue Share (%), by Export Market Analysis (Value & Volume) 2025 & 2033
- Figure 22: Europe Cranberry Industry Revenue (billion), by Price Trend Analysis 2025 & 2033
- Figure 23: Europe Cranberry Industry Revenue Share (%), by Price Trend Analysis 2025 & 2033
- Figure 24: Europe Cranberry Industry Revenue (billion), by Country 2025 & 2033
- Figure 25: Europe Cranberry Industry Revenue Share (%), by Country 2025 & 2033
- Figure 26: Asia Pacific Cranberry Industry Revenue (billion), by Production Analysis 2025 & 2033
- Figure 27: Asia Pacific Cranberry Industry Revenue Share (%), by Production Analysis 2025 & 2033
- Figure 28: Asia Pacific Cranberry Industry Revenue (billion), by Consumption Analysis 2025 & 2033
- Figure 29: Asia Pacific Cranberry Industry Revenue Share (%), by Consumption Analysis 2025 & 2033
- Figure 30: Asia Pacific Cranberry Industry Revenue (billion), by Import Market Analysis (Value & Volume) 2025 & 2033
- Figure 31: Asia Pacific Cranberry Industry Revenue Share (%), by Import Market Analysis (Value & Volume) 2025 & 2033
- Figure 32: Asia Pacific Cranberry Industry Revenue (billion), by Export Market Analysis (Value & Volume) 2025 & 2033
- Figure 33: Asia Pacific Cranberry Industry Revenue Share (%), by Export Market Analysis (Value & Volume) 2025 & 2033
- Figure 34: Asia Pacific Cranberry Industry Revenue (billion), by Price Trend Analysis 2025 & 2033
- Figure 35: Asia Pacific Cranberry Industry Revenue Share (%), by Price Trend Analysis 2025 & 2033
- Figure 36: Asia Pacific Cranberry Industry Revenue (billion), by Country 2025 & 2033
- Figure 37: Asia Pacific Cranberry Industry Revenue Share (%), by Country 2025 & 2033
- Figure 38: South America Cranberry Industry Revenue (billion), by Production Analysis 2025 & 2033
- Figure 39: South America Cranberry Industry Revenue Share (%), by Production Analysis 2025 & 2033
- Figure 40: South America Cranberry Industry Revenue (billion), by Consumption Analysis 2025 & 2033
- Figure 41: South America Cranberry Industry Revenue Share (%), by Consumption Analysis 2025 & 2033
- Figure 42: South America Cranberry Industry Revenue (billion), by Import Market Analysis (Value & Volume) 2025 & 2033
- Figure 43: South America Cranberry Industry Revenue Share (%), by Import Market Analysis (Value & Volume) 2025 & 2033
- Figure 44: South America Cranberry Industry Revenue (billion), by Export Market Analysis (Value & Volume) 2025 & 2033
- Figure 45: South America Cranberry Industry Revenue Share (%), by Export Market Analysis (Value & Volume) 2025 & 2033
- Figure 46: South America Cranberry Industry Revenue (billion), by Price Trend Analysis 2025 & 2033
- Figure 47: South America Cranberry Industry Revenue Share (%), by Price Trend Analysis 2025 & 2033
- Figure 48: South America Cranberry Industry Revenue (billion), by Country 2025 & 2033
- Figure 49: South America Cranberry Industry Revenue Share (%), by Country 2025 & 2033
- Figure 50: Africa Cranberry Industry Revenue (billion), by Production Analysis 2025 & 2033
- Figure 51: Africa Cranberry Industry Revenue Share (%), by Production Analysis 2025 & 2033
- Figure 52: Africa Cranberry Industry Revenue (billion), by Consumption Analysis 2025 & 2033
- Figure 53: Africa Cranberry Industry Revenue Share (%), by Consumption Analysis 2025 & 2033
- Figure 54: Africa Cranberry Industry Revenue (billion), by Import Market Analysis (Value & Volume) 2025 & 2033
- Figure 55: Africa Cranberry Industry Revenue Share (%), by Import Market Analysis (Value & Volume) 2025 & 2033
- Figure 56: Africa Cranberry Industry Revenue (billion), by Export Market Analysis (Value & Volume) 2025 & 2033
- Figure 57: Africa Cranberry Industry Revenue Share (%), by Export Market Analysis (Value & Volume) 2025 & 2033
- Figure 58: Africa Cranberry Industry Revenue (billion), by Price Trend Analysis 2025 & 2033
- Figure 59: Africa Cranberry Industry Revenue Share (%), by Price Trend Analysis 2025 & 2033
- Figure 60: Africa Cranberry Industry Revenue (billion), by Country 2025 & 2033
- Figure 61: Africa Cranberry Industry Revenue Share (%), by Country 2025 & 2033
List of Tables
- Table 1: Global Cranberry Industry Revenue billion Forecast, by Production Analysis 2020 & 2033
- Table 2: Global Cranberry Industry Revenue billion Forecast, by Consumption Analysis 2020 & 2033
- Table 3: Global Cranberry Industry Revenue billion Forecast, by Import Market Analysis (Value & Volume) 2020 & 2033
- Table 4: Global Cranberry Industry Revenue billion Forecast, by Export Market Analysis (Value & Volume) 2020 & 2033
- Table 5: Global Cranberry Industry Revenue billion Forecast, by Price Trend Analysis 2020 & 2033
- Table 6: Global Cranberry Industry Revenue billion Forecast, by Region 2020 & 2033
- Table 7: Global Cranberry Industry Revenue billion Forecast, by Production Analysis 2020 & 2033
- Table 8: Global Cranberry Industry Revenue billion Forecast, by Consumption Analysis 2020 & 2033
- Table 9: Global Cranberry Industry Revenue billion Forecast, by Import Market Analysis (Value & Volume) 2020 & 2033
- Table 10: Global Cranberry Industry Revenue billion Forecast, by Export Market Analysis (Value & Volume) 2020 & 2033
- Table 11: Global Cranberry Industry Revenue billion Forecast, by Price Trend Analysis 2020 & 2033
- Table 12: Global Cranberry Industry Revenue billion Forecast, by Country 2020 & 2033
- Table 13: United States Cranberry Industry Revenue (billion) Forecast, by Application 2020 & 2033
- Table 14: Global Cranberry Industry Revenue billion Forecast, by Production Analysis 2020 & 2033
- Table 15: Global Cranberry Industry Revenue billion Forecast, by Consumption Analysis 2020 & 2033
- Table 16: Global Cranberry Industry Revenue billion Forecast, by Import Market Analysis (Value & Volume) 2020 & 2033
- Table 17: Global Cranberry Industry Revenue billion Forecast, by Export Market Analysis (Value & Volume) 2020 & 2033
- Table 18: Global Cranberry Industry Revenue billion Forecast, by Price Trend Analysis 2020 & 2033
- Table 19: Global Cranberry Industry Revenue billion Forecast, by Country 2020 & 2033
- Table 20: Germany Cranberry Industry Revenue (billion) Forecast, by Application 2020 & 2033
- Table 21: Global Cranberry Industry Revenue billion Forecast, by Production Analysis 2020 & 2033
- Table 22: Global Cranberry Industry Revenue billion Forecast, by Consumption Analysis 2020 & 2033
- Table 23: Global Cranberry Industry Revenue billion Forecast, by Import Market Analysis (Value & Volume) 2020 & 2033
- Table 24: Global Cranberry Industry Revenue billion Forecast, by Export Market Analysis (Value & Volume) 2020 & 2033
- Table 25: Global Cranberry Industry Revenue billion Forecast, by Price Trend Analysis 2020 & 2033
- Table 26: Global Cranberry Industry Revenue billion Forecast, by Country 2020 & 2033
- Table 27: China Cranberry Industry Revenue (billion) Forecast, by Application 2020 & 2033
- Table 28: Global Cranberry Industry Revenue billion Forecast, by Production Analysis 2020 & 2033
- Table 29: Global Cranberry Industry Revenue billion Forecast, by Consumption Analysis 2020 & 2033
- Table 30: Global Cranberry Industry Revenue billion Forecast, by Import Market Analysis (Value & Volume) 2020 & 2033
- Table 31: Global Cranberry Industry Revenue billion Forecast, by Export Market Analysis (Value & Volume) 2020 & 2033
- Table 32: Global Cranberry Industry Revenue billion Forecast, by Price Trend Analysis 2020 & 2033
- Table 33: Global Cranberry Industry Revenue billion Forecast, by Country 2020 & 2033
- Table 34: Chile Cranberry Industry Revenue (billion) Forecast, by Application 2020 & 2033
- Table 35: Global Cranberry Industry Revenue billion Forecast, by Production Analysis 2020 & 2033
- Table 36: Global Cranberry Industry Revenue billion Forecast, by Consumption Analysis 2020 & 2033
- Table 37: Global Cranberry Industry Revenue billion Forecast, by Import Market Analysis (Value & Volume) 2020 & 2033
- Table 38: Global Cranberry Industry Revenue billion Forecast, by Export Market Analysis (Value & Volume) 2020 & 2033
- Table 39: Global Cranberry Industry Revenue billion Forecast, by Price Trend Analysis 2020 & 2033
- Table 40: Global Cranberry Industry Revenue billion Forecast, by Country 2020 & 2033
- Table 41: South Africa Cranberry Industry Revenue (billion) Forecast, by Application 2020 & 2033
Frequently Asked Questions
1. What is the projected Compound Annual Growth Rate (CAGR) of the Cranberry Industry?
The projected CAGR is approximately 4.2%.
2. Which companies are prominent players in the Cranberry Industry?
Key companies in the market include Ocean Spray Cranberries, Inc. , Northland Cranberries, Inc. , Cape Cod Cranberry Growers' Association , Canadian Cranberry Growers Association, Wisconsin Cranberry Cooperative .
3. What are the main segments of the Cranberry Industry?
The market segments include Production Analysis, Consumption Analysis, Import Market Analysis (Value & Volume), Export Market Analysis (Value & Volume), Price Trend Analysis.
4. Can you provide details about the market size?
The market size is estimated to be USD 2.9 billion as of 2022.
5. What are some drivers contributing to market growth?
Rise in Percentage of Area Harvested Under Almond Cultivation; Demand for Healthy Snacking Options.
6. What are the notable trends driving market growth?
Increasing Demand from Processing Industry.
7. Are there any restraints impacting market growth?
Water Scarcity in Almond Producing Regions; Drop in the Prices of Almonds.
8. Can you provide examples of recent developments in the market?
March 2022: Ocean Spray Cranberries, Inc., the agricultural cooperative owned by more than 700 farmer families, and Canomiks, a startup technology company transforming the functional food and beverage industry, announced research leveraging Canomiks' A.I. based technology platform to test and certify the biological efficacy of the cranberry. The relationship with Canomiks, through Ocean Spray's existing partnership with the incubator Plug and Play, enables the company further to validate the superfruit nature of cranberry's biological efficacy.
9. What pricing options are available for accessing the report?
Pricing options include single-user, multi-user, and enterprise licenses priced at USD 4750, USD 5250, and USD 8750 respectively.
10. Is the market size provided in terms of value or volume?
The market size is provided in terms of value, measured in billion.
11. Are there any specific market keywords associated with the report?
Yes, the market keyword associated with the report is "Cranberry Industry," which aids in identifying and referencing the specific market segment covered.
12. How do I determine which pricing option suits my needs best?
The pricing options vary based on user requirements and access needs. Individual users may opt for single-user licenses, while businesses requiring broader access may choose multi-user or enterprise licenses for cost-effective access to the report.
13. Are there any additional resources or data provided in the Cranberry Industry report?
While the report offers comprehensive insights, it's advisable to review the specific contents or supplementary materials provided to ascertain if additional resources or data are available.
14. How can I stay updated on further developments or reports in the Cranberry Industry?
To stay informed about further developments, trends, and reports in the Cranberry Industry, consider subscribing to industry newsletters, following relevant companies and organizations, or regularly checking reputable industry news sources and publications.
Methodology
Step 1 - Identification of Relevant Samples Size from Population Database


Step 2 - Approaches for Defining Global Market Size (Value, Volume* & Price*)

Note*: In applicable scenarios
Step 3 - Data Sources
Primary Research
- Web Analytics
- Survey Reports
- Research Institute
- Latest Research Reports
- Opinion Leaders
Secondary Research
- Annual Reports
- White Paper
- Latest Press Release
- Industry Association
- Paid Database
- Investor Presentations

Step 4 - Data Triangulation
Involves using different sources of information in order to increase the validity of a study
These sources are likely to be stakeholders in a program - participants, other researchers, program staff, other community members, and so on.
Then we put all data in single framework & apply various statistical tools to find out the dynamic on the market.
During the analysis stage, feedback from the stakeholder groups would be compared to determine areas of agreement as well as areas of divergence