

Key Insights
The global calendar market is projected for robust growth, with an estimated market size of $2.72 billion in 2025, anticipated to expand at a Compound Annual Growth Rate (CAGR) of 4.93% through 2033. This sustained expansion is driven by a combination of enduring demand and evolving consumer preferences. Factory direct sales are expected to maintain dominance due to economies of scale and direct customer engagement. However, the rapidly growing online sales channel, offering convenience and broad product accessibility, is poised for accelerated growth, significantly contributing to market dynamism. The inherent versatility of wall calendars, a staple in households and offices, will ensure market stability, while desk calendars are expected to see increased adoption in professional environments, reflecting a growing emphasis on personalized workspace organization.
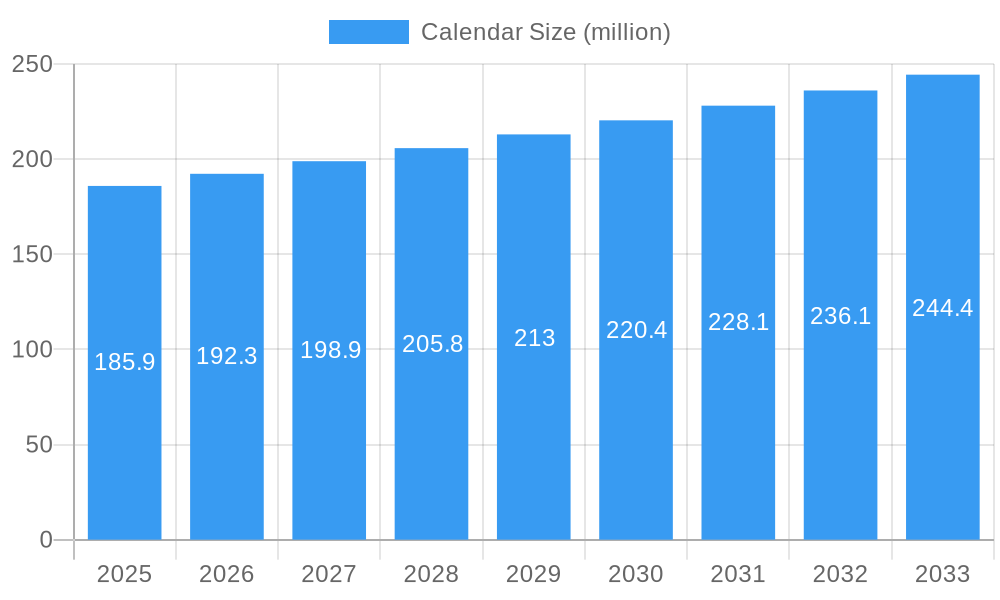
Calendar Market Size (In Billion)
Key drivers propelling this market include the persistent need for effective time management tools in both personal and professional spheres, the rising popularity of customizable and personalized calendars as promotional items and gifts, and the increasing integration of aesthetic design into functional stationery. Technological advancements in printing and design facilitate a wider array of innovative calendar formats and features, catering to diverse consumer preferences. Despite the digital era, the tangible appeal and decorative value of physical calendars ensure their continued relevance. While online sales present significant growth opportunities, challenges such as intense competition and the necessity for efficient supply chain management will shape the competitive landscape. The market's resilience stems from its adaptability to changing consumer behaviors and its ability to leverage both established distribution channels and emerging digital platforms.
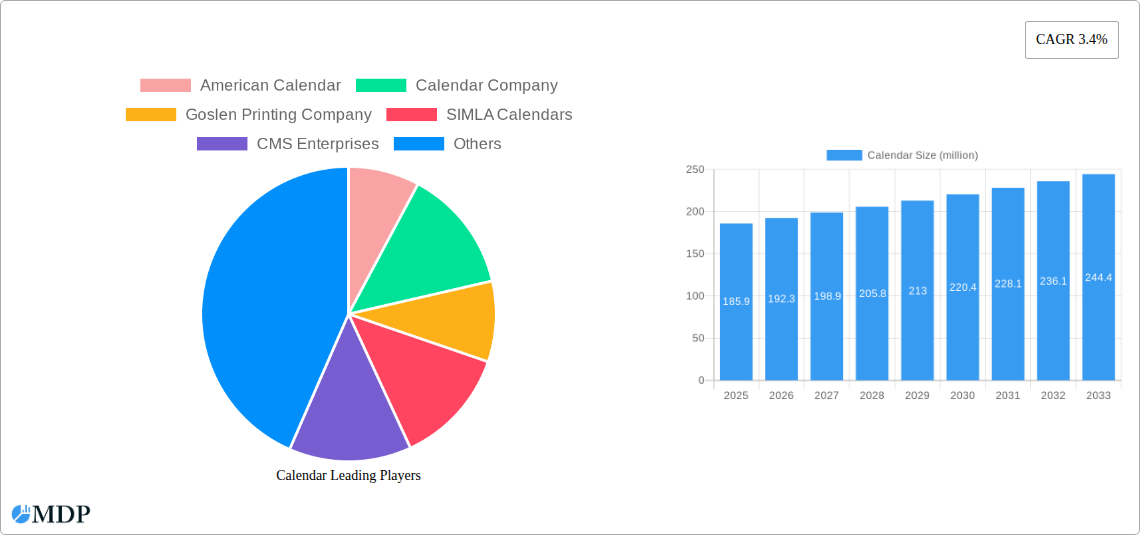
Calendar Company Market Share
This comprehensive report offers a detailed analysis of the global calendar market, providing crucial insights for industry stakeholders from 2019 to 2033. Examining key segments including Wall Calendars and Desk Calendars, alongside distribution channels such as Factory Direct Sales, Retail Store Sales, and Online Sales, this report explores market dynamics, future trends, and strategic opportunities. With a base year of 2025 and a forecast period extending to 2033, it equips businesses with actionable intelligence to navigate this evolving landscape, projected to reach $2.72 billion in value.
Calendar Market Dynamics & Concentration
The global calendar market exhibits a moderate concentration, with a few key players dominating market share. Innovation drivers are primarily focused on enhanced design aesthetics, personalization options, and the integration of digital features. Regulatory frameworks generally support the industry, with a focus on material sourcing and printing standards, though varying by region. Product substitutes, including digital calendars and scheduling apps, pose a consistent challenge, pushing manufacturers to emphasize the tactile and decorative appeal of physical calendars. End-user trends show a growing demand for sustainable and eco-friendly calendar options. Merger and acquisition activities have been sporadic, with approximately xx significant deals recorded during the historical period, aimed at expanding product portfolios and market reach.
- Market Share: Leading companies hold an estimated xx% of the global market share.
- M&A Activity: Approximately xx merger and acquisition deals were observed in the historical period.
- Innovation Drivers: Personalized designs, eco-friendly materials, integrated digital functionalities.
- Regulatory Focus: Sustainable material sourcing, printing standards, and intellectual property.
- End-User Preferences: Customization, unique themes, sustainable production methods.
Calendar Industry Trends & Analysis
The calendar industry is experiencing robust growth, propelled by evolving consumer preferences and technological advancements. The estimated Compound Annual Growth Rate (CAGR) for the forecast period (2025-2033) is projected to be xx%, indicating sustained expansion. Market penetration of customized and niche calendars is rising as consumers seek unique and personalized items for both practical use and decorative purposes. The industry is witnessing a surge in demand for premium wall calendars and feature-rich desk calendars, catering to diverse user needs. E-commerce has become a pivotal sales channel, with online sales accounting for a significant portion of revenue, demonstrating a shift in consumer purchasing behavior. Technological disruptions, such as advanced printing techniques and material innovations, are enabling more intricate designs and eco-friendly production processes, enhancing the competitive edge of manufacturers. The competitive landscape is characterized by both established players and emerging niche manufacturers, driving innovation and a focus on customer-centric product development. The demand for calendars as promotional items by businesses remains a strong market driver.
Leading Markets & Segments in Calendar
The Wall Calendar segment consistently dominates the global market, driven by its widespread application in homes and offices for both functional and decorative purposes. In terms of application, Store Sales and Online Sales are experiencing parallel growth, with online channels offering greater reach and customization options. Factory Direct Sales cater to bulk orders, particularly for corporate promotional calendars. Geographically, Asia-Pacific, particularly Cangnan County, Zhejiang, emerges as a leading manufacturing hub due to cost-effectiveness and a well-established printing infrastructure. North America and Europe remain significant consumption markets, with a high demand for premium and custom-designed calendars.
- Dominant Type: Wall Calendars represent the largest segment, favored for their visual appeal and widespread use.
- Key Application Channels: Store Sales and Online Sales are equally crucial, with Online Sales showing accelerated growth due to convenience and customization.
- Regional Manufacturing Hubs: Cangnan County, Zhejiang, is a global leader in calendar production, leveraging efficient supply chains and manufacturing capabilities.
- Consumption Markets: North America and Europe exhibit strong demand for high-quality, personalized calendars.
- Economic Policies: Favorable trade policies and investment in printing technology in manufacturing regions contribute to their dominance.
- Infrastructure: Robust logistics and supply chain networks in key regions facilitate market accessibility.
Calendar Product Developments
Calendar manufacturers are continually innovating, focusing on enhanced aesthetics, personalized content, and eco-friendly materials. Advancements in printing technology allow for vibrant, high-resolution imagery and unique finishes, differentiating products in a competitive market. The integration of interactive elements, such as QR codes linking to digital content or augmented reality features, is a growing trend, bridging the gap between physical and digital calendars. This focus on unique selling propositions and superior design provides a significant competitive advantage, meeting the evolving demands for both functional and decorative wall and desk calendars.
Key Drivers of Calendar Growth
The calendar market is propelled by several key drivers. The enduring appeal of tangible products in an increasingly digital world provides a foundational demand. The persistent use of calendars for promotional purposes by businesses, seeking cost-effective and consistent brand visibility, is a significant economic factor. Furthermore, technological advancements in printing and material science enable manufacturers to offer more sustainable and aesthetically pleasing products, aligning with growing environmental consciousness among consumers. Regional economic growth, particularly in emerging markets, also contributes to increased disposable income and a subsequent rise in demand for such decorative and functional items.
Challenges in the Calendar Market
Despite positive growth, the calendar market faces several challenges. The primary restraint comes from the widespread availability and increasing adoption of digital calendar applications and smartphone scheduling tools, presenting a direct substitute. Supply chain disruptions, including fluctuations in paper prices and ink availability, can impact production costs and lead times. Intense competition among a large number of manufacturers, both large and small, can lead to price pressures and reduced profit margins. Additionally, evolving consumer preferences towards instant digital gratification can sometimes overshadow the appeal of physical products, requiring continuous marketing efforts to highlight the unique benefits of printed calendars.
Emerging Opportunities in Calendar
Emerging opportunities in the calendar market are largely driven by personalization and niche customization. The growing demand for eco-friendly and sustainably sourced calendars presents a significant avenue for growth, allowing companies to cater to environmentally conscious consumers. Strategic partnerships with artists, photographers, and content creators can lead to unique and high-demand calendar designs, appealing to specific interest groups. Furthermore, leveraging e-commerce platforms for global reach and exploring the potential of augmented reality integration in calendar design can unlock new revenue streams and enhance customer engagement, offering a futuristic dimension to a traditional product.
Leading Players in the Calendar Sector
- American Calendar
- Calendar Company
- Goslen Printing Company
- SIMLA Calendars
- CMS Enterprises
- Calendars from India
- Surya Offset Printers
- Kalai Calendars
- Cangnan County
- Zhejiang
- Guangzhou Bailing Color Printing
- Ningbo Baiyun printing
- Shenzhen JinHaoYi Color Printing
Key Milestones in Calendar Industry
- 2019: Increased adoption of sustainable printing practices in major manufacturing regions.
- 2020: Surge in demand for personalized calendars due to remote work trends.
- 2021: Expansion of online sales channels and e-commerce integration by key players.
- 2022: Introduction of advanced material printing techniques for enhanced durability and aesthetics.
- 2023: Growing focus on eco-friendly paper sourcing and biodegradable materials.
- 2024: Increased investment in digital integration features within physical calendars.
Strategic Outlook for Calendar Market
The strategic outlook for the calendar market is one of sustained, albeit moderate, growth, driven by innovation and niche specialization. Companies that focus on premium quality, unique design offerings, and sustainable production practices are well-positioned for success. Embracing digital integration and robust online sales strategies will be crucial for expanding market reach and catering to evolving consumer expectations. Exploring collaborative ventures with artists and influencers can further enhance brand appeal and create exclusive product lines. Ultimately, a customer-centric approach, emphasizing personalization and environmental responsibility, will accelerate growth in this dynamic market.
Calendar Segmentation
-
1. Application
- 1.1. Factory Direct Sales
- 1.2. Store Sales
- 1.3. Online Sales
-
2. Types
- 2.1. Wall Calendar
- 2.2. Desk Calendar
Calendar Segmentation By Geography
-
1. North America
- 1.1. United States
- 1.2. Canada
- 1.3. Mexico
-
2. South America
- 2.1. Brazil
- 2.2. Argentina
- 2.3. Rest of South America
-
3. Europe
- 3.1. United Kingdom
- 3.2. Germany
- 3.3. France
- 3.4. Italy
- 3.5. Spain
- 3.6. Russia
- 3.7. Benelux
- 3.8. Nordics
- 3.9. Rest of Europe
-
4. Middle East & Africa
- 4.1. Turkey
- 4.2. Israel
- 4.3. GCC
- 4.4. North Africa
- 4.5. South Africa
- 4.6. Rest of Middle East & Africa
-
5. Asia Pacific
- 5.1. China
- 5.2. India
- 5.3. Japan
- 5.4. South Korea
- 5.5. ASEAN
- 5.6. Oceania
- 5.7. Rest of Asia Pacific
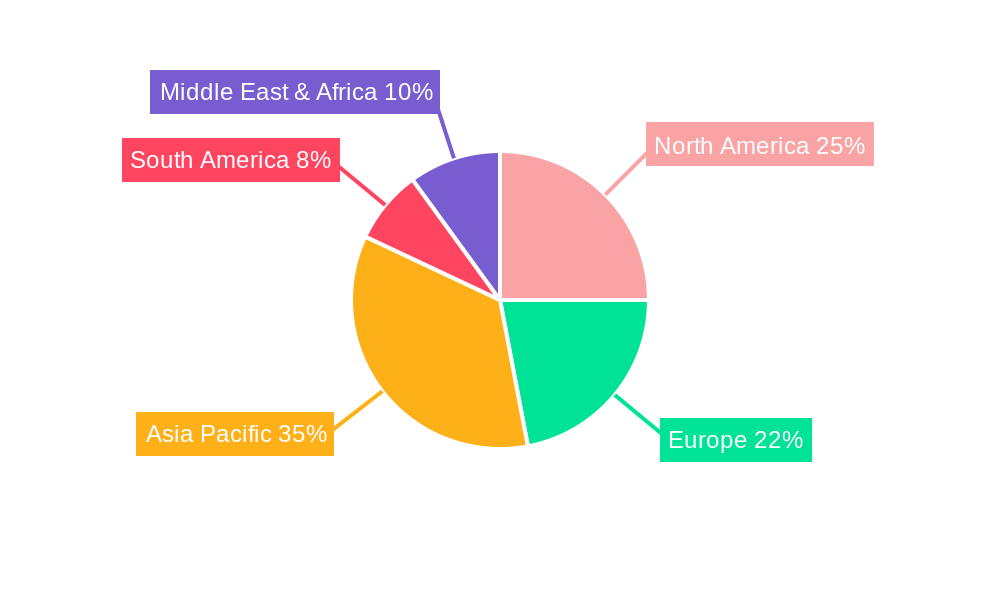
Calendar Regional Market Share
Geographic Coverage of Calendar
Calendar REPORT HIGHLIGHTS
| Aspects | Details |
|---|---|
| Study Period | 2020-2034 |
| Base Year | 2025 |
| Estimated Year | 2026 |
| Forecast Period | 2026-2034 |
| Historical Period | 2020-2025 |
| Growth Rate | CAGR of 4.93% from 2020-2034 |
| Segmentation |
|
Table of Contents
- 1. Introduction
- 1.1. Research Scope
- 1.2. Market Segmentation
- 1.3. Research Methodology
- 1.4. Definitions and Assumptions
- 2. Executive Summary
- 2.1. Introduction
- 3. Market Dynamics
- 3.1. Introduction
- 3.2. Market Drivers
- 3.3. Market Restrains
- 3.4. Market Trends
- 4. Market Factor Analysis
- 4.1. Porters Five Forces
- 4.2. Supply/Value Chain
- 4.3. PESTEL analysis
- 4.4. Market Entropy
- 4.5. Patent/Trademark Analysis
- 5. Global Calendar Analysis, Insights and Forecast, 2020-2032
- 5.1. Market Analysis, Insights and Forecast - by Application
- 5.1.1. Factory Direct Sales
- 5.1.2. Store Sales
- 5.1.3. Online Sales
- 5.2. Market Analysis, Insights and Forecast - by Types
- 5.2.1. Wall Calendar
- 5.2.2. Desk Calendar
- 5.3. Market Analysis, Insights and Forecast - by Region
- 5.3.1. North America
- 5.3.2. South America
- 5.3.3. Europe
- 5.3.4. Middle East & Africa
- 5.3.5. Asia Pacific
- 5.1. Market Analysis, Insights and Forecast - by Application
- 6. North America Calendar Analysis, Insights and Forecast, 2020-2032
- 6.1. Market Analysis, Insights and Forecast - by Application
- 6.1.1. Factory Direct Sales
- 6.1.2. Store Sales
- 6.1.3. Online Sales
- 6.2. Market Analysis, Insights and Forecast - by Types
- 6.2.1. Wall Calendar
- 6.2.2. Desk Calendar
- 6.1. Market Analysis, Insights and Forecast - by Application
- 7. South America Calendar Analysis, Insights and Forecast, 2020-2032
- 7.1. Market Analysis, Insights and Forecast - by Application
- 7.1.1. Factory Direct Sales
- 7.1.2. Store Sales
- 7.1.3. Online Sales
- 7.2. Market Analysis, Insights and Forecast - by Types
- 7.2.1. Wall Calendar
- 7.2.2. Desk Calendar
- 7.1. Market Analysis, Insights and Forecast - by Application
- 8. Europe Calendar Analysis, Insights and Forecast, 2020-2032
- 8.1. Market Analysis, Insights and Forecast - by Application
- 8.1.1. Factory Direct Sales
- 8.1.2. Store Sales
- 8.1.3. Online Sales
- 8.2. Market Analysis, Insights and Forecast - by Types
- 8.2.1. Wall Calendar
- 8.2.2. Desk Calendar
- 8.1. Market Analysis, Insights and Forecast - by Application
- 9. Middle East & Africa Calendar Analysis, Insights and Forecast, 2020-2032
- 9.1. Market Analysis, Insights and Forecast - by Application
- 9.1.1. Factory Direct Sales
- 9.1.2. Store Sales
- 9.1.3. Online Sales
- 9.2. Market Analysis, Insights and Forecast - by Types
- 9.2.1. Wall Calendar
- 9.2.2. Desk Calendar
- 9.1. Market Analysis, Insights and Forecast - by Application
- 10. Asia Pacific Calendar Analysis, Insights and Forecast, 2020-2032
- 10.1. Market Analysis, Insights and Forecast - by Application
- 10.1.1. Factory Direct Sales
- 10.1.2. Store Sales
- 10.1.3. Online Sales
- 10.2. Market Analysis, Insights and Forecast - by Types
- 10.2.1. Wall Calendar
- 10.2.2. Desk Calendar
- 10.1. Market Analysis, Insights and Forecast - by Application
- 11. Competitive Analysis
- 11.1. Global Market Share Analysis 2025
- 11.2. Company Profiles
- 11.2.1 American Calendar
- 11.2.1.1. Overview
- 11.2.1.2. Products
- 11.2.1.3. SWOT Analysis
- 11.2.1.4. Recent Developments
- 11.2.1.5. Financials (Based on Availability)
- 11.2.2 Calendar Company
- 11.2.2.1. Overview
- 11.2.2.2. Products
- 11.2.2.3. SWOT Analysis
- 11.2.2.4. Recent Developments
- 11.2.2.5. Financials (Based on Availability)
- 11.2.3 Goslen Printing Company
- 11.2.3.1. Overview
- 11.2.3.2. Products
- 11.2.3.3. SWOT Analysis
- 11.2.3.4. Recent Developments
- 11.2.3.5. Financials (Based on Availability)
- 11.2.4 SIMLA Calendars
- 11.2.4.1. Overview
- 11.2.4.2. Products
- 11.2.4.3. SWOT Analysis
- 11.2.4.4. Recent Developments
- 11.2.4.5. Financials (Based on Availability)
- 11.2.5 CMS Enterprises
- 11.2.5.1. Overview
- 11.2.5.2. Products
- 11.2.5.3. SWOT Analysis
- 11.2.5.4. Recent Developments
- 11.2.5.5. Financials (Based on Availability)
- 11.2.6 Calendars from India
- 11.2.6.1. Overview
- 11.2.6.2. Products
- 11.2.6.3. SWOT Analysis
- 11.2.6.4. Recent Developments
- 11.2.6.5. Financials (Based on Availability)
- 11.2.7 Surya Offset Printers
- 11.2.7.1. Overview
- 11.2.7.2. Products
- 11.2.7.3. SWOT Analysis
- 11.2.7.4. Recent Developments
- 11.2.7.5. Financials (Based on Availability)
- 11.2.8 Kalai Calendars
- 11.2.8.1. Overview
- 11.2.8.2. Products
- 11.2.8.3. SWOT Analysis
- 11.2.8.4. Recent Developments
- 11.2.8.5. Financials (Based on Availability)
- 11.2.9 Cangnan County
- 11.2.9.1. Overview
- 11.2.9.2. Products
- 11.2.9.3. SWOT Analysis
- 11.2.9.4. Recent Developments
- 11.2.9.5. Financials (Based on Availability)
- 11.2.10 Zhejiang
- 11.2.10.1. Overview
- 11.2.10.2. Products
- 11.2.10.3. SWOT Analysis
- 11.2.10.4. Recent Developments
- 11.2.10.5. Financials (Based on Availability)
- 11.2.11 Guangzhou Bailing Color Printing
- 11.2.11.1. Overview
- 11.2.11.2. Products
- 11.2.11.3. SWOT Analysis
- 11.2.11.4. Recent Developments
- 11.2.11.5. Financials (Based on Availability)
- 11.2.12 Ningbo Baiyun printing
- 11.2.12.1. Overview
- 11.2.12.2. Products
- 11.2.12.3. SWOT Analysis
- 11.2.12.4. Recent Developments
- 11.2.12.5. Financials (Based on Availability)
- 11.2.13 Shenzhen JinHaoYi Color Printing
- 11.2.13.1. Overview
- 11.2.13.2. Products
- 11.2.13.3. SWOT Analysis
- 11.2.13.4. Recent Developments
- 11.2.13.5. Financials (Based on Availability)
- 11.2.14 American Calendar
- 11.2.14.1. Overview
- 11.2.14.2. Products
- 11.2.14.3. SWOT Analysis
- 11.2.14.4. Recent Developments
- 11.2.14.5. Financials (Based on Availability)
- 11.2.15 Calendar Company
- 11.2.15.1. Overview
- 11.2.15.2. Products
- 11.2.15.3. SWOT Analysis
- 11.2.15.4. Recent Developments
- 11.2.15.5. Financials (Based on Availability)
- 11.2.16 Goslen Printing Company
- 11.2.16.1. Overview
- 11.2.16.2. Products
- 11.2.16.3. SWOT Analysis
- 11.2.16.4. Recent Developments
- 11.2.16.5. Financials (Based on Availability)
- 11.2.17 SIMLA Calendars
- 11.2.17.1. Overview
- 11.2.17.2. Products
- 11.2.17.3. SWOT Analysis
- 11.2.17.4. Recent Developments
- 11.2.17.5. Financials (Based on Availability)
- 11.2.18 CMS Enterprises
- 11.2.18.1. Overview
- 11.2.18.2. Products
- 11.2.18.3. SWOT Analysis
- 11.2.18.4. Recent Developments
- 11.2.18.5. Financials (Based on Availability)
- 11.2.19 Calendars from India
- 11.2.19.1. Overview
- 11.2.19.2. Products
- 11.2.19.3. SWOT Analysis
- 11.2.19.4. Recent Developments
- 11.2.19.5. Financials (Based on Availability)
- 11.2.20 Surya Offset Printers
- 11.2.20.1. Overview
- 11.2.20.2. Products
- 11.2.20.3. SWOT Analysis
- 11.2.20.4. Recent Developments
- 11.2.20.5. Financials (Based on Availability)
- 11.2.21 Kalai Calendars
- 11.2.21.1. Overview
- 11.2.21.2. Products
- 11.2.21.3. SWOT Analysis
- 11.2.21.4. Recent Developments
- 11.2.21.5. Financials (Based on Availability)
- 11.2.22 Cangnan County
- 11.2.22.1. Overview
- 11.2.22.2. Products
- 11.2.22.3. SWOT Analysis
- 11.2.22.4. Recent Developments
- 11.2.22.5. Financials (Based on Availability)
- 11.2.23 Zhejiang
- 11.2.23.1. Overview
- 11.2.23.2. Products
- 11.2.23.3. SWOT Analysis
- 11.2.23.4. Recent Developments
- 11.2.23.5. Financials (Based on Availability)
- 11.2.24 Guangzhou Bailing Color Printing
- 11.2.24.1. Overview
- 11.2.24.2. Products
- 11.2.24.3. SWOT Analysis
- 11.2.24.4. Recent Developments
- 11.2.24.5. Financials (Based on Availability)
- 11.2.25 Ningbo Baiyun printing
- 11.2.25.1. Overview
- 11.2.25.2. Products
- 11.2.25.3. SWOT Analysis
- 11.2.25.4. Recent Developments
- 11.2.25.5. Financials (Based on Availability)
- 11.2.26 Shenzhen JinHaoYi Color Printing
- 11.2.26.1. Overview
- 11.2.26.2. Products
- 11.2.26.3. SWOT Analysis
- 11.2.26.4. Recent Developments
- 11.2.26.5. Financials (Based on Availability)
- 11.2.1 American Calendar
List of Figures
- Figure 1: Global Calendar Revenue Breakdown (billion, %) by Region 2025 & 2033
- Figure 2: North America Calendar Revenue (billion), by Application 2025 & 2033
- Figure 3: North America Calendar Revenue Share (%), by Application 2025 & 2033
- Figure 4: North America Calendar Revenue (billion), by Types 2025 & 2033
- Figure 5: North America Calendar Revenue Share (%), by Types 2025 & 2033
- Figure 6: North America Calendar Revenue (billion), by Country 2025 & 2033
- Figure 7: North America Calendar Revenue Share (%), by Country 2025 & 2033
- Figure 8: South America Calendar Revenue (billion), by Application 2025 & 2033
- Figure 9: South America Calendar Revenue Share (%), by Application 2025 & 2033
- Figure 10: South America Calendar Revenue (billion), by Types 2025 & 2033
- Figure 11: South America Calendar Revenue Share (%), by Types 2025 & 2033
- Figure 12: South America Calendar Revenue (billion), by Country 2025 & 2033
- Figure 13: South America Calendar Revenue Share (%), by Country 2025 & 2033
- Figure 14: Europe Calendar Revenue (billion), by Application 2025 & 2033
- Figure 15: Europe Calendar Revenue Share (%), by Application 2025 & 2033
- Figure 16: Europe Calendar Revenue (billion), by Types 2025 & 2033
- Figure 17: Europe Calendar Revenue Share (%), by Types 2025 & 2033
- Figure 18: Europe Calendar Revenue (billion), by Country 2025 & 2033
- Figure 19: Europe Calendar Revenue Share (%), by Country 2025 & 2033
- Figure 20: Middle East & Africa Calendar Revenue (billion), by Application 2025 & 2033
- Figure 21: Middle East & Africa Calendar Revenue Share (%), by Application 2025 & 2033
- Figure 22: Middle East & Africa Calendar Revenue (billion), by Types 2025 & 2033
- Figure 23: Middle East & Africa Calendar Revenue Share (%), by Types 2025 & 2033
- Figure 24: Middle East & Africa Calendar Revenue (billion), by Country 2025 & 2033
- Figure 25: Middle East & Africa Calendar Revenue Share (%), by Country 2025 & 2033
- Figure 26: Asia Pacific Calendar Revenue (billion), by Application 2025 & 2033
- Figure 27: Asia Pacific Calendar Revenue Share (%), by Application 2025 & 2033
- Figure 28: Asia Pacific Calendar Revenue (billion), by Types 2025 & 2033
- Figure 29: Asia Pacific Calendar Revenue Share (%), by Types 2025 & 2033
- Figure 30: Asia Pacific Calendar Revenue (billion), by Country 2025 & 2033
- Figure 31: Asia Pacific Calendar Revenue Share (%), by Country 2025 & 2033
List of Tables
- Table 1: Global Calendar Revenue billion Forecast, by Application 2020 & 2033
- Table 2: Global Calendar Revenue billion Forecast, by Types 2020 & 2033
- Table 3: Global Calendar Revenue billion Forecast, by Region 2020 & 2033
- Table 4: Global Calendar Revenue billion Forecast, by Application 2020 & 2033
- Table 5: Global Calendar Revenue billion Forecast, by Types 2020 & 2033
- Table 6: Global Calendar Revenue billion Forecast, by Country 2020 & 2033
- Table 7: United States Calendar Revenue (billion) Forecast, by Application 2020 & 2033
- Table 8: Canada Calendar Revenue (billion) Forecast, by Application 2020 & 2033
- Table 9: Mexico Calendar Revenue (billion) Forecast, by Application 2020 & 2033
- Table 10: Global Calendar Revenue billion Forecast, by Application 2020 & 2033
- Table 11: Global Calendar Revenue billion Forecast, by Types 2020 & 2033
- Table 12: Global Calendar Revenue billion Forecast, by Country 2020 & 2033
- Table 13: Brazil Calendar Revenue (billion) Forecast, by Application 2020 & 2033
- Table 14: Argentina Calendar Revenue (billion) Forecast, by Application 2020 & 2033
- Table 15: Rest of South America Calendar Revenue (billion) Forecast, by Application 2020 & 2033
- Table 16: Global Calendar Revenue billion Forecast, by Application 2020 & 2033
- Table 17: Global Calendar Revenue billion Forecast, by Types 2020 & 2033
- Table 18: Global Calendar Revenue billion Forecast, by Country 2020 & 2033
- Table 19: United Kingdom Calendar Revenue (billion) Forecast, by Application 2020 & 2033
- Table 20: Germany Calendar Revenue (billion) Forecast, by Application 2020 & 2033
- Table 21: France Calendar Revenue (billion) Forecast, by Application 2020 & 2033
- Table 22: Italy Calendar Revenue (billion) Forecast, by Application 2020 & 2033
- Table 23: Spain Calendar Revenue (billion) Forecast, by Application 2020 & 2033
- Table 24: Russia Calendar Revenue (billion) Forecast, by Application 2020 & 2033
- Table 25: Benelux Calendar Revenue (billion) Forecast, by Application 2020 & 2033
- Table 26: Nordics Calendar Revenue (billion) Forecast, by Application 2020 & 2033
- Table 27: Rest of Europe Calendar Revenue (billion) Forecast, by Application 2020 & 2033
- Table 28: Global Calendar Revenue billion Forecast, by Application 2020 & 2033
- Table 29: Global Calendar Revenue billion Forecast, by Types 2020 & 2033
- Table 30: Global Calendar Revenue billion Forecast, by Country 2020 & 2033
- Table 31: Turkey Calendar Revenue (billion) Forecast, by Application 2020 & 2033
- Table 32: Israel Calendar Revenue (billion) Forecast, by Application 2020 & 2033
- Table 33: GCC Calendar Revenue (billion) Forecast, by Application 2020 & 2033
- Table 34: North Africa Calendar Revenue (billion) Forecast, by Application 2020 & 2033
- Table 35: South Africa Calendar Revenue (billion) Forecast, by Application 2020 & 2033
- Table 36: Rest of Middle East & Africa Calendar Revenue (billion) Forecast, by Application 2020 & 2033
- Table 37: Global Calendar Revenue billion Forecast, by Application 2020 & 2033
- Table 38: Global Calendar Revenue billion Forecast, by Types 2020 & 2033
- Table 39: Global Calendar Revenue billion Forecast, by Country 2020 & 2033
- Table 40: China Calendar Revenue (billion) Forecast, by Application 2020 & 2033
- Table 41: India Calendar Revenue (billion) Forecast, by Application 2020 & 2033
- Table 42: Japan Calendar Revenue (billion) Forecast, by Application 2020 & 2033
- Table 43: South Korea Calendar Revenue (billion) Forecast, by Application 2020 & 2033
- Table 44: ASEAN Calendar Revenue (billion) Forecast, by Application 2020 & 2033
- Table 45: Oceania Calendar Revenue (billion) Forecast, by Application 2020 & 2033
- Table 46: Rest of Asia Pacific Calendar Revenue (billion) Forecast, by Application 2020 & 2033
Frequently Asked Questions
1. What is the projected Compound Annual Growth Rate (CAGR) of the Calendar?
The projected CAGR is approximately 4.93%.
2. Which companies are prominent players in the Calendar?
Key companies in the market include American Calendar, Calendar Company, Goslen Printing Company, SIMLA Calendars, CMS Enterprises, Calendars from India, Surya Offset Printers, Kalai Calendars, Cangnan County, Zhejiang, Guangzhou Bailing Color Printing, Ningbo Baiyun printing, Shenzhen JinHaoYi Color Printing, American Calendar, Calendar Company, Goslen Printing Company, SIMLA Calendars, CMS Enterprises, Calendars from India, Surya Offset Printers, Kalai Calendars, Cangnan County, Zhejiang, Guangzhou Bailing Color Printing, Ningbo Baiyun printing, Shenzhen JinHaoYi Color Printing.
3. What are the main segments of the Calendar?
The market segments include Application, Types.
4. Can you provide details about the market size?
The market size is estimated to be USD 2.72 billion as of 2022.
5. What are some drivers contributing to market growth?
N/A
6. What are the notable trends driving market growth?
N/A
7. Are there any restraints impacting market growth?
N/A
8. Can you provide examples of recent developments in the market?
N/A
9. What pricing options are available for accessing the report?
Pricing options include single-user, multi-user, and enterprise licenses priced at USD 4900.00, USD 7350.00, and USD 9800.00 respectively.
10. Is the market size provided in terms of value or volume?
The market size is provided in terms of value, measured in billion.
11. Are there any specific market keywords associated with the report?
Yes, the market keyword associated with the report is "Calendar," which aids in identifying and referencing the specific market segment covered.
12. How do I determine which pricing option suits my needs best?
The pricing options vary based on user requirements and access needs. Individual users may opt for single-user licenses, while businesses requiring broader access may choose multi-user or enterprise licenses for cost-effective access to the report.
13. Are there any additional resources or data provided in the Calendar report?
While the report offers comprehensive insights, it's advisable to review the specific contents or supplementary materials provided to ascertain if additional resources or data are available.
14. How can I stay updated on further developments or reports in the Calendar?
To stay informed about further developments, trends, and reports in the Calendar, consider subscribing to industry newsletters, following relevant companies and organizations, or regularly checking reputable industry news sources and publications.
Methodology
Step 1 - Identification of Relevant Samples Size from Population Database


Step 2 - Approaches for Defining Global Market Size (Value, Volume* & Price*)

Note*: In applicable scenarios
Step 3 - Data Sources
Primary Research
- Web Analytics
- Survey Reports
- Research Institute
- Latest Research Reports
- Opinion Leaders
Secondary Research
- Annual Reports
- White Paper
- Latest Press Release
- Industry Association
- Paid Database
- Investor Presentations

Step 4 - Data Triangulation
Involves using different sources of information in order to increase the validity of a study
These sources are likely to be stakeholders in a program - participants, other researchers, program staff, other community members, and so on.
Then we put all data in single framework & apply various statistical tools to find out the dynamic on the market.
During the analysis stage, feedback from the stakeholder groups would be compared to determine areas of agreement as well as areas of divergence