

Key Insights
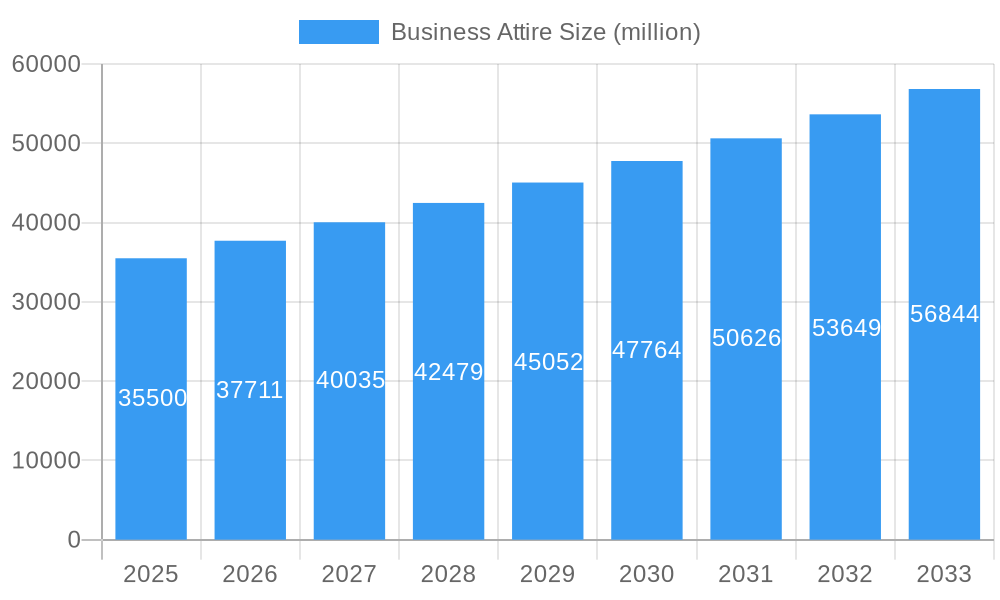
The global Business Attire market is poised for substantial growth, projected to reach an estimated market size of $35,500 million by 2025, with a robust Compound Annual Growth Rate (CAGR) of 6.2% expected from 2025 to 2033. This upward trajectory is primarily fueled by the increasing emphasis on professional image and brand identity across diverse industries. The Manufacturing Industry stands out as a significant segment, driven by the need for functional and branded workwear that ensures safety and team cohesion. The Service Industry also plays a crucial role, with businesses investing in well-defined corporate attire to foster customer trust and project professionalism. Emerging economies and the growing trend of hybrid work models are further contributing to market expansion, as companies adapt their attire policies to cater to a more diverse and dynamic workforce. The market is characterized by a shift towards more sustainable and ethically sourced materials, alongside a growing demand for custom and personalized workwear solutions.
Business Attire Market Size (In Billion)
The Business Attire market's expansion is further supported by evolving consumer preferences and technological advancements in fabric and garment production. Online Sales channels are gaining significant traction, offering greater convenience and accessibility for businesses to procure uniforms and corporate wear. This trend is expected to continue as e-commerce platforms become more sophisticated in catering to bulk orders and customization needs. However, the market also faces certain restraints, including the fluctuating costs of raw materials and the challenges associated with managing diverse employee needs and preferences. Despite these hurdles, the continuous innovation in design, functionality, and material science, coupled with strategic collaborations among key players like VF Corporation, Cintas, and Engelbert Strauss, will likely propel the market forward, ensuring its sustained growth throughout the forecast period.
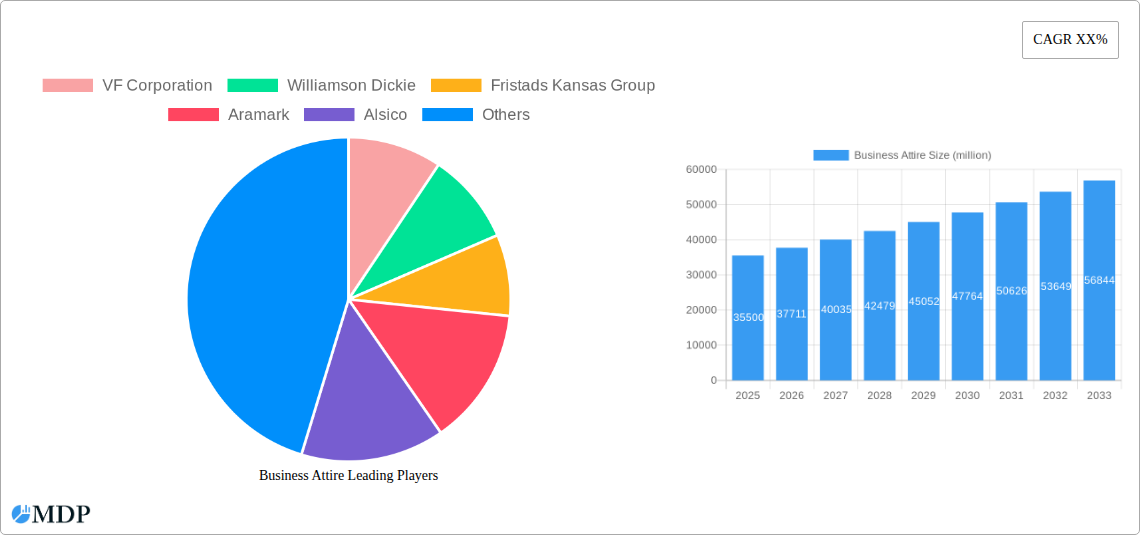
Business Attire Company Market Share
Business Attire Market Report: Comprehensive Analysis and Future Outlook (2019-2033)
This in-depth report offers a detailed examination of the global business attire market, providing critical insights for industry stakeholders, investors, and decision-makers. Spanning a study period from 2019 to 2033, with a base and estimated year of 2025 and a forecast period of 2025-2033, this analysis delves into market dynamics, trends, leading players, and future opportunities within the business attire sector. Expect to uncover actionable intelligence on how to navigate this evolving landscape, capitalize on growth drivers, and mitigate potential challenges.
Business Attire Market Dynamics & Concentration
The global business attire market exhibits a moderately consolidated structure, with leading players holding a significant portion of the market share. In 2025, the market share of top five companies is estimated at 55%. Innovation drivers such as the demand for sustainable materials and advanced functional fabrics are reshaping product development. Regulatory frameworks, particularly concerning labor practices and environmental impact, are influencing manufacturing processes and supply chains. Product substitutes, including casual wear adopted in some professional settings, present a dynamic competitive challenge. End-user trends are shifting towards comfort, versatility, and brand reputation, impacting purchasing decisions. Merger and acquisition (M&A) activities are prevalent, with approximately 30 M&A deals recorded between 2019 and 2024, aimed at expanding market reach and product portfolios.
- Market Concentration: Moderate, with top players accounting for an estimated 55% market share in 2025.
- Innovation Drivers: Sustainable materials, functional fabrics, smart textiles.
- Regulatory Frameworks: Labor laws, environmental regulations (e.g., REACH compliance).
- Product Substitutes: Casual wear, performance wear.
- End-User Trends: Comfort, versatility, brand loyalty, ethical sourcing.
- M&A Activities: Approximately 30 deals between 2019-2024, focusing on consolidation and market expansion.
Business Attire Industry Trends & Analysis
The business attire industry is experiencing robust growth, projected to achieve a Compound Annual Growth Rate (CAGR) of 7.5% from 2025 to 2033. This expansion is primarily fueled by the increasing adoption of professional dress codes in emerging economies and the continuous demand for high-quality, durable workwear across various sectors. Technological disruptions, including advancements in fabric technology and e-commerce platforms, are transforming how business attire is designed, manufactured, and sold. Consumer preferences are evolving, with a growing emphasis on ethical sourcing, sustainability, and personalized styles. Competitive dynamics are intense, characterized by product differentiation, brand building, and strategic partnerships. Market penetration for specialized business attire in sectors like healthcare and heavy industry is steadily increasing, reaching an estimated 65% in 2025.
Leading Markets & Segments in Business Attire
The Manufacturing Industry segment is projected to dominate the business attire market, driven by stringent safety regulations and the need for specialized protective workwear. Within this segment, the Service Industry also presents a significant opportunity, with a growing demand for corporate branding and employee uniforms. Geographically, Asia Pacific is expected to emerge as the leading market, supported by rapid industrialization and economic growth in countries like China and India, with an estimated market share of 30% in 2025.
- Dominant Application Segment: Manufacturing Industry, characterized by high demand for durable and protective attire.
- Key Drivers:
- Strict occupational health and safety regulations mandating specific workwear.
- Need for uniforms that enhance brand identity and employee recognition.
- Advancements in material science for enhanced comfort and performance.
- Key Drivers:
- Dominant Sales Channel: Offline Sales are currently leading, accounting for an estimated 70% of the market share in 2025, due to the necessity of trying on for proper fit and function, especially for specialized workwear. However, Online Sales are rapidly gaining traction, with a projected CAGR of 12% during the forecast period.
- Key Drivers for Offline Dominance:
- Importance of fit and feel for comfort and functionality.
- Need for expert advice on specialized workwear requirements.
- Bulk purchasing by corporations.
- Key Drivers for Online Growth:
- Convenience and accessibility.
- Wider product selection and competitive pricing.
- Increasing digitalization of B2B procurement.
- Key Drivers for Offline Dominance:
- Leading Regional Market: Asia Pacific, driven by economic growth and industrial expansion.
- Key Drivers:
- Government initiatives promoting manufacturing and industrial development.
- Growing labor force and increasing disposable incomes.
- Rising awareness of corporate branding and employee welfare.
- Key Drivers:
Business Attire Product Developments
Product innovation in business attire is characterized by the integration of advanced materials, such as moisture-wicking fabrics and flame-retardant textiles, enhancing wearer comfort and safety. Companies are focusing on developing versatile attire that can transition from formal to semi-formal settings. The integration of smart technologies, like embedded sensors for health monitoring, is also a key trend. These developments offer competitive advantages by meeting evolving consumer demands for performance, style, and practicality.
Key Drivers of Business Attire Growth
Several factors are propelling the growth of the business attire market. Technologically, advancements in textile engineering are leading to more durable, comfortable, and functional apparel. Economically, the steady growth of global economies and the expansion of industries requiring professional attire are significant drivers. Regulatory factors, such as enhanced workplace safety standards, mandate the use of specific types of workwear, further boosting demand. For instance, the increasing emphasis on corporate social responsibility (CSR) is driving demand for ethically produced and sustainable business attire.
Challenges in the Business Attire Market
The business attire market faces several challenges. Regulatory hurdles, such as varying international labor and environmental compliance standards, can increase manufacturing costs and complexity. Supply chain disruptions, amplified by geopolitical events and trade disputes, can impact production timelines and material availability. Intense competitive pressures from both established brands and new market entrants can lead to price wars and reduced profit margins. Furthermore, the growing trend of casualization in some professional environments poses a restraint on the demand for traditional business attire.
Emerging Opportunities in Business Attire
Catalysts driving long-term growth in the business attire market include technological breakthroughs in smart textiles and wearable technology, offering innovative functionalities. Strategic partnerships between textile manufacturers and fashion designers can lead to the creation of unique and trend-setting business wear. Market expansion into developing economies, where professional dress codes are becoming more prevalent, presents significant untapped potential. The increasing consumer focus on sustainability and ethical production is also opening doors for brands that prioritize eco-friendly materials and fair labor practices.
Leading Players in the Business Attire Sector
- VF Corporation
- Williamson Dickie
- Fristads Kansas Group
- Aramark
- Alsico
- Adolphe Lafont
- Carhartt
- Engelbert Strauss
- UniFirst
- G&K Services
- Sioen
- Cintas
- Hultafors Group
- Johnsons Apparelmaster
- Aditya Birla
- Van Puijenbroek Textiel
- Dura-Wear
- Würth Modyf
- Yihe
- Lantian Hewu
- China Garments
- Provogue
Key Milestones in Business Attire Industry
- 2019: Launch of sustainable fabric collections by leading manufacturers, responding to growing environmental concerns.
- 2020: Increased adoption of e-commerce platforms by business attire brands to cater to remote work trends.
- 2021: Significant investment in advanced manufacturing technologies, like 3D printing for custom-fit apparel.
- 2022: Major M&A activity as companies sought to consolidate market share and expand product portfolios.
- 2023: Introduction of smart textiles with integrated sensors for health and safety monitoring in industrial settings.
- 2024: Enhanced focus on circular economy principles, with brands offering take-back and recycling programs.
Strategic Outlook for Business Attire Market
The strategic outlook for the business attire market is positive, with growth accelerators including continued innovation in performance fabrics, expansion into new geographic markets, and the increasing digitalization of sales and marketing channels. Companies that focus on sustainability, ethical sourcing, and personalized customer experiences are well-positioned for long-term success. The market offers substantial opportunities for strategic partnerships and product diversification, particularly in niche industrial and service sectors requiring specialized workwear solutions.
Business Attire Segmentation
-
1. Application
- 1.1. Manufacturing Industry
- 1.2. Service Industry
- 1.3. Mining Industry
- 1.4. Agriculture & Forestry Industry
- 1.5. Others
-
2. Types
- 2.1. Online Sales
- 2.2. Offline Sales
Business Attire Segmentation By Geography
-
1. North America
- 1.1. United States
- 1.2. Canada
- 1.3. Mexico
-
2. South America
- 2.1. Brazil
- 2.2. Argentina
- 2.3. Rest of South America
-
3. Europe
- 3.1. United Kingdom
- 3.2. Germany
- 3.3. France
- 3.4. Italy
- 3.5. Spain
- 3.6. Russia
- 3.7. Benelux
- 3.8. Nordics
- 3.9. Rest of Europe
-
4. Middle East & Africa
- 4.1. Turkey
- 4.2. Israel
- 4.3. GCC
- 4.4. North Africa
- 4.5. South Africa
- 4.6. Rest of Middle East & Africa
-
5. Asia Pacific
- 5.1. China
- 5.2. India
- 5.3. Japan
- 5.4. South Korea
- 5.5. ASEAN
- 5.6. Oceania
- 5.7. Rest of Asia Pacific
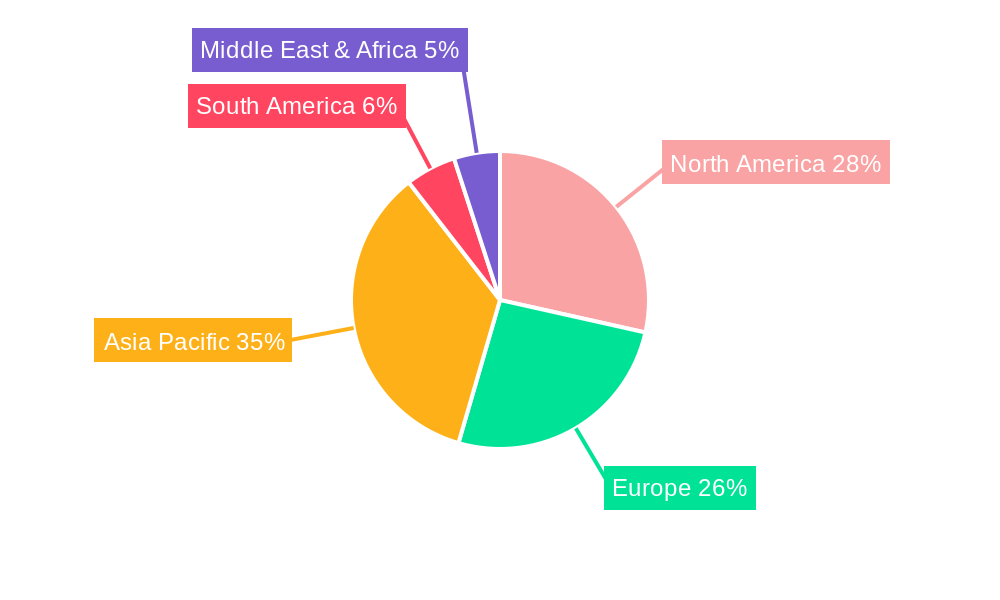
Business Attire Regional Market Share
Geographic Coverage of Business Attire
Business Attire REPORT HIGHLIGHTS
| Aspects | Details |
|---|---|
| Study Period | 2020-2034 |
| Base Year | 2025 |
| Estimated Year | 2026 |
| Forecast Period | 2026-2034 |
| Historical Period | 2020-2025 |
| Growth Rate | CAGR of XX% from 2020-2034 |
| Segmentation |
|
Table of Contents
- 1. Introduction
- 1.1. Research Scope
- 1.2. Market Segmentation
- 1.3. Research Methodology
- 1.4. Definitions and Assumptions
- 2. Executive Summary
- 2.1. Introduction
- 3. Market Dynamics
- 3.1. Introduction
- 3.2. Market Drivers
- 3.3. Market Restrains
- 3.4. Market Trends
- 4. Market Factor Analysis
- 4.1. Porters Five Forces
- 4.2. Supply/Value Chain
- 4.3. PESTEL analysis
- 4.4. Market Entropy
- 4.5. Patent/Trademark Analysis
- 5. Global Business Attire Analysis, Insights and Forecast, 2020-2032
- 5.1. Market Analysis, Insights and Forecast - by Application
- 5.1.1. Manufacturing Industry
- 5.1.2. Service Industry
- 5.1.3. Mining Industry
- 5.1.4. Agriculture & Forestry Industry
- 5.1.5. Others
- 5.2. Market Analysis, Insights and Forecast - by Types
- 5.2.1. Online Sales
- 5.2.2. Offline Sales
- 5.3. Market Analysis, Insights and Forecast - by Region
- 5.3.1. North America
- 5.3.2. South America
- 5.3.3. Europe
- 5.3.4. Middle East & Africa
- 5.3.5. Asia Pacific
- 5.1. Market Analysis, Insights and Forecast - by Application
- 6. North America Business Attire Analysis, Insights and Forecast, 2020-2032
- 6.1. Market Analysis, Insights and Forecast - by Application
- 6.1.1. Manufacturing Industry
- 6.1.2. Service Industry
- 6.1.3. Mining Industry
- 6.1.4. Agriculture & Forestry Industry
- 6.1.5. Others
- 6.2. Market Analysis, Insights and Forecast - by Types
- 6.2.1. Online Sales
- 6.2.2. Offline Sales
- 6.1. Market Analysis, Insights and Forecast - by Application
- 7. South America Business Attire Analysis, Insights and Forecast, 2020-2032
- 7.1. Market Analysis, Insights and Forecast - by Application
- 7.1.1. Manufacturing Industry
- 7.1.2. Service Industry
- 7.1.3. Mining Industry
- 7.1.4. Agriculture & Forestry Industry
- 7.1.5. Others
- 7.2. Market Analysis, Insights and Forecast - by Types
- 7.2.1. Online Sales
- 7.2.2. Offline Sales
- 7.1. Market Analysis, Insights and Forecast - by Application
- 8. Europe Business Attire Analysis, Insights and Forecast, 2020-2032
- 8.1. Market Analysis, Insights and Forecast - by Application
- 8.1.1. Manufacturing Industry
- 8.1.2. Service Industry
- 8.1.3. Mining Industry
- 8.1.4. Agriculture & Forestry Industry
- 8.1.5. Others
- 8.2. Market Analysis, Insights and Forecast - by Types
- 8.2.1. Online Sales
- 8.2.2. Offline Sales
- 8.1. Market Analysis, Insights and Forecast - by Application
- 9. Middle East & Africa Business Attire Analysis, Insights and Forecast, 2020-2032
- 9.1. Market Analysis, Insights and Forecast - by Application
- 9.1.1. Manufacturing Industry
- 9.1.2. Service Industry
- 9.1.3. Mining Industry
- 9.1.4. Agriculture & Forestry Industry
- 9.1.5. Others
- 9.2. Market Analysis, Insights and Forecast - by Types
- 9.2.1. Online Sales
- 9.2.2. Offline Sales
- 9.1. Market Analysis, Insights and Forecast - by Application
- 10. Asia Pacific Business Attire Analysis, Insights and Forecast, 2020-2032
- 10.1. Market Analysis, Insights and Forecast - by Application
- 10.1.1. Manufacturing Industry
- 10.1.2. Service Industry
- 10.1.3. Mining Industry
- 10.1.4. Agriculture & Forestry Industry
- 10.1.5. Others
- 10.2. Market Analysis, Insights and Forecast - by Types
- 10.2.1. Online Sales
- 10.2.2. Offline Sales
- 10.1. Market Analysis, Insights and Forecast - by Application
- 11. Competitive Analysis
- 11.1. Global Market Share Analysis 2025
- 11.2. Company Profiles
- 11.2.1 VF Corporation
- 11.2.1.1. Overview
- 11.2.1.2. Products
- 11.2.1.3. SWOT Analysis
- 11.2.1.4. Recent Developments
- 11.2.1.5. Financials (Based on Availability)
- 11.2.2 Williamson Dickie
- 11.2.2.1. Overview
- 11.2.2.2. Products
- 11.2.2.3. SWOT Analysis
- 11.2.2.4. Recent Developments
- 11.2.2.5. Financials (Based on Availability)
- 11.2.3 Fristads Kansas Group
- 11.2.3.1. Overview
- 11.2.3.2. Products
- 11.2.3.3. SWOT Analysis
- 11.2.3.4. Recent Developments
- 11.2.3.5. Financials (Based on Availability)
- 11.2.4 Aramark
- 11.2.4.1. Overview
- 11.2.4.2. Products
- 11.2.4.3. SWOT Analysis
- 11.2.4.4. Recent Developments
- 11.2.4.5. Financials (Based on Availability)
- 11.2.5 Alsico
- 11.2.5.1. Overview
- 11.2.5.2. Products
- 11.2.5.3. SWOT Analysis
- 11.2.5.4. Recent Developments
- 11.2.5.5. Financials (Based on Availability)
- 11.2.6 Adolphe Lafont
- 11.2.6.1. Overview
- 11.2.6.2. Products
- 11.2.6.3. SWOT Analysis
- 11.2.6.4. Recent Developments
- 11.2.6.5. Financials (Based on Availability)
- 11.2.7 Carhartt
- 11.2.7.1. Overview
- 11.2.7.2. Products
- 11.2.7.3. SWOT Analysis
- 11.2.7.4. Recent Developments
- 11.2.7.5. Financials (Based on Availability)
- 11.2.8 Engelbert Strauss
- 11.2.8.1. Overview
- 11.2.8.2. Products
- 11.2.8.3. SWOT Analysis
- 11.2.8.4. Recent Developments
- 11.2.8.5. Financials (Based on Availability)
- 11.2.9 UniFirst
- 11.2.9.1. Overview
- 11.2.9.2. Products
- 11.2.9.3. SWOT Analysis
- 11.2.9.4. Recent Developments
- 11.2.9.5. Financials (Based on Availability)
- 11.2.10 G&K Services
- 11.2.10.1. Overview
- 11.2.10.2. Products
- 11.2.10.3. SWOT Analysis
- 11.2.10.4. Recent Developments
- 11.2.10.5. Financials (Based on Availability)
- 11.2.11 Sioen
- 11.2.11.1. Overview
- 11.2.11.2. Products
- 11.2.11.3. SWOT Analysis
- 11.2.11.4. Recent Developments
- 11.2.11.5. Financials (Based on Availability)
- 11.2.12 Cintas
- 11.2.12.1. Overview
- 11.2.12.2. Products
- 11.2.12.3. SWOT Analysis
- 11.2.12.4. Recent Developments
- 11.2.12.5. Financials (Based on Availability)
- 11.2.13 Hultafors Group
- 11.2.13.1. Overview
- 11.2.13.2. Products
- 11.2.13.3. SWOT Analysis
- 11.2.13.4. Recent Developments
- 11.2.13.5. Financials (Based on Availability)
- 11.2.14 Johnsons Apparelmaster
- 11.2.14.1. Overview
- 11.2.14.2. Products
- 11.2.14.3. SWOT Analysis
- 11.2.14.4. Recent Developments
- 11.2.14.5. Financials (Based on Availability)
- 11.2.15 Aditya Birla
- 11.2.15.1. Overview
- 11.2.15.2. Products
- 11.2.15.3. SWOT Analysis
- 11.2.15.4. Recent Developments
- 11.2.15.5. Financials (Based on Availability)
- 11.2.16 Van Puijenbroek Textiel
- 11.2.16.1. Overview
- 11.2.16.2. Products
- 11.2.16.3. SWOT Analysis
- 11.2.16.4. Recent Developments
- 11.2.16.5. Financials (Based on Availability)
- 11.2.17 Dura-Wear
- 11.2.17.1. Overview
- 11.2.17.2. Products
- 11.2.17.3. SWOT Analysis
- 11.2.17.4. Recent Developments
- 11.2.17.5. Financials (Based on Availability)
- 11.2.18 Würth Modyf
- 11.2.18.1. Overview
- 11.2.18.2. Products
- 11.2.18.3. SWOT Analysis
- 11.2.18.4. Recent Developments
- 11.2.18.5. Financials (Based on Availability)
- 11.2.19 Yihe
- 11.2.19.1. Overview
- 11.2.19.2. Products
- 11.2.19.3. SWOT Analysis
- 11.2.19.4. Recent Developments
- 11.2.19.5. Financials (Based on Availability)
- 11.2.20 Lantian Hewu
- 11.2.20.1. Overview
- 11.2.20.2. Products
- 11.2.20.3. SWOT Analysis
- 11.2.20.4. Recent Developments
- 11.2.20.5. Financials (Based on Availability)
- 11.2.21 China Garments
- 11.2.21.1. Overview
- 11.2.21.2. Products
- 11.2.21.3. SWOT Analysis
- 11.2.21.4. Recent Developments
- 11.2.21.5. Financials (Based on Availability)
- 11.2.22 Provogue
- 11.2.22.1. Overview
- 11.2.22.2. Products
- 11.2.22.3. SWOT Analysis
- 11.2.22.4. Recent Developments
- 11.2.22.5. Financials (Based on Availability)
- 11.2.1 VF Corporation
List of Figures
- Figure 1: Global Business Attire Revenue Breakdown (million, %) by Region 2025 & 2033
- Figure 2: North America Business Attire Revenue (million), by Application 2025 & 2033
- Figure 3: North America Business Attire Revenue Share (%), by Application 2025 & 2033
- Figure 4: North America Business Attire Revenue (million), by Types 2025 & 2033
- Figure 5: North America Business Attire Revenue Share (%), by Types 2025 & 2033
- Figure 6: North America Business Attire Revenue (million), by Country 2025 & 2033
- Figure 7: North America Business Attire Revenue Share (%), by Country 2025 & 2033
- Figure 8: South America Business Attire Revenue (million), by Application 2025 & 2033
- Figure 9: South America Business Attire Revenue Share (%), by Application 2025 & 2033
- Figure 10: South America Business Attire Revenue (million), by Types 2025 & 2033
- Figure 11: South America Business Attire Revenue Share (%), by Types 2025 & 2033
- Figure 12: South America Business Attire Revenue (million), by Country 2025 & 2033
- Figure 13: South America Business Attire Revenue Share (%), by Country 2025 & 2033
- Figure 14: Europe Business Attire Revenue (million), by Application 2025 & 2033
- Figure 15: Europe Business Attire Revenue Share (%), by Application 2025 & 2033
- Figure 16: Europe Business Attire Revenue (million), by Types 2025 & 2033
- Figure 17: Europe Business Attire Revenue Share (%), by Types 2025 & 2033
- Figure 18: Europe Business Attire Revenue (million), by Country 2025 & 2033
- Figure 19: Europe Business Attire Revenue Share (%), by Country 2025 & 2033
- Figure 20: Middle East & Africa Business Attire Revenue (million), by Application 2025 & 2033
- Figure 21: Middle East & Africa Business Attire Revenue Share (%), by Application 2025 & 2033
- Figure 22: Middle East & Africa Business Attire Revenue (million), by Types 2025 & 2033
- Figure 23: Middle East & Africa Business Attire Revenue Share (%), by Types 2025 & 2033
- Figure 24: Middle East & Africa Business Attire Revenue (million), by Country 2025 & 2033
- Figure 25: Middle East & Africa Business Attire Revenue Share (%), by Country 2025 & 2033
- Figure 26: Asia Pacific Business Attire Revenue (million), by Application 2025 & 2033
- Figure 27: Asia Pacific Business Attire Revenue Share (%), by Application 2025 & 2033
- Figure 28: Asia Pacific Business Attire Revenue (million), by Types 2025 & 2033
- Figure 29: Asia Pacific Business Attire Revenue Share (%), by Types 2025 & 2033
- Figure 30: Asia Pacific Business Attire Revenue (million), by Country 2025 & 2033
- Figure 31: Asia Pacific Business Attire Revenue Share (%), by Country 2025 & 2033
List of Tables
- Table 1: Global Business Attire Revenue million Forecast, by Application 2020 & 2033
- Table 2: Global Business Attire Revenue million Forecast, by Types 2020 & 2033
- Table 3: Global Business Attire Revenue million Forecast, by Region 2020 & 2033
- Table 4: Global Business Attire Revenue million Forecast, by Application 2020 & 2033
- Table 5: Global Business Attire Revenue million Forecast, by Types 2020 & 2033
- Table 6: Global Business Attire Revenue million Forecast, by Country 2020 & 2033
- Table 7: United States Business Attire Revenue (million) Forecast, by Application 2020 & 2033
- Table 8: Canada Business Attire Revenue (million) Forecast, by Application 2020 & 2033
- Table 9: Mexico Business Attire Revenue (million) Forecast, by Application 2020 & 2033
- Table 10: Global Business Attire Revenue million Forecast, by Application 2020 & 2033
- Table 11: Global Business Attire Revenue million Forecast, by Types 2020 & 2033
- Table 12: Global Business Attire Revenue million Forecast, by Country 2020 & 2033
- Table 13: Brazil Business Attire Revenue (million) Forecast, by Application 2020 & 2033
- Table 14: Argentina Business Attire Revenue (million) Forecast, by Application 2020 & 2033
- Table 15: Rest of South America Business Attire Revenue (million) Forecast, by Application 2020 & 2033
- Table 16: Global Business Attire Revenue million Forecast, by Application 2020 & 2033
- Table 17: Global Business Attire Revenue million Forecast, by Types 2020 & 2033
- Table 18: Global Business Attire Revenue million Forecast, by Country 2020 & 2033
- Table 19: United Kingdom Business Attire Revenue (million) Forecast, by Application 2020 & 2033
- Table 20: Germany Business Attire Revenue (million) Forecast, by Application 2020 & 2033
- Table 21: France Business Attire Revenue (million) Forecast, by Application 2020 & 2033
- Table 22: Italy Business Attire Revenue (million) Forecast, by Application 2020 & 2033
- Table 23: Spain Business Attire Revenue (million) Forecast, by Application 2020 & 2033
- Table 24: Russia Business Attire Revenue (million) Forecast, by Application 2020 & 2033
- Table 25: Benelux Business Attire Revenue (million) Forecast, by Application 2020 & 2033
- Table 26: Nordics Business Attire Revenue (million) Forecast, by Application 2020 & 2033
- Table 27: Rest of Europe Business Attire Revenue (million) Forecast, by Application 2020 & 2033
- Table 28: Global Business Attire Revenue million Forecast, by Application 2020 & 2033
- Table 29: Global Business Attire Revenue million Forecast, by Types 2020 & 2033
- Table 30: Global Business Attire Revenue million Forecast, by Country 2020 & 2033
- Table 31: Turkey Business Attire Revenue (million) Forecast, by Application 2020 & 2033
- Table 32: Israel Business Attire Revenue (million) Forecast, by Application 2020 & 2033
- Table 33: GCC Business Attire Revenue (million) Forecast, by Application 2020 & 2033
- Table 34: North Africa Business Attire Revenue (million) Forecast, by Application 2020 & 2033
- Table 35: South Africa Business Attire Revenue (million) Forecast, by Application 2020 & 2033
- Table 36: Rest of Middle East & Africa Business Attire Revenue (million) Forecast, by Application 2020 & 2033
- Table 37: Global Business Attire Revenue million Forecast, by Application 2020 & 2033
- Table 38: Global Business Attire Revenue million Forecast, by Types 2020 & 2033
- Table 39: Global Business Attire Revenue million Forecast, by Country 2020 & 2033
- Table 40: China Business Attire Revenue (million) Forecast, by Application 2020 & 2033
- Table 41: India Business Attire Revenue (million) Forecast, by Application 2020 & 2033
- Table 42: Japan Business Attire Revenue (million) Forecast, by Application 2020 & 2033
- Table 43: South Korea Business Attire Revenue (million) Forecast, by Application 2020 & 2033
- Table 44: ASEAN Business Attire Revenue (million) Forecast, by Application 2020 & 2033
- Table 45: Oceania Business Attire Revenue (million) Forecast, by Application 2020 & 2033
- Table 46: Rest of Asia Pacific Business Attire Revenue (million) Forecast, by Application 2020 & 2033
Frequently Asked Questions
1. What is the projected Compound Annual Growth Rate (CAGR) of the Business Attire?
The projected CAGR is approximately XX%.
2. Which companies are prominent players in the Business Attire?
Key companies in the market include VF Corporation, Williamson Dickie, Fristads Kansas Group, Aramark, Alsico, Adolphe Lafont, Carhartt, Engelbert Strauss, UniFirst, G&K Services, Sioen, Cintas, Hultafors Group, Johnsons Apparelmaster, Aditya Birla, Van Puijenbroek Textiel, Dura-Wear, Würth Modyf, Yihe, Lantian Hewu, China Garments, Provogue.
3. What are the main segments of the Business Attire?
The market segments include Application, Types.
4. Can you provide details about the market size?
The market size is estimated to be USD XXX million as of 2022.
5. What are some drivers contributing to market growth?
N/A
6. What are the notable trends driving market growth?
N/A
7. Are there any restraints impacting market growth?
N/A
8. Can you provide examples of recent developments in the market?
N/A
9. What pricing options are available for accessing the report?
Pricing options include single-user, multi-user, and enterprise licenses priced at USD 2900.00, USD 4350.00, and USD 5800.00 respectively.
10. Is the market size provided in terms of value or volume?
The market size is provided in terms of value, measured in million.
11. Are there any specific market keywords associated with the report?
Yes, the market keyword associated with the report is "Business Attire," which aids in identifying and referencing the specific market segment covered.
12. How do I determine which pricing option suits my needs best?
The pricing options vary based on user requirements and access needs. Individual users may opt for single-user licenses, while businesses requiring broader access may choose multi-user or enterprise licenses for cost-effective access to the report.
13. Are there any additional resources or data provided in the Business Attire report?
While the report offers comprehensive insights, it's advisable to review the specific contents or supplementary materials provided to ascertain if additional resources or data are available.
14. How can I stay updated on further developments or reports in the Business Attire?
To stay informed about further developments, trends, and reports in the Business Attire, consider subscribing to industry newsletters, following relevant companies and organizations, or regularly checking reputable industry news sources and publications.
Methodology
Step 1 - Identification of Relevant Samples Size from Population Database


Step 2 - Approaches for Defining Global Market Size (Value, Volume* & Price*)

Note*: In applicable scenarios
Step 3 - Data Sources
Primary Research
- Web Analytics
- Survey Reports
- Research Institute
- Latest Research Reports
- Opinion Leaders
Secondary Research
- Annual Reports
- White Paper
- Latest Press Release
- Industry Association
- Paid Database
- Investor Presentations

Step 4 - Data Triangulation
Involves using different sources of information in order to increase the validity of a study
These sources are likely to be stakeholders in a program - participants, other researchers, program staff, other community members, and so on.
Then we put all data in single framework & apply various statistical tools to find out the dynamic on the market.
During the analysis stage, feedback from the stakeholder groups would be compared to determine areas of agreement as well as areas of divergence