

Key Insights
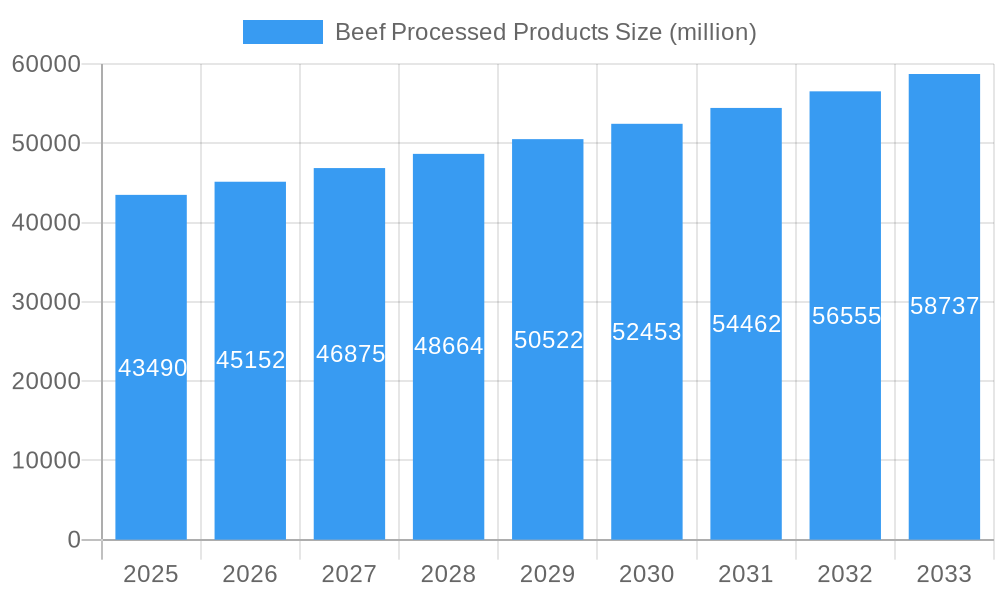
The global Beef Processed Products market is poised for steady expansion, projected to reach $43.49 billion in 2025 with a compound annual growth rate (CAGR) of 3.79% through 2033. This growth trajectory is underpinned by a confluence of evolving consumer preferences and advancements in processing technologies. A significant driver is the increasing demand for convenience, with consumers seeking ready-to-cook and ready-to-eat beef products that cater to busy lifestyles. The rise of online sales channels has further amplified this trend, allowing for broader market reach and facilitating easier access to a diverse range of processed beef items. Furthermore, the growing popularity of snack foods, including beef jerky and biltong, is contributing to market dynamism, appealing to a younger demographic and those seeking on-the-go protein sources. Investments in innovative packaging solutions that enhance shelf life and preserve product quality are also playing a crucial role in sustaining this upward momentum.
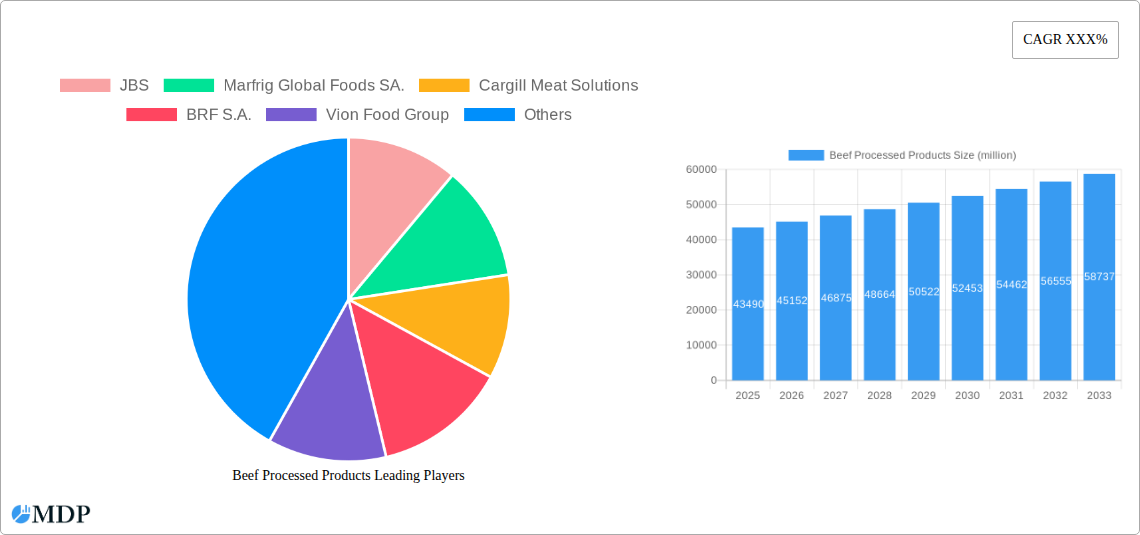
Beef Processed Products Market Size (In Billion)
The market's expansion is also influenced by innovations in processing that improve both efficiency and product quality. While the demand for convenience and variety fuels growth, the market also faces certain restraints. Heightened awareness regarding the health implications of processed foods, including high sodium and fat content, presents a challenge, prompting manufacturers to focus on developing healthier alternatives with reduced levels of additives. Stringent regulations surrounding food safety and processing standards across different regions also necessitate continuous adaptation and investment from market players. Despite these challenges, the robust demand for convenient and diverse beef offerings, coupled with ongoing technological advancements in the processing sector, suggests a resilient and growing market for beef processed products globally.
Beef Processed Products Company Market Share
Beef Processed Products Market Dynamics & Concentration
The global Beef Processed Products market exhibits a moderate to high concentration, with leading players like JBS, Marfrig Global Foods SA., Cargill Meat Solutions, BRF S.A., and Tyson Foods Inc. commanding significant market share, estimated to be over 80 billion collectively. Innovation is a key differentiator, driven by advancements in food processing technology and evolving consumer demand for convenience and healthier options. Regulatory frameworks, including food safety standards and labeling requirements across regions, play a crucial role in shaping market access and product development. The threat of product substitutes, such as plant-based alternatives and other processed meats, is increasing, prompting companies to focus on product differentiation and value-added offerings. End-user trends lean towards convenient meal solutions and premium quality products, influencing product formulations and packaging. Merger and acquisition (M&A) activities are strategic imperatives for consolidating market presence and expanding product portfolios, with an estimated 50 billion in M&A deals observed over the historical period.
Beef Processed Products Industry Trends & Analysis
The global Beef Processed Products market is poised for robust growth, projected to expand at a Compound Annual Growth Rate (CAGR) of 5.8% from the base year 2025 through 2033, reaching an estimated market size of 350 billion. This upward trajectory is fueled by several compelling factors. A primary driver is the burgeoning global population and increasing disposable incomes, particularly in emerging economies, leading to higher per capita consumption of protein-rich foods. The convenience factor remains paramount, with consumers actively seeking ready-to-eat and easy-to-prepare beef products, driving demand for prefabricated foods and snack items. Technological disruptions are transforming the industry, from advanced processing techniques that enhance shelf-life and nutritional value to innovations in packaging that improve convenience and sustainability. For instance, advancements in high-pressure processing and modified atmosphere packaging are extending product freshness and reducing spoilage. Consumer preferences are evolving, with a growing emphasis on traceability, ethical sourcing, and healthier formulations, including reduced sodium and fat content. This has spurred the development of premium, artisanal, and specialty beef products. The competitive landscape is intense, characterized by strategic partnerships, product innovation, and global expansion by major players. Companies are investing heavily in research and development to introduce novel product lines that cater to diverse dietary needs and taste profiles. Market penetration is expected to deepen as distribution networks expand, especially through online sales channels, complementing traditional offline retail. The industry is also witnessing a rise in value-added products, moving beyond basic processed beef to include marinated cuts, seasoned ground beef, and gourmet beef snacks, thereby capturing a larger share of the consumer's food expenditure. The estimated market penetration for processed beef products is projected to reach 75% by 2033, indicating significant untapped potential.
Leading Markets & Segments in Beef Processed Products
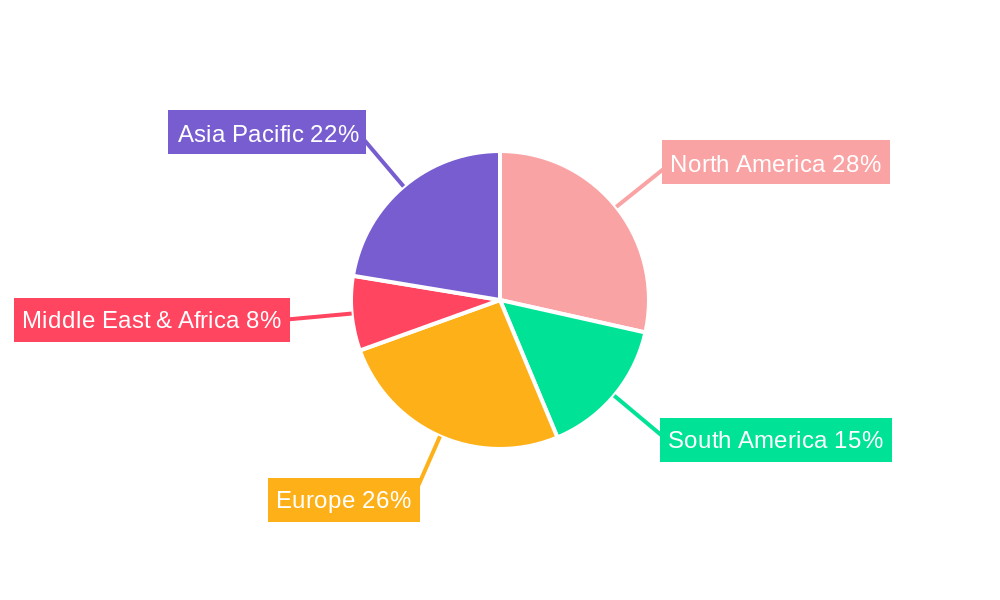
The global Beef Processed Products market is significantly influenced by regional economic policies and robust infrastructure, which collectively dictate market dominance. North America, with an estimated market share of 30%, stands as a leading region, driven by high consumer spending power and a well-established demand for convenience foods. Within this region, the United States contributes a substantial portion, with its vast retail network and a strong preference for processed beef in various forms. The dominance of North America is further bolstered by its advanced logistics and supply chain networks, enabling efficient distribution of perishable goods.
In terms of application, Offline Sales continue to be the primary channel, accounting for approximately 70% of the market revenue, estimated at 245 billion. This is attributed to the widespread presence of supermarkets, hypermarkets, and specialty meat stores that offer a wide array of beef processed products. However, Online Sales are experiencing rapid growth, projected to reach 105 billion by 2033, driven by the increasing adoption of e-commerce platforms and the convenience of home delivery. Key drivers for offline sales dominance include established consumer shopping habits, the ability to physically inspect products, and impulse purchases.
Analyzing by product type, Prefabricated Foods represent the largest segment, contributing an estimated 220 billion to the market. This category encompasses items like ready-to-cook beef patties, sausages, meatballs, and pre-marinated beef cuts, which directly address the consumer's need for quick meal preparation. The economic policies favoring food processing and the availability of advanced manufacturing facilities in leading countries further support the growth of this segment. Infrastructure plays a critical role here, with efficient cold chain logistics ensuring the quality and safety of prefabricated beef products from production to the consumer's table.
Snack Foods, while a smaller segment, is witnessing significant growth, with an estimated market value of 125 billion. This includes beef jerky, biltong, and other savory beef-based snacks that cater to on-the-go consumption and dietary preferences for high-protein options. The increasing popularity of snacking occasions and innovative product development in this sub-segment are key drivers. For instance, the introduction of gourmet and flavored beef jerky variants has broadened its appeal beyond traditional consumers.
Beef Processed Products Product Developments
Product innovation in the Beef Processed Products sector is rapidly evolving, driven by consumer demand for healthier, more convenient, and ethically sourced options. Companies are investing in the development of reduced-sodium and lower-fat formulations, alongside gluten-free and allergen-friendly products. Advanced processing techniques, such as precision fermentation and cell-based meat cultivation, are on the horizon, promising novel product applications and enhanced sustainability profiles. Furthermore, the market is seeing an increase in value-added products, including gourmet beef cuts, specialty sausages, and ready-to-heat meal components, offering competitive advantages through unique flavor profiles and premium quality.
Key Drivers of Beef Processed Products Growth
Several key factors are propelling the growth of the Beef Processed Products market. Technological advancements in processing and preservation techniques, such as modified atmosphere packaging and high-pressure processing, enhance product shelf-life and quality, driving consumption. The increasing global population and rising disposable incomes, especially in emerging economies, are leading to higher demand for protein-rich foods. Furthermore, the growing preference for convenient and ready-to-eat meal solutions aligns perfectly with the product offerings in this sector. Supportive government initiatives promoting food safety and processing industries also contribute to market expansion.
Challenges in the Beef Processed Products Market
Despite its growth, the Beef Processed Products market faces significant challenges. Stringent food safety regulations and evolving labeling requirements across different regions can create compliance hurdles and increase operational costs. Supply chain disruptions, including volatile raw material prices and logistics issues, can impact profitability and product availability. The growing consumer concern regarding the health implications of processed foods and the rising popularity of alternative protein sources, such as plant-based meats, present a competitive pressure that necessitates continuous product innovation and clear communication of product benefits.
Emerging Opportunities in Beef Processed Products
Emerging opportunities in the Beef Processed Products market are manifold, offering significant catalysts for long-term growth. Technological breakthroughs in alternative protein production, including cell-based and cultivated beef, present a paradigm shift, promising sustainable and novel product development. Strategic partnerships between meat processors and technology providers can accelerate innovation in areas like traceability and precision agriculture. Furthermore, the expansion of e-commerce channels provides an opportunity to reach a wider consumer base and offer personalized product selections, particularly in regions with growing online retail penetration.
Leading Players in the Beef Processed Products Sector
- JBS
- Marfrig Global Foods SA.
- Cargill Meat Solutions
- BRF S.A.
- Vion Food Group
- Yonekyu Corp.
- WH Group
- Shandong Longda Meat Foodstuff
- Weaver Meat Processing
- Soalca
- Triad Meat Company
- Matthews Meats
- Standard Meat
- Marel
- Hormel Foods
- Tyson Foods Inc.
- The Lamb Company
- Silver Fern Farms Ltd
- Maple Leaf Foods
- Samex
Key Milestones in Beef Processed Products Industry
- 2019: Increased investment in plant-based meat alternatives by major food companies, signaling a shift in consumer interest.
- 2020: Accelerated growth in online grocery sales and food delivery services, boosting demand for convenient processed foods.
- 2021: Enhanced focus on sustainable sourcing and ethical practices in the beef supply chain, influencing product development and marketing.
- 2022: Introduction of novel processing technologies aimed at improving nutritional profiles and extending shelf-life of processed beef products.
- 2023: Significant M&A activities as larger players consolidate market share and expand product portfolios through strategic acquisitions.
- 2024: Growing consumer awareness and demand for traceable and transparent food sourcing, leading to greater emphasis on supply chain visibility.
Strategic Outlook for Beef Processed Products Market
The strategic outlook for the Beef Processed Products market is characterized by innovation and market expansion. Growth accelerators include the continued development of value-added products catering to niche dietary preferences and the integration of advanced technologies to enhance sustainability and efficiency throughout the supply chain. Strategic partnerships and collaborations will be crucial for navigating evolving consumer demands and regulatory landscapes. Focusing on premiumization, convenience, and health-conscious offerings, coupled with a strong online and offline distribution strategy, will be key to capturing future market potential and achieving sustained growth in the coming years.
Beef Processed Products Segmentation
-
1. Application
- 1.1. Online Sales
- 1.2. Offline Sales
-
2. Type
- 2.1. Prefabricated Foods
- 2.2. Snack Foods
Beef Processed Products Segmentation By Geography
-
1. North America
- 1.1. United States
- 1.2. Canada
- 1.3. Mexico
-
2. South America
- 2.1. Brazil
- 2.2. Argentina
- 2.3. Rest of South America
-
3. Europe
- 3.1. United Kingdom
- 3.2. Germany
- 3.3. France
- 3.4. Italy
- 3.5. Spain
- 3.6. Russia
- 3.7. Benelux
- 3.8. Nordics
- 3.9. Rest of Europe
-
4. Middle East & Africa
- 4.1. Turkey
- 4.2. Israel
- 4.3. GCC
- 4.4. North Africa
- 4.5. South Africa
- 4.6. Rest of Middle East & Africa
-
5. Asia Pacific
- 5.1. China
- 5.2. India
- 5.3. Japan
- 5.4. South Korea
- 5.5. ASEAN
- 5.6. Oceania
- 5.7. Rest of Asia Pacific
Beef Processed Products Regional Market Share
Geographic Coverage of Beef Processed Products
Beef Processed Products REPORT HIGHLIGHTS
| Aspects | Details |
|---|---|
| Study Period | 2020-2034 |
| Base Year | 2025 |
| Estimated Year | 2026 |
| Forecast Period | 2026-2034 |
| Historical Period | 2020-2025 |
| Growth Rate | CAGR of 3.45% from 2020-2034 |
| Segmentation |
|
Table of Contents
- 1. Introduction
- 1.1. Research Scope
- 1.2. Market Segmentation
- 1.3. Research Methodology
- 1.4. Definitions and Assumptions
- 2. Executive Summary
- 2.1. Introduction
- 3. Market Dynamics
- 3.1. Introduction
- 3.2. Market Drivers
- 3.3. Market Restrains
- 3.4. Market Trends
- 4. Market Factor Analysis
- 4.1. Porters Five Forces
- 4.2. Supply/Value Chain
- 4.3. PESTEL analysis
- 4.4. Market Entropy
- 4.5. Patent/Trademark Analysis
- 5. Global Beef Processed Products Analysis, Insights and Forecast, 2020-2032
- 5.1. Market Analysis, Insights and Forecast - by Application
- 5.1.1. Online Sales
- 5.1.2. Offline Sales
- 5.2. Market Analysis, Insights and Forecast - by Type
- 5.2.1. Prefabricated Foods
- 5.2.2. Snack Foods
- 5.3. Market Analysis, Insights and Forecast - by Region
- 5.3.1. North America
- 5.3.2. South America
- 5.3.3. Europe
- 5.3.4. Middle East & Africa
- 5.3.5. Asia Pacific
- 5.1. Market Analysis, Insights and Forecast - by Application
- 6. North America Beef Processed Products Analysis, Insights and Forecast, 2020-2032
- 6.1. Market Analysis, Insights and Forecast - by Application
- 6.1.1. Online Sales
- 6.1.2. Offline Sales
- 6.2. Market Analysis, Insights and Forecast - by Type
- 6.2.1. Prefabricated Foods
- 6.2.2. Snack Foods
- 6.1. Market Analysis, Insights and Forecast - by Application
- 7. South America Beef Processed Products Analysis, Insights and Forecast, 2020-2032
- 7.1. Market Analysis, Insights and Forecast - by Application
- 7.1.1. Online Sales
- 7.1.2. Offline Sales
- 7.2. Market Analysis, Insights and Forecast - by Type
- 7.2.1. Prefabricated Foods
- 7.2.2. Snack Foods
- 7.1. Market Analysis, Insights and Forecast - by Application
- 8. Europe Beef Processed Products Analysis, Insights and Forecast, 2020-2032
- 8.1. Market Analysis, Insights and Forecast - by Application
- 8.1.1. Online Sales
- 8.1.2. Offline Sales
- 8.2. Market Analysis, Insights and Forecast - by Type
- 8.2.1. Prefabricated Foods
- 8.2.2. Snack Foods
- 8.1. Market Analysis, Insights and Forecast - by Application
- 9. Middle East & Africa Beef Processed Products Analysis, Insights and Forecast, 2020-2032
- 9.1. Market Analysis, Insights and Forecast - by Application
- 9.1.1. Online Sales
- 9.1.2. Offline Sales
- 9.2. Market Analysis, Insights and Forecast - by Type
- 9.2.1. Prefabricated Foods
- 9.2.2. Snack Foods
- 9.1. Market Analysis, Insights and Forecast - by Application
- 10. Asia Pacific Beef Processed Products Analysis, Insights and Forecast, 2020-2032
- 10.1. Market Analysis, Insights and Forecast - by Application
- 10.1.1. Online Sales
- 10.1.2. Offline Sales
- 10.2. Market Analysis, Insights and Forecast - by Type
- 10.2.1. Prefabricated Foods
- 10.2.2. Snack Foods
- 10.1. Market Analysis, Insights and Forecast - by Application
- 11. Competitive Analysis
- 11.1. Global Market Share Analysis 2025
- 11.2. Company Profiles
- 11.2.1 JBS
- 11.2.1.1. Overview
- 11.2.1.2. Products
- 11.2.1.3. SWOT Analysis
- 11.2.1.4. Recent Developments
- 11.2.1.5. Financials (Based on Availability)
- 11.2.2 Marfrig Global Foods SA.
- 11.2.2.1. Overview
- 11.2.2.2. Products
- 11.2.2.3. SWOT Analysis
- 11.2.2.4. Recent Developments
- 11.2.2.5. Financials (Based on Availability)
- 11.2.3 Cargill Meat Solutions
- 11.2.3.1. Overview
- 11.2.3.2. Products
- 11.2.3.3. SWOT Analysis
- 11.2.3.4. Recent Developments
- 11.2.3.5. Financials (Based on Availability)
- 11.2.4 BRF S.A.
- 11.2.4.1. Overview
- 11.2.4.2. Products
- 11.2.4.3. SWOT Analysis
- 11.2.4.4. Recent Developments
- 11.2.4.5. Financials (Based on Availability)
- 11.2.5 Vion Food Group
- 11.2.5.1. Overview
- 11.2.5.2. Products
- 11.2.5.3. SWOT Analysis
- 11.2.5.4. Recent Developments
- 11.2.5.5. Financials (Based on Availability)
- 11.2.6 Yonekyu Corp.
- 11.2.6.1. Overview
- 11.2.6.2. Products
- 11.2.6.3. SWOT Analysis
- 11.2.6.4. Recent Developments
- 11.2.6.5. Financials (Based on Availability)
- 11.2.7 WH Group
- 11.2.7.1. Overview
- 11.2.7.2. Products
- 11.2.7.3. SWOT Analysis
- 11.2.7.4. Recent Developments
- 11.2.7.5. Financials (Based on Availability)
- 11.2.8 Shandong Longda Meat Foodstuff
- 11.2.8.1. Overview
- 11.2.8.2. Products
- 11.2.8.3. SWOT Analysis
- 11.2.8.4. Recent Developments
- 11.2.8.5. Financials (Based on Availability)
- 11.2.9 Weaver Meat Processing
- 11.2.9.1. Overview
- 11.2.9.2. Products
- 11.2.9.3. SWOT Analysis
- 11.2.9.4. Recent Developments
- 11.2.9.5. Financials (Based on Availability)
- 11.2.10 Soalca
- 11.2.10.1. Overview
- 11.2.10.2. Products
- 11.2.10.3. SWOT Analysis
- 11.2.10.4. Recent Developments
- 11.2.10.5. Financials (Based on Availability)
- 11.2.11 Triad Meat Company
- 11.2.11.1. Overview
- 11.2.11.2. Products
- 11.2.11.3. SWOT Analysis
- 11.2.11.4. Recent Developments
- 11.2.11.5. Financials (Based on Availability)
- 11.2.12 Matthews Meats
- 11.2.12.1. Overview
- 11.2.12.2. Products
- 11.2.12.3. SWOT Analysis
- 11.2.12.4. Recent Developments
- 11.2.12.5. Financials (Based on Availability)
- 11.2.13 Standard Meat
- 11.2.13.1. Overview
- 11.2.13.2. Products
- 11.2.13.3. SWOT Analysis
- 11.2.13.4. Recent Developments
- 11.2.13.5. Financials (Based on Availability)
- 11.2.14 Marel
- 11.2.14.1. Overview
- 11.2.14.2. Products
- 11.2.14.3. SWOT Analysis
- 11.2.14.4. Recent Developments
- 11.2.14.5. Financials (Based on Availability)
- 11.2.15 Hormel Foods
- 11.2.15.1. Overview
- 11.2.15.2. Products
- 11.2.15.3. SWOT Analysis
- 11.2.15.4. Recent Developments
- 11.2.15.5. Financials (Based on Availability)
- 11.2.16 Tyson Foods Inc.
- 11.2.16.1. Overview
- 11.2.16.2. Products
- 11.2.16.3. SWOT Analysis
- 11.2.16.4. Recent Developments
- 11.2.16.5. Financials (Based on Availability)
- 11.2.17 The Lamb Company
- 11.2.17.1. Overview
- 11.2.17.2. Products
- 11.2.17.3. SWOT Analysis
- 11.2.17.4. Recent Developments
- 11.2.17.5. Financials (Based on Availability)
- 11.2.18 Silver Fern Farms Ltd
- 11.2.18.1. Overview
- 11.2.18.2. Products
- 11.2.18.3. SWOT Analysis
- 11.2.18.4. Recent Developments
- 11.2.18.5. Financials (Based on Availability)
- 11.2.19 Maple Leaf Foods
- 11.2.19.1. Overview
- 11.2.19.2. Products
- 11.2.19.3. SWOT Analysis
- 11.2.19.4. Recent Developments
- 11.2.19.5. Financials (Based on Availability)
- 11.2.20 Samex
- 11.2.20.1. Overview
- 11.2.20.2. Products
- 11.2.20.3. SWOT Analysis
- 11.2.20.4. Recent Developments
- 11.2.20.5. Financials (Based on Availability)
- 11.2.1 JBS
List of Figures
- Figure 1: Global Beef Processed Products Revenue Breakdown (undefined, %) by Region 2025 & 2033
- Figure 2: North America Beef Processed Products Revenue (undefined), by Application 2025 & 2033
- Figure 3: North America Beef Processed Products Revenue Share (%), by Application 2025 & 2033
- Figure 4: North America Beef Processed Products Revenue (undefined), by Type 2025 & 2033
- Figure 5: North America Beef Processed Products Revenue Share (%), by Type 2025 & 2033
- Figure 6: North America Beef Processed Products Revenue (undefined), by Country 2025 & 2033
- Figure 7: North America Beef Processed Products Revenue Share (%), by Country 2025 & 2033
- Figure 8: South America Beef Processed Products Revenue (undefined), by Application 2025 & 2033
- Figure 9: South America Beef Processed Products Revenue Share (%), by Application 2025 & 2033
- Figure 10: South America Beef Processed Products Revenue (undefined), by Type 2025 & 2033
- Figure 11: South America Beef Processed Products Revenue Share (%), by Type 2025 & 2033
- Figure 12: South America Beef Processed Products Revenue (undefined), by Country 2025 & 2033
- Figure 13: South America Beef Processed Products Revenue Share (%), by Country 2025 & 2033
- Figure 14: Europe Beef Processed Products Revenue (undefined), by Application 2025 & 2033
- Figure 15: Europe Beef Processed Products Revenue Share (%), by Application 2025 & 2033
- Figure 16: Europe Beef Processed Products Revenue (undefined), by Type 2025 & 2033
- Figure 17: Europe Beef Processed Products Revenue Share (%), by Type 2025 & 2033
- Figure 18: Europe Beef Processed Products Revenue (undefined), by Country 2025 & 2033
- Figure 19: Europe Beef Processed Products Revenue Share (%), by Country 2025 & 2033
- Figure 20: Middle East & Africa Beef Processed Products Revenue (undefined), by Application 2025 & 2033
- Figure 21: Middle East & Africa Beef Processed Products Revenue Share (%), by Application 2025 & 2033
- Figure 22: Middle East & Africa Beef Processed Products Revenue (undefined), by Type 2025 & 2033
- Figure 23: Middle East & Africa Beef Processed Products Revenue Share (%), by Type 2025 & 2033
- Figure 24: Middle East & Africa Beef Processed Products Revenue (undefined), by Country 2025 & 2033
- Figure 25: Middle East & Africa Beef Processed Products Revenue Share (%), by Country 2025 & 2033
- Figure 26: Asia Pacific Beef Processed Products Revenue (undefined), by Application 2025 & 2033
- Figure 27: Asia Pacific Beef Processed Products Revenue Share (%), by Application 2025 & 2033
- Figure 28: Asia Pacific Beef Processed Products Revenue (undefined), by Type 2025 & 2033
- Figure 29: Asia Pacific Beef Processed Products Revenue Share (%), by Type 2025 & 2033
- Figure 30: Asia Pacific Beef Processed Products Revenue (undefined), by Country 2025 & 2033
- Figure 31: Asia Pacific Beef Processed Products Revenue Share (%), by Country 2025 & 2033
List of Tables
- Table 1: Global Beef Processed Products Revenue undefined Forecast, by Application 2020 & 2033
- Table 2: Global Beef Processed Products Revenue undefined Forecast, by Type 2020 & 2033
- Table 3: Global Beef Processed Products Revenue undefined Forecast, by Region 2020 & 2033
- Table 4: Global Beef Processed Products Revenue undefined Forecast, by Application 2020 & 2033
- Table 5: Global Beef Processed Products Revenue undefined Forecast, by Type 2020 & 2033
- Table 6: Global Beef Processed Products Revenue undefined Forecast, by Country 2020 & 2033
- Table 7: United States Beef Processed Products Revenue (undefined) Forecast, by Application 2020 & 2033
- Table 8: Canada Beef Processed Products Revenue (undefined) Forecast, by Application 2020 & 2033
- Table 9: Mexico Beef Processed Products Revenue (undefined) Forecast, by Application 2020 & 2033
- Table 10: Global Beef Processed Products Revenue undefined Forecast, by Application 2020 & 2033
- Table 11: Global Beef Processed Products Revenue undefined Forecast, by Type 2020 & 2033
- Table 12: Global Beef Processed Products Revenue undefined Forecast, by Country 2020 & 2033
- Table 13: Brazil Beef Processed Products Revenue (undefined) Forecast, by Application 2020 & 2033
- Table 14: Argentina Beef Processed Products Revenue (undefined) Forecast, by Application 2020 & 2033
- Table 15: Rest of South America Beef Processed Products Revenue (undefined) Forecast, by Application 2020 & 2033
- Table 16: Global Beef Processed Products Revenue undefined Forecast, by Application 2020 & 2033
- Table 17: Global Beef Processed Products Revenue undefined Forecast, by Type 2020 & 2033
- Table 18: Global Beef Processed Products Revenue undefined Forecast, by Country 2020 & 2033
- Table 19: United Kingdom Beef Processed Products Revenue (undefined) Forecast, by Application 2020 & 2033
- Table 20: Germany Beef Processed Products Revenue (undefined) Forecast, by Application 2020 & 2033
- Table 21: France Beef Processed Products Revenue (undefined) Forecast, by Application 2020 & 2033
- Table 22: Italy Beef Processed Products Revenue (undefined) Forecast, by Application 2020 & 2033
- Table 23: Spain Beef Processed Products Revenue (undefined) Forecast, by Application 2020 & 2033
- Table 24: Russia Beef Processed Products Revenue (undefined) Forecast, by Application 2020 & 2033
- Table 25: Benelux Beef Processed Products Revenue (undefined) Forecast, by Application 2020 & 2033
- Table 26: Nordics Beef Processed Products Revenue (undefined) Forecast, by Application 2020 & 2033
- Table 27: Rest of Europe Beef Processed Products Revenue (undefined) Forecast, by Application 2020 & 2033
- Table 28: Global Beef Processed Products Revenue undefined Forecast, by Application 2020 & 2033
- Table 29: Global Beef Processed Products Revenue undefined Forecast, by Type 2020 & 2033
- Table 30: Global Beef Processed Products Revenue undefined Forecast, by Country 2020 & 2033
- Table 31: Turkey Beef Processed Products Revenue (undefined) Forecast, by Application 2020 & 2033
- Table 32: Israel Beef Processed Products Revenue (undefined) Forecast, by Application 2020 & 2033
- Table 33: GCC Beef Processed Products Revenue (undefined) Forecast, by Application 2020 & 2033
- Table 34: North Africa Beef Processed Products Revenue (undefined) Forecast, by Application 2020 & 2033
- Table 35: South Africa Beef Processed Products Revenue (undefined) Forecast, by Application 2020 & 2033
- Table 36: Rest of Middle East & Africa Beef Processed Products Revenue (undefined) Forecast, by Application 2020 & 2033
- Table 37: Global Beef Processed Products Revenue undefined Forecast, by Application 2020 & 2033
- Table 38: Global Beef Processed Products Revenue undefined Forecast, by Type 2020 & 2033
- Table 39: Global Beef Processed Products Revenue undefined Forecast, by Country 2020 & 2033
- Table 40: China Beef Processed Products Revenue (undefined) Forecast, by Application 2020 & 2033
- Table 41: India Beef Processed Products Revenue (undefined) Forecast, by Application 2020 & 2033
- Table 42: Japan Beef Processed Products Revenue (undefined) Forecast, by Application 2020 & 2033
- Table 43: South Korea Beef Processed Products Revenue (undefined) Forecast, by Application 2020 & 2033
- Table 44: ASEAN Beef Processed Products Revenue (undefined) Forecast, by Application 2020 & 2033
- Table 45: Oceania Beef Processed Products Revenue (undefined) Forecast, by Application 2020 & 2033
- Table 46: Rest of Asia Pacific Beef Processed Products Revenue (undefined) Forecast, by Application 2020 & 2033
Frequently Asked Questions
1. What is the projected Compound Annual Growth Rate (CAGR) of the Beef Processed Products?
The projected CAGR is approximately 3.45%.
2. Which companies are prominent players in the Beef Processed Products?
Key companies in the market include JBS, Marfrig Global Foods SA., Cargill Meat Solutions, BRF S.A., Vion Food Group, Yonekyu Corp., WH Group, Shandong Longda Meat Foodstuff, Weaver Meat Processing, Soalca, Triad Meat Company, Matthews Meats, Standard Meat, Marel, Hormel Foods, Tyson Foods Inc., The Lamb Company, Silver Fern Farms Ltd, Maple Leaf Foods, Samex.
3. What are the main segments of the Beef Processed Products?
The market segments include Application, Type.
4. Can you provide details about the market size?
The market size is estimated to be USD XXX N/A as of 2022.
5. What are some drivers contributing to market growth?
N/A
6. What are the notable trends driving market growth?
N/A
7. Are there any restraints impacting market growth?
N/A
8. Can you provide examples of recent developments in the market?
N/A
9. What pricing options are available for accessing the report?
Pricing options include single-user, multi-user, and enterprise licenses priced at USD 2900.00, USD 4350.00, and USD 5800.00 respectively.
10. Is the market size provided in terms of value or volume?
The market size is provided in terms of value, measured in N/A.
11. Are there any specific market keywords associated with the report?
Yes, the market keyword associated with the report is "Beef Processed Products," which aids in identifying and referencing the specific market segment covered.
12. How do I determine which pricing option suits my needs best?
The pricing options vary based on user requirements and access needs. Individual users may opt for single-user licenses, while businesses requiring broader access may choose multi-user or enterprise licenses for cost-effective access to the report.
13. Are there any additional resources or data provided in the Beef Processed Products report?
While the report offers comprehensive insights, it's advisable to review the specific contents or supplementary materials provided to ascertain if additional resources or data are available.
14. How can I stay updated on further developments or reports in the Beef Processed Products?
To stay informed about further developments, trends, and reports in the Beef Processed Products, consider subscribing to industry newsletters, following relevant companies and organizations, or regularly checking reputable industry news sources and publications.
Methodology
Step 1 - Identification of Relevant Samples Size from Population Database


Step 2 - Approaches for Defining Global Market Size (Value, Volume* & Price*)

Note*: In applicable scenarios
Step 3 - Data Sources
Primary Research
- Web Analytics
- Survey Reports
- Research Institute
- Latest Research Reports
- Opinion Leaders
Secondary Research
- Annual Reports
- White Paper
- Latest Press Release
- Industry Association
- Paid Database
- Investor Presentations

Step 4 - Data Triangulation
Involves using different sources of information in order to increase the validity of a study
These sources are likely to be stakeholders in a program - participants, other researchers, program staff, other community members, and so on.
Then we put all data in single framework & apply various statistical tools to find out the dynamic on the market.
During the analysis stage, feedback from the stakeholder groups would be compared to determine areas of agreement as well as areas of divergence