

Key Insights
The global aromatic rice market is demonstrating significant growth, propelled by a rising consumer preference for wholesome, nutrient-rich, and distinctly flavored food choices. This expansion is further supported by increasing disposable incomes, especially in emerging economies, fostering greater expenditure on premium food products such as aromatic rice. The worldwide embrace of ethnic cuisines, with basmati and other aromatic varieties frequently featured, is a substantial market growth contributor. Heightened health awareness also plays a crucial role, as consumers actively seek whole grains and naturally flavorful alternatives to processed options.
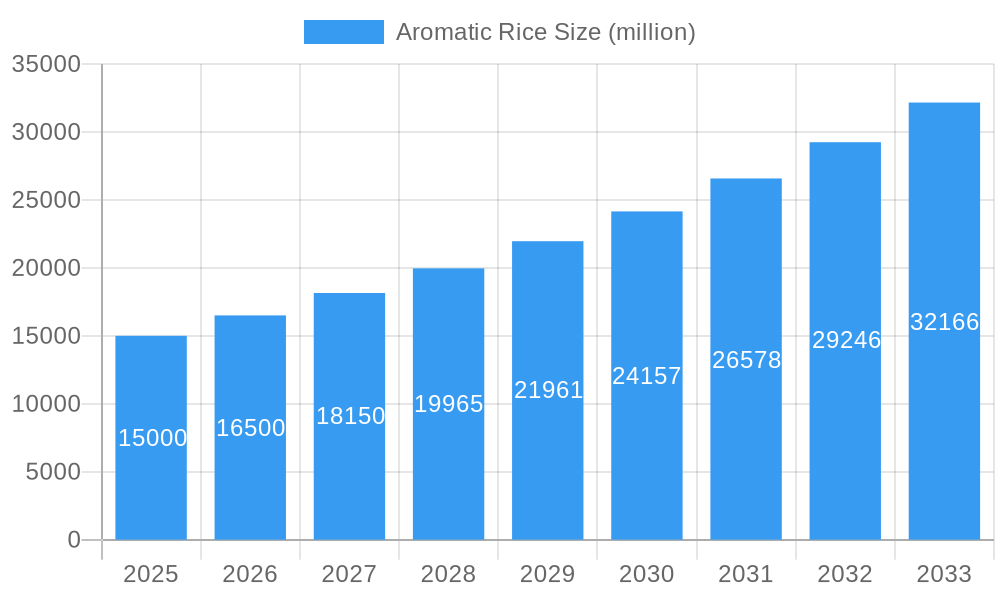
Aromatic Rice Market Size (In Billion)
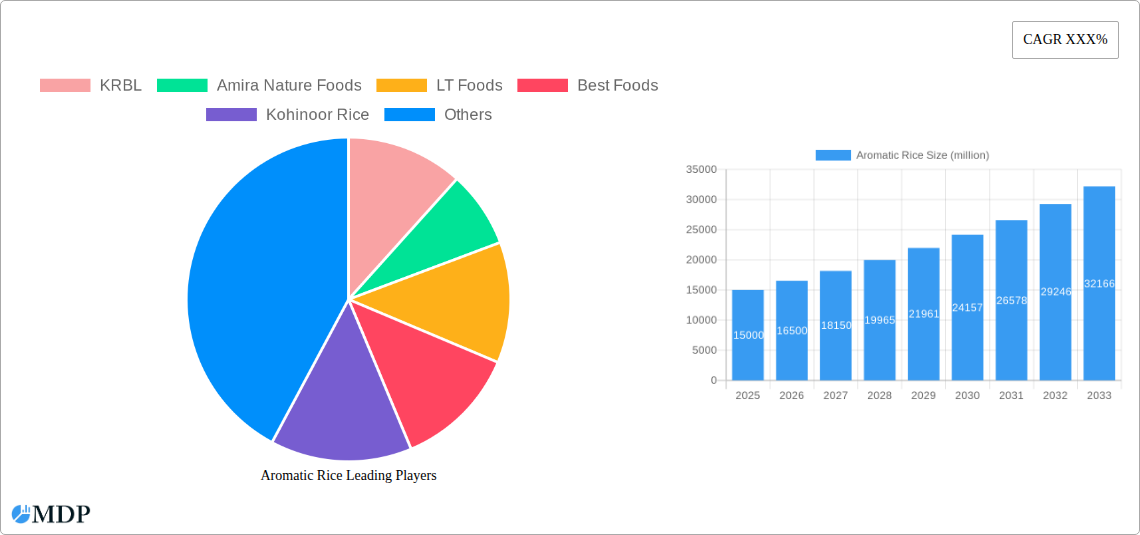
The market is strategically segmented by type (e.g., Basmati, Jasmine), distribution channels (retail, food service), and geographical regions. Leading industry participants, including KRBL, LT Foods, and Kohinoor Rice, are committed to continuous innovation, introducing convenient ready-to-cook formats and value-added products to align with evolving consumer demands. Potential impediments to growth include price volatility influenced by weather patterns and competition from alternative grains.
Aromatic Rice Company Market Share
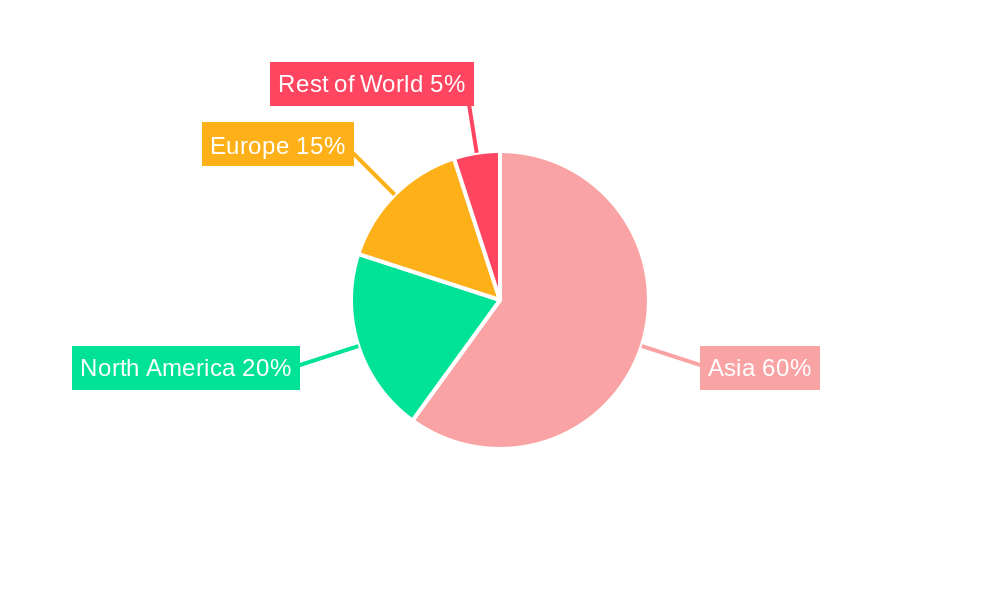
Despite these considerations, the aromatic rice market is on a trajectory of sustained expansion. The forecast period (2025-2033) projects a Compound Annual Growth Rate (CAGR) of 1.69%. This growth will be sustained by ongoing industry innovation and the broadening consumer base across both developed and developing markets. Strategic investments in research and development are enhancing rice quality, optimizing yields, and promoting sustainable agricultural practices. The expanding reach of online retail channels presents considerable opportunities for market penetration. Regional consumption patterns indicate robust growth anticipated in Asia, followed by North America and Europe. Success in this competitive landscape will hinge on product differentiation, strong brand equity, and efficient supply chain management.
The estimated market size for aromatic rice in 2025 is 302401.21 million, projected to reach higher figures by 2033, reflecting the market's positive outlook and the significant influence of the aforementioned drivers.
Aromatic Rice Market Report: 2019-2033 – A Comprehensive Analysis
Uncover the lucrative opportunities and challenges shaping the multi-billion-dollar aromatic rice market. This in-depth report provides a comprehensive analysis of the aromatic rice industry, offering actionable insights for industry stakeholders, investors, and businesses looking to navigate this dynamic market. The study period spans from 2019 to 2033, with a base year of 2025 and a forecast period from 2025 to 2033. We analyze historical data (2019-2024) and project future trends to provide a clear understanding of market dynamics. The report reveals critical information on market size, growth drivers, competitive landscape, and future opportunities, impacting millions globally.
Aromatic Rice Market Dynamics & Concentration
The global aromatic rice market, valued at $XX billion in 2024, is projected to reach $XX billion by 2033, exhibiting a CAGR of XX%. Market concentration is moderate, with several key players holding significant market share. KRBL, Amira Nature Foods, and LT Foods are among the leading companies, collectively controlling an estimated XX% of the market in 2024. Innovation in processing techniques, such as parboiling and advanced milling, is a key driver, alongside evolving consumer preferences for convenient and value-added products. Stringent regulatory frameworks regarding food safety and quality standards influence market dynamics. Substitutes like other grains and rice varieties exert some competitive pressure. The market has witnessed several mergers and acquisitions (M&A) in recent years.
- Market Share (2024): KRBL (XX%), Amira Nature Foods (XX%), LT Foods (XX%), Others (XX%)
- M&A Activity (2019-2024): XX deals, primarily focused on expanding production capacity and market reach.
- Key Trends: Increasing demand for organic and sustainably sourced aromatic rice, growing popularity of ready-to-eat products.
Aromatic Rice Industry Trends & Analysis
The aromatic rice market is characterized by dynamic growth driven by several factors. Rising disposable incomes, particularly in emerging economies, fuel increased consumption of premium rice varieties. Changing dietary preferences and health consciousness are boosting demand for aromatic rice, perceived as healthier than other grains. Technological advancements in cultivation, processing, and packaging enhance efficiency and product quality, while also promoting sustainability. However, volatile commodity prices, climate change impacts on yields, and intense competition among existing and new market entrants pose challenges. The market is projected to witness significant growth in the forecast period, driven by increasing demand in key regions.
- CAGR (2025-2033): XX%
- Market Penetration: XX% in key regions by 2033
- Key Growth Drivers: Rising disposable incomes, changing dietary habits, technological advancements
Leading Markets & Segments in Aromatic Rice
Asia dominates the global aromatic rice market, accounting for over XX% of the total consumption in 2024. India and several Southeast Asian countries are key contributors. The dominance is primarily driven by strong local consumption, large-scale production, and well-established distribution networks. Favorable government policies supporting agricultural development and the presence of significant export opportunities further contribute to the region's leadership.
- Key Drivers in Asia:
- Large consumer base with growing disposable incomes.
- Extensive cultivation suitable for aromatic rice.
- Established infrastructure for processing and distribution.
- Government support for agricultural development.
- Dominant Segments: Basmati rice holds the largest market share, driven by its superior aroma and flavor.
Aromatic Rice Product Developments
Recent product innovations focus on enhancing convenience and adding value. Ready-to-cook pouches, pre-cooked rice options, and organic/sustainable offerings are gaining popularity. Technological advancements in processing and packaging enhance product shelf life and quality. These developments cater to evolving consumer preferences for time-saving and healthy food options, which strengthens their market positioning.
Key Drivers of Aromatic Rice Growth
Several factors fuel the growth of the aromatic rice market. Technological advancements in cultivation methods lead to higher yields and improved quality. Favorable economic conditions in key regions drive consumption. Supportive government policies focused on agricultural development and export promotion also contribute significantly.
Challenges in the Aromatic Rice Market
The aromatic rice market faces challenges such as fluctuating commodity prices, climate change impacting crop yields, and intense competition. These factors create uncertainties in pricing and profitability. Supply chain disruptions and logistical challenges can also significantly impact market stability and availability.
Emerging Opportunities in Aromatic Rice
Emerging opportunities lie in expanding into new markets, especially in developed economies where demand for premium food products is rising. Strategic partnerships and collaborations between rice producers and food processing companies can generate innovative products and distribution channels. Technological breakthroughs in cultivation and processing can offer cost advantages and enhance product quality, driving further market penetration.
Leading Players in the Aromatic Rice Sector
- KRBL
- Amira Nature Foods
- LT Foods
- Best Foods
- Kohinoor Rice
- Aeroplane Rice
- Tilda Basmati Rice
- Matco Foods
- Amar Singh Chawal Wala
- Hanuman Rice Mills
- Adani Wilmar
- HAS Rice Pakistan
- Galaxy Rice Mill
- Dunar Foods
- Sungold
Key Milestones in Aromatic Rice Industry
- 2020: Increased adoption of sustainable farming practices by major players.
- 2022: Launch of several ready-to-eat aromatic rice products.
- 2023: Significant investments in advanced rice milling technologies.
- 2024: Several M&A activities consolidating market share among leading players.
Strategic Outlook for Aromatic Rice Market
The aromatic rice market presents significant growth potential driven by rising consumer demand, technological advancements, and expanding global distribution networks. Strategic focus on product innovation, sustainable farming practices, and efficient supply chain management are vital for capturing market share and achieving long-term success. Further penetration into new and existing markets with customized products tailored to consumer preferences will drive future growth.
Aromatic Rice Segmentation
-
1. Application
- 1.1. Direct Edible
- 1.2. Deep Processing
-
2. Type
- 2.1. Basmati Rice
- 2.2. Jasmine Rice
- 2.3. Others
Aromatic Rice Segmentation By Geography
-
1. North America
- 1.1. United States
- 1.2. Canada
- 1.3. Mexico
-
2. South America
- 2.1. Brazil
- 2.2. Argentina
- 2.3. Rest of South America
-
3. Europe
- 3.1. United Kingdom
- 3.2. Germany
- 3.3. France
- 3.4. Italy
- 3.5. Spain
- 3.6. Russia
- 3.7. Benelux
- 3.8. Nordics
- 3.9. Rest of Europe
-
4. Middle East & Africa
- 4.1. Turkey
- 4.2. Israel
- 4.3. GCC
- 4.4. North Africa
- 4.5. South Africa
- 4.6. Rest of Middle East & Africa
-
5. Asia Pacific
- 5.1. China
- 5.2. India
- 5.3. Japan
- 5.4. South Korea
- 5.5. ASEAN
- 5.6. Oceania
- 5.7. Rest of Asia Pacific
Aromatic Rice Regional Market Share
Geographic Coverage of Aromatic Rice
Aromatic Rice REPORT HIGHLIGHTS
| Aspects | Details |
|---|---|
| Study Period | 2020-2034 |
| Base Year | 2025 |
| Estimated Year | 2026 |
| Forecast Period | 2026-2034 |
| Historical Period | 2020-2025 |
| Growth Rate | CAGR of 1.69% from 2020-2034 |
| Segmentation |
|
Table of Contents
- 1. Introduction
- 1.1. Research Scope
- 1.2. Market Segmentation
- 1.3. Research Methodology
- 1.4. Definitions and Assumptions
- 2. Executive Summary
- 2.1. Introduction
- 3. Market Dynamics
- 3.1. Introduction
- 3.2. Market Drivers
- 3.3. Market Restrains
- 3.4. Market Trends
- 4. Market Factor Analysis
- 4.1. Porters Five Forces
- 4.2. Supply/Value Chain
- 4.3. PESTEL analysis
- 4.4. Market Entropy
- 4.5. Patent/Trademark Analysis
- 5. Global Aromatic Rice Analysis, Insights and Forecast, 2020-2032
- 5.1. Market Analysis, Insights and Forecast - by Application
- 5.1.1. Direct Edible
- 5.1.2. Deep Processing
- 5.2. Market Analysis, Insights and Forecast - by Type
- 5.2.1. Basmati Rice
- 5.2.2. Jasmine Rice
- 5.2.3. Others
- 5.3. Market Analysis, Insights and Forecast - by Region
- 5.3.1. North America
- 5.3.2. South America
- 5.3.3. Europe
- 5.3.4. Middle East & Africa
- 5.3.5. Asia Pacific
- 5.1. Market Analysis, Insights and Forecast - by Application
- 6. North America Aromatic Rice Analysis, Insights and Forecast, 2020-2032
- 6.1. Market Analysis, Insights and Forecast - by Application
- 6.1.1. Direct Edible
- 6.1.2. Deep Processing
- 6.2. Market Analysis, Insights and Forecast - by Type
- 6.2.1. Basmati Rice
- 6.2.2. Jasmine Rice
- 6.2.3. Others
- 6.1. Market Analysis, Insights and Forecast - by Application
- 7. South America Aromatic Rice Analysis, Insights and Forecast, 2020-2032
- 7.1. Market Analysis, Insights and Forecast - by Application
- 7.1.1. Direct Edible
- 7.1.2. Deep Processing
- 7.2. Market Analysis, Insights and Forecast - by Type
- 7.2.1. Basmati Rice
- 7.2.2. Jasmine Rice
- 7.2.3. Others
- 7.1. Market Analysis, Insights and Forecast - by Application
- 8. Europe Aromatic Rice Analysis, Insights and Forecast, 2020-2032
- 8.1. Market Analysis, Insights and Forecast - by Application
- 8.1.1. Direct Edible
- 8.1.2. Deep Processing
- 8.2. Market Analysis, Insights and Forecast - by Type
- 8.2.1. Basmati Rice
- 8.2.2. Jasmine Rice
- 8.2.3. Others
- 8.1. Market Analysis, Insights and Forecast - by Application
- 9. Middle East & Africa Aromatic Rice Analysis, Insights and Forecast, 2020-2032
- 9.1. Market Analysis, Insights and Forecast - by Application
- 9.1.1. Direct Edible
- 9.1.2. Deep Processing
- 9.2. Market Analysis, Insights and Forecast - by Type
- 9.2.1. Basmati Rice
- 9.2.2. Jasmine Rice
- 9.2.3. Others
- 9.1. Market Analysis, Insights and Forecast - by Application
- 10. Asia Pacific Aromatic Rice Analysis, Insights and Forecast, 2020-2032
- 10.1. Market Analysis, Insights and Forecast - by Application
- 10.1.1. Direct Edible
- 10.1.2. Deep Processing
- 10.2. Market Analysis, Insights and Forecast - by Type
- 10.2.1. Basmati Rice
- 10.2.2. Jasmine Rice
- 10.2.3. Others
- 10.1. Market Analysis, Insights and Forecast - by Application
- 11. Competitive Analysis
- 11.1. Global Market Share Analysis 2025
- 11.2. Company Profiles
- 11.2.1 KRBL
- 11.2.1.1. Overview
- 11.2.1.2. Products
- 11.2.1.3. SWOT Analysis
- 11.2.1.4. Recent Developments
- 11.2.1.5. Financials (Based on Availability)
- 11.2.2 Amira Nature Foods
- 11.2.2.1. Overview
- 11.2.2.2. Products
- 11.2.2.3. SWOT Analysis
- 11.2.2.4. Recent Developments
- 11.2.2.5. Financials (Based on Availability)
- 11.2.3 LT Foods
- 11.2.3.1. Overview
- 11.2.3.2. Products
- 11.2.3.3. SWOT Analysis
- 11.2.3.4. Recent Developments
- 11.2.3.5. Financials (Based on Availability)
- 11.2.4 Best Foods
- 11.2.4.1. Overview
- 11.2.4.2. Products
- 11.2.4.3. SWOT Analysis
- 11.2.4.4. Recent Developments
- 11.2.4.5. Financials (Based on Availability)
- 11.2.5 Kohinoor Rice
- 11.2.5.1. Overview
- 11.2.5.2. Products
- 11.2.5.3. SWOT Analysis
- 11.2.5.4. Recent Developments
- 11.2.5.5. Financials (Based on Availability)
- 11.2.6 Aeroplane Rice
- 11.2.6.1. Overview
- 11.2.6.2. Products
- 11.2.6.3. SWOT Analysis
- 11.2.6.4. Recent Developments
- 11.2.6.5. Financials (Based on Availability)
- 11.2.7 Tilda Basmati Rice
- 11.2.7.1. Overview
- 11.2.7.2. Products
- 11.2.7.3. SWOT Analysis
- 11.2.7.4. Recent Developments
- 11.2.7.5. Financials (Based on Availability)
- 11.2.8 Matco Foods
- 11.2.8.1. Overview
- 11.2.8.2. Products
- 11.2.8.3. SWOT Analysis
- 11.2.8.4. Recent Developments
- 11.2.8.5. Financials (Based on Availability)
- 11.2.9 Amar Singh Chawal Wala
- 11.2.9.1. Overview
- 11.2.9.2. Products
- 11.2.9.3. SWOT Analysis
- 11.2.9.4. Recent Developments
- 11.2.9.5. Financials (Based on Availability)
- 11.2.10 Hanuman Rice Mills
- 11.2.10.1. Overview
- 11.2.10.2. Products
- 11.2.10.3. SWOT Analysis
- 11.2.10.4. Recent Developments
- 11.2.10.5. Financials (Based on Availability)
- 11.2.11 Adani Wilmar
- 11.2.11.1. Overview
- 11.2.11.2. Products
- 11.2.11.3. SWOT Analysis
- 11.2.11.4. Recent Developments
- 11.2.11.5. Financials (Based on Availability)
- 11.2.12 HAS Rice Pakistan
- 11.2.12.1. Overview
- 11.2.12.2. Products
- 11.2.12.3. SWOT Analysis
- 11.2.12.4. Recent Developments
- 11.2.12.5. Financials (Based on Availability)
- 11.2.13 Galaxy Rice Mill
- 11.2.13.1. Overview
- 11.2.13.2. Products
- 11.2.13.3. SWOT Analysis
- 11.2.13.4. Recent Developments
- 11.2.13.5. Financials (Based on Availability)
- 11.2.14 Dunar Foods
- 11.2.14.1. Overview
- 11.2.14.2. Products
- 11.2.14.3. SWOT Analysis
- 11.2.14.4. Recent Developments
- 11.2.14.5. Financials (Based on Availability)
- 11.2.15 Sungold
- 11.2.15.1. Overview
- 11.2.15.2. Products
- 11.2.15.3. SWOT Analysis
- 11.2.15.4. Recent Developments
- 11.2.15.5. Financials (Based on Availability)
- 11.2.1 KRBL
List of Figures
- Figure 1: Global Aromatic Rice Revenue Breakdown (million, %) by Region 2025 & 2033
- Figure 2: North America Aromatic Rice Revenue (million), by Application 2025 & 2033
- Figure 3: North America Aromatic Rice Revenue Share (%), by Application 2025 & 2033
- Figure 4: North America Aromatic Rice Revenue (million), by Type 2025 & 2033
- Figure 5: North America Aromatic Rice Revenue Share (%), by Type 2025 & 2033
- Figure 6: North America Aromatic Rice Revenue (million), by Country 2025 & 2033
- Figure 7: North America Aromatic Rice Revenue Share (%), by Country 2025 & 2033
- Figure 8: South America Aromatic Rice Revenue (million), by Application 2025 & 2033
- Figure 9: South America Aromatic Rice Revenue Share (%), by Application 2025 & 2033
- Figure 10: South America Aromatic Rice Revenue (million), by Type 2025 & 2033
- Figure 11: South America Aromatic Rice Revenue Share (%), by Type 2025 & 2033
- Figure 12: South America Aromatic Rice Revenue (million), by Country 2025 & 2033
- Figure 13: South America Aromatic Rice Revenue Share (%), by Country 2025 & 2033
- Figure 14: Europe Aromatic Rice Revenue (million), by Application 2025 & 2033
- Figure 15: Europe Aromatic Rice Revenue Share (%), by Application 2025 & 2033
- Figure 16: Europe Aromatic Rice Revenue (million), by Type 2025 & 2033
- Figure 17: Europe Aromatic Rice Revenue Share (%), by Type 2025 & 2033
- Figure 18: Europe Aromatic Rice Revenue (million), by Country 2025 & 2033
- Figure 19: Europe Aromatic Rice Revenue Share (%), by Country 2025 & 2033
- Figure 20: Middle East & Africa Aromatic Rice Revenue (million), by Application 2025 & 2033
- Figure 21: Middle East & Africa Aromatic Rice Revenue Share (%), by Application 2025 & 2033
- Figure 22: Middle East & Africa Aromatic Rice Revenue (million), by Type 2025 & 2033
- Figure 23: Middle East & Africa Aromatic Rice Revenue Share (%), by Type 2025 & 2033
- Figure 24: Middle East & Africa Aromatic Rice Revenue (million), by Country 2025 & 2033
- Figure 25: Middle East & Africa Aromatic Rice Revenue Share (%), by Country 2025 & 2033
- Figure 26: Asia Pacific Aromatic Rice Revenue (million), by Application 2025 & 2033
- Figure 27: Asia Pacific Aromatic Rice Revenue Share (%), by Application 2025 & 2033
- Figure 28: Asia Pacific Aromatic Rice Revenue (million), by Type 2025 & 2033
- Figure 29: Asia Pacific Aromatic Rice Revenue Share (%), by Type 2025 & 2033
- Figure 30: Asia Pacific Aromatic Rice Revenue (million), by Country 2025 & 2033
- Figure 31: Asia Pacific Aromatic Rice Revenue Share (%), by Country 2025 & 2033
List of Tables
- Table 1: Global Aromatic Rice Revenue million Forecast, by Application 2020 & 2033
- Table 2: Global Aromatic Rice Revenue million Forecast, by Type 2020 & 2033
- Table 3: Global Aromatic Rice Revenue million Forecast, by Region 2020 & 2033
- Table 4: Global Aromatic Rice Revenue million Forecast, by Application 2020 & 2033
- Table 5: Global Aromatic Rice Revenue million Forecast, by Type 2020 & 2033
- Table 6: Global Aromatic Rice Revenue million Forecast, by Country 2020 & 2033
- Table 7: United States Aromatic Rice Revenue (million) Forecast, by Application 2020 & 2033
- Table 8: Canada Aromatic Rice Revenue (million) Forecast, by Application 2020 & 2033
- Table 9: Mexico Aromatic Rice Revenue (million) Forecast, by Application 2020 & 2033
- Table 10: Global Aromatic Rice Revenue million Forecast, by Application 2020 & 2033
- Table 11: Global Aromatic Rice Revenue million Forecast, by Type 2020 & 2033
- Table 12: Global Aromatic Rice Revenue million Forecast, by Country 2020 & 2033
- Table 13: Brazil Aromatic Rice Revenue (million) Forecast, by Application 2020 & 2033
- Table 14: Argentina Aromatic Rice Revenue (million) Forecast, by Application 2020 & 2033
- Table 15: Rest of South America Aromatic Rice Revenue (million) Forecast, by Application 2020 & 2033
- Table 16: Global Aromatic Rice Revenue million Forecast, by Application 2020 & 2033
- Table 17: Global Aromatic Rice Revenue million Forecast, by Type 2020 & 2033
- Table 18: Global Aromatic Rice Revenue million Forecast, by Country 2020 & 2033
- Table 19: United Kingdom Aromatic Rice Revenue (million) Forecast, by Application 2020 & 2033
- Table 20: Germany Aromatic Rice Revenue (million) Forecast, by Application 2020 & 2033
- Table 21: France Aromatic Rice Revenue (million) Forecast, by Application 2020 & 2033
- Table 22: Italy Aromatic Rice Revenue (million) Forecast, by Application 2020 & 2033
- Table 23: Spain Aromatic Rice Revenue (million) Forecast, by Application 2020 & 2033
- Table 24: Russia Aromatic Rice Revenue (million) Forecast, by Application 2020 & 2033
- Table 25: Benelux Aromatic Rice Revenue (million) Forecast, by Application 2020 & 2033
- Table 26: Nordics Aromatic Rice Revenue (million) Forecast, by Application 2020 & 2033
- Table 27: Rest of Europe Aromatic Rice Revenue (million) Forecast, by Application 2020 & 2033
- Table 28: Global Aromatic Rice Revenue million Forecast, by Application 2020 & 2033
- Table 29: Global Aromatic Rice Revenue million Forecast, by Type 2020 & 2033
- Table 30: Global Aromatic Rice Revenue million Forecast, by Country 2020 & 2033
- Table 31: Turkey Aromatic Rice Revenue (million) Forecast, by Application 2020 & 2033
- Table 32: Israel Aromatic Rice Revenue (million) Forecast, by Application 2020 & 2033
- Table 33: GCC Aromatic Rice Revenue (million) Forecast, by Application 2020 & 2033
- Table 34: North Africa Aromatic Rice Revenue (million) Forecast, by Application 2020 & 2033
- Table 35: South Africa Aromatic Rice Revenue (million) Forecast, by Application 2020 & 2033
- Table 36: Rest of Middle East & Africa Aromatic Rice Revenue (million) Forecast, by Application 2020 & 2033
- Table 37: Global Aromatic Rice Revenue million Forecast, by Application 2020 & 2033
- Table 38: Global Aromatic Rice Revenue million Forecast, by Type 2020 & 2033
- Table 39: Global Aromatic Rice Revenue million Forecast, by Country 2020 & 2033
- Table 40: China Aromatic Rice Revenue (million) Forecast, by Application 2020 & 2033
- Table 41: India Aromatic Rice Revenue (million) Forecast, by Application 2020 & 2033
- Table 42: Japan Aromatic Rice Revenue (million) Forecast, by Application 2020 & 2033
- Table 43: South Korea Aromatic Rice Revenue (million) Forecast, by Application 2020 & 2033
- Table 44: ASEAN Aromatic Rice Revenue (million) Forecast, by Application 2020 & 2033
- Table 45: Oceania Aromatic Rice Revenue (million) Forecast, by Application 2020 & 2033
- Table 46: Rest of Asia Pacific Aromatic Rice Revenue (million) Forecast, by Application 2020 & 2033
Frequently Asked Questions
1. What is the projected Compound Annual Growth Rate (CAGR) of the Aromatic Rice?
The projected CAGR is approximately 1.69%.
2. Which companies are prominent players in the Aromatic Rice?
Key companies in the market include KRBL, Amira Nature Foods, LT Foods, Best Foods, Kohinoor Rice, Aeroplane Rice, Tilda Basmati Rice, Matco Foods, Amar Singh Chawal Wala, Hanuman Rice Mills, Adani Wilmar, HAS Rice Pakistan, Galaxy Rice Mill, Dunar Foods, Sungold.
3. What are the main segments of the Aromatic Rice?
The market segments include Application, Type.
4. Can you provide details about the market size?
The market size is estimated to be USD 302401.21 million as of 2022.
5. What are some drivers contributing to market growth?
N/A
6. What are the notable trends driving market growth?
N/A
7. Are there any restraints impacting market growth?
N/A
8. Can you provide examples of recent developments in the market?
N/A
9. What pricing options are available for accessing the report?
Pricing options include single-user, multi-user, and enterprise licenses priced at USD 2900.00, USD 4350.00, and USD 5800.00 respectively.
10. Is the market size provided in terms of value or volume?
The market size is provided in terms of value, measured in million.
11. Are there any specific market keywords associated with the report?
Yes, the market keyword associated with the report is "Aromatic Rice," which aids in identifying and referencing the specific market segment covered.
12. How do I determine which pricing option suits my needs best?
The pricing options vary based on user requirements and access needs. Individual users may opt for single-user licenses, while businesses requiring broader access may choose multi-user or enterprise licenses for cost-effective access to the report.
13. Are there any additional resources or data provided in the Aromatic Rice report?
While the report offers comprehensive insights, it's advisable to review the specific contents or supplementary materials provided to ascertain if additional resources or data are available.
14. How can I stay updated on further developments or reports in the Aromatic Rice?
To stay informed about further developments, trends, and reports in the Aromatic Rice, consider subscribing to industry newsletters, following relevant companies and organizations, or regularly checking reputable industry news sources and publications.
Methodology
Step 1 - Identification of Relevant Samples Size from Population Database


Step 2 - Approaches for Defining Global Market Size (Value, Volume* & Price*)

Note*: In applicable scenarios
Step 3 - Data Sources
Primary Research
- Web Analytics
- Survey Reports
- Research Institute
- Latest Research Reports
- Opinion Leaders
Secondary Research
- Annual Reports
- White Paper
- Latest Press Release
- Industry Association
- Paid Database
- Investor Presentations

Step 4 - Data Triangulation
Involves using different sources of information in order to increase the validity of a study
These sources are likely to be stakeholders in a program - participants, other researchers, program staff, other community members, and so on.
Then we put all data in single framework & apply various statistical tools to find out the dynamic on the market.
During the analysis stage, feedback from the stakeholder groups would be compared to determine areas of agreement as well as areas of divergence