

Key Insights
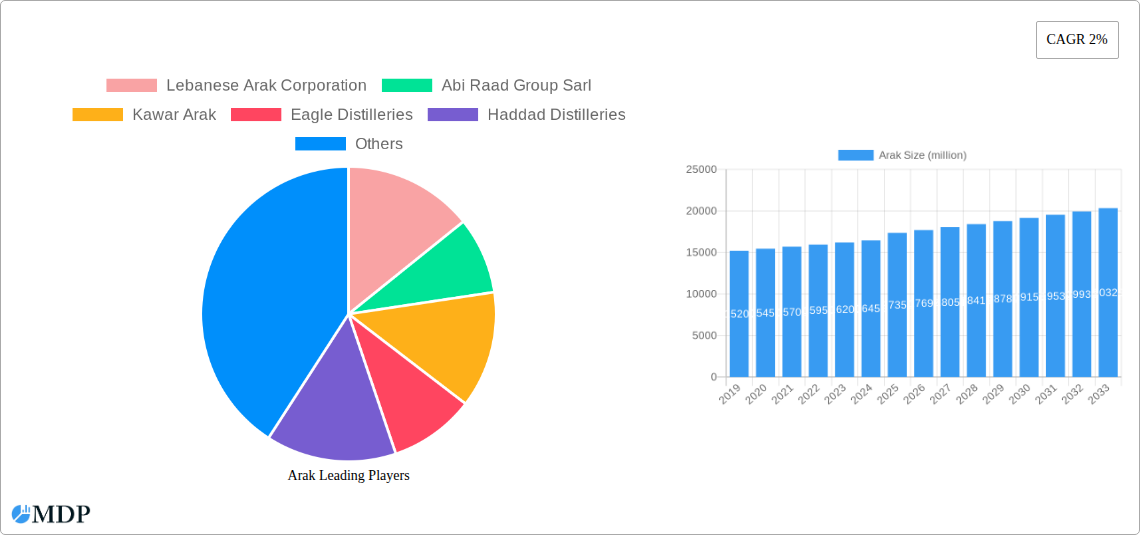
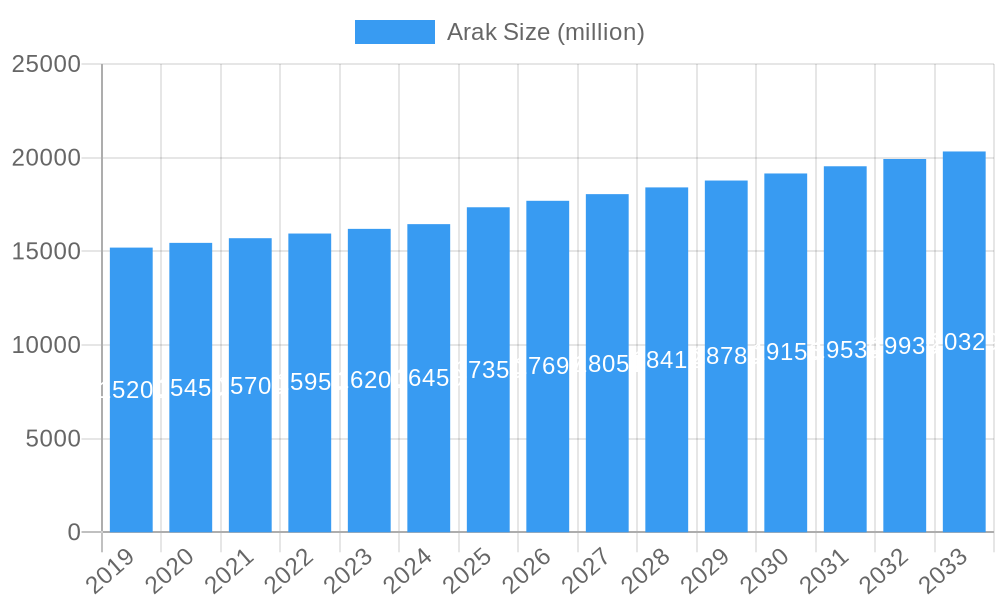
The global Arak market is poised for steady growth, projected to reach a valuation of $17,350 million by 2025, with an anticipated Compound Annual Growth Rate (CAGR) of 2% from 2019 to 2033. This expansion is driven by a confluence of factors, including the increasing popularity of traditional and artisanal spirits, a growing appreciation for anise-flavored beverages, and the vibrant culinary tourism scene in key producing and consuming regions like the Middle East and parts of Europe. The market's resilience is further bolstered by its established presence in key distribution channels such as supermarkets, travel retail outlets, and dedicated liquor shops, catering to both local consumers and tourists seeking authentic experiences. Bars and pubs also represent a significant segment, where Arak is often enjoyed in social settings and as a component of mixed drinks, contributing to its sustained demand. The forecast period indicates a sustained, albeit moderate, upward trajectory, reflecting a mature market that continues to benefit from cultural relevance and evolving consumer preferences for distinctive alcoholic beverages.
Arak Market Size (In Billion)
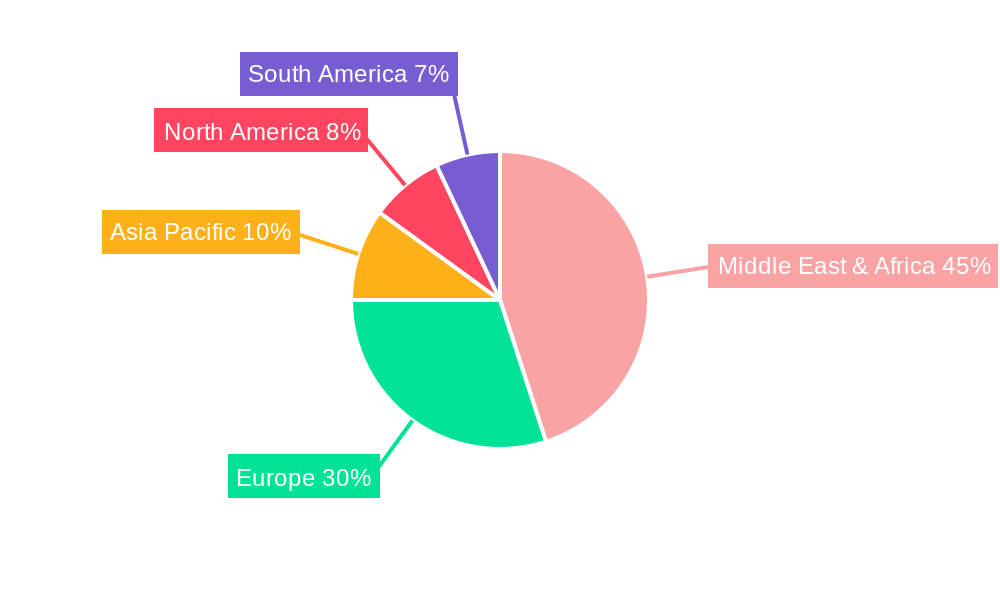
The Arak market's segmentation by grape varietal and flavoring agent highlights niche opportunities and established staples. While Obeidi grapes form the foundation of many traditional Arak varieties, the inclusion of Merwah grapes may signal a trend towards premiumization and distinct flavor profiles, appealing to a more discerning consumer base. The integral role of anise seeds in defining Arak's characteristic flavor profile remains a constant, ensuring its unique market position. Geographically, the Middle East and Africa region is expected to remain a dominant force, not only in production but also in consumption, owing to deep-rooted cultural traditions associated with Arak. Europe, with its established interest in anise-flavored spirits and a growing appreciation for Mediterranean and Middle Eastern cuisine, also presents a substantial market. Emerging economies within Asia Pacific and expanding consumer bases in North and South America represent avenues for future growth, particularly through increased awareness and availability. Major players like Lebanese Arak Corporation, Abi Raad Group Sarl, and Kawar Arak are instrumental in shaping market dynamics through product innovation, strategic distribution, and brand building, navigating the competitive landscape to maintain and expand their market share.
Arak Company Market Share
Here is an SEO-optimized, engaging report description for the Arak market, incorporating high-traffic keywords and adhering to your specifications.
Arak Market Report: Forecast to 2033 – Trends, Opportunities, and Leading Players
This comprehensive Arak market report delves into the dynamic landscape of this traditional spirit, providing in-depth analysis and actionable insights for industry stakeholders. Covering the period from 2019 to 2033, with a base and estimated year of 2025, the report offers a detailed understanding of market concentration, growth drivers, segmentation, and the competitive environment. Explore the evolution of the Arak industry, from its historical roots to its projected trajectory, and identify the key factors shaping its future. This report is essential for businesses seeking to capitalize on emerging opportunities within the global Arak market.
Arak Market Dynamics & Concentration
The Arak market, while steeped in tradition, is experiencing evolving dynamics driven by shifting consumer preferences and increasing industry consolidation. Market concentration is moderate, with several established players and a growing number of artisanal producers. Key innovation drivers include the development of premium Arak varieties, innovative packaging solutions, and the exploration of novel anise seed strains and grape varietals like Obeidi and Merwah. Regulatory frameworks, particularly concerning alcohol production and distribution in key producing nations and export markets, significantly influence market entry and growth. Product substitutes, such as other anise-flavored spirits and traditional beverages, present a constant competitive challenge. End-user trends indicate a growing appreciation for authenticity, craftsmanship, and provenance, driving demand for high-quality Arak. Merger and acquisition (M&A) activities are anticipated to increase as larger corporations seek to expand their portfolios and leverage established distribution networks. While specific M&A deal counts are still developing, an estimated XX such transactions are projected within the forecast period, signaling a trend towards market consolidation. The Lebanese Arak Corporation is expected to maintain a significant market share of approximately XX% in the historical period.
Arak Industry Trends & Analysis
The Arak industry is poised for robust growth, driven by a confluence of factors that are reshaping its global appeal and market penetration. The projected Compound Annual Growth Rate (CAGR) for the Arak market is an impressive XX%, indicating a significant expansion over the forecast period of 2025–2033. This growth is fueled by increasing consumer interest in traditional and artisanal spirits, particularly within emerging markets. Technological disruptions are playing a subtle yet significant role, with advancements in distillation techniques and quality control measures enhancing the consistency and appeal of Arak products. Consumer preferences are evolving, with a rising demand for premium, small-batch Arak that highlights the unique terroir and traditional production methods. This shift is particularly evident in regions with strong cultural ties to Arak, as well as in cosmopolitan urban centers. Competitive dynamics within the Arak sector are characterized by a blend of well-established family-owned distilleries and a growing number of new entrants focused on niche markets. The influence of Middle Eastern and Mediterranean culinary trends on global dining also indirectly boosts Arak's visibility and consumption. Market penetration is expected to deepen, moving beyond traditional strongholds into new geographical territories, propelled by increased tourism and a growing global palate for unique spirits.
Leading Markets & Segments in Arak
The dominance within the Arak market is multi-faceted, with specific regions and segments exhibiting significant influence. Application plays a crucial role, with Supermarkets and Liquor Shops emerging as primary distribution channels, accounting for an estimated XX% of total sales. The Bar/Pub segment is also a significant driver, particularly in urban and tourist-heavy areas, contributing an estimated XX% to market revenue. Travel Retail, while currently representing a smaller share at XX%, holds immense potential for growth due to the global mobility of consumers interested in authentic local products.
In terms of Type, the classic Obeidi or Merwah Grapes varietals remain the bedrock of the Arak industry, accounting for an overwhelming XX% of production. The quality and distinct flavor profiles derived from these indigenous grapes are a primary reason for their continued dominance. Anise Seeds are, of course, integral to the production process, with the quality and origin of these seeds significantly impacting the final product's aroma and taste. Countries like Lebanon, Syria, Jordan, and Palestine are the traditional powerhouses of Arak production and consumption, with their economic policies, regulatory frameworks for alcohol production, and established distribution networks underpinning market stability. For instance, Lebanon's long-standing expertise in Arak distillation and its established export channels contribute significantly to its leading position. Infrastructure development, including improvements in transportation and cold chain logistics, is crucial for expanding market reach, particularly in emerging export markets. The cultural significance of Arak in these regions further solidifies its market position, ensuring consistent demand from local consumers.
Arak Product Developments
Product innovation in the Arak sector primarily focuses on elevating the traditional spirit through enhanced quality, unique flavor profiles, and premium presentation. Companies are investing in advanced distillation techniques and meticulous selection of Obeidi or Merwah grapes and high-grade anise seeds to produce more refined and complex Arak expressions. The application of these innovations caters to a growing segment of discerning consumers seeking artisanal and small-batch spirits. Competitive advantages are being carved out through limited-edition releases, aged Arak variants, and collaborations with renowned chefs or mixologists, further enhancing market appeal and brand differentiation.
Key Drivers of Arak Growth
The growth of the Arak market is propelled by several interconnected factors. Technologically, advancements in distillation and maturation processes are leading to higher quality and more diverse Arak offerings. Economically, rising disposable incomes in key consumer regions and a growing appreciation for premium spirits contribute significantly. Regulatory environments, when supportive of traditional spirit production and export, also act as a catalyst. Furthermore, the increasing global interest in authentic culinary experiences and unique cultural beverages directly fuels demand for traditional spirits like Arak.
Challenges in the Arak Market
Despite its growth potential, the Arak market faces notable challenges. Regulatory hurdles in certain export markets, including stringent import duties and local production mandates, can impede market expansion. Supply chain complexities, from grape cultivation to anise seed sourcing and efficient distribution, require careful management. Competitive pressures from other anise-flavored spirits and a broader spectrum of alcoholic beverages necessitate continuous product differentiation and effective marketing strategies. The estimated impact of these challenges on market growth is projected to be XX% in terms of reduced expansion potential.
Emerging Opportunities in Arak
Catalysts for long-term growth in the Arak market are numerous and promising. Technological breakthroughs in sustainable distillation and flavor extraction offer opportunities for developing novel and environmentally friendly Arak variants. Strategic partnerships between established distilleries and international distributors can unlock new geographic markets and consumer demographics. Furthermore, proactive market expansion strategies targeting nascent markets with a growing appetite for artisanal spirits, coupled with innovative branding and marketing campaigns, will be crucial for capitalizing on future potential.
Leading Players in the Arak Sector
- Lebanese Arak Corporation
- Abi Raad Group Sarl
- Kawar Arak
- Eagle Distilleries
- Haddad Distilleries
- Château Ksara
- Lebanese Fine Wines
- Domaine des Tourelles
Key Milestones in Arak Industry
- 2019/XX: Launch of premium, single-vineyard Arak expressions by artisanal producers, signaling a shift towards high-end offerings.
- 2020/XX: Increased focus on sustainable sourcing of Obeidi and Merwah grapes, driven by environmental consciousness.
- 2021/XX: Expansion of Arak's presence in European travel retail, capitalizing on growing consumer interest in unique spirits.
- 2022/XX: Introduction of innovative packaging designs and gifting options, enhancing Arak's appeal as a premium beverage.
- 2023/XX: Growing adoption of digital marketing strategies and e-commerce platforms to reach a wider global audience.
- 2024/XX: Emergence of new craft Arak distilleries in non-traditional regions, diversifying production and taste profiles.
Strategic Outlook for Arak Market
The strategic outlook for the Arak market is exceptionally bright, with significant growth accelerators poised to drive future expansion. The increasing global consumer demand for authentic, high-quality, and culturally significant beverages presents a substantial opportunity. Innovations in production techniques and ingredient sourcing will enable the creation of a wider array of Arak products, catering to diverse palates. Strategic partnerships and targeted market entry into emerging economies, combined with effective branding that emphasizes heritage and craftsmanship, will be key to unlocking this vast potential and solidifying Arak's position as a sought-after spirit on the international stage.
Arak Segmentation
-
1. Application
- 1.1. Supermarket
- 1.2. Travel Retail
- 1.3. Liquor Shop
- 1.4. Bar/Pub
-
2. Type
- 2.1. Obeidi or Merwah Grapes
- 2.2. Anise Seeds
Arak Segmentation By Geography
-
1. North America
- 1.1. United States
- 1.2. Canada
- 1.3. Mexico
-
2. South America
- 2.1. Brazil
- 2.2. Argentina
- 2.3. Rest of South America
-
3. Europe
- 3.1. United Kingdom
- 3.2. Germany
- 3.3. France
- 3.4. Italy
- 3.5. Spain
- 3.6. Russia
- 3.7. Benelux
- 3.8. Nordics
- 3.9. Rest of Europe
-
4. Middle East & Africa
- 4.1. Turkey
- 4.2. Israel
- 4.3. GCC
- 4.4. North Africa
- 4.5. South Africa
- 4.6. Rest of Middle East & Africa
-
5. Asia Pacific
- 5.1. China
- 5.2. India
- 5.3. Japan
- 5.4. South Korea
- 5.5. ASEAN
- 5.6. Oceania
- 5.7. Rest of Asia Pacific
Arak Regional Market Share
Geographic Coverage of Arak
Arak REPORT HIGHLIGHTS
| Aspects | Details |
|---|---|
| Study Period | 2020-2034 |
| Base Year | 2025 |
| Estimated Year | 2026 |
| Forecast Period | 2026-2034 |
| Historical Period | 2020-2025 |
| Growth Rate | CAGR of 2% from 2020-2034 |
| Segmentation |
|
Table of Contents
- 1. Introduction
- 1.1. Research Scope
- 1.2. Market Segmentation
- 1.3. Research Methodology
- 1.4. Definitions and Assumptions
- 2. Executive Summary
- 2.1. Introduction
- 3. Market Dynamics
- 3.1. Introduction
- 3.2. Market Drivers
- 3.3. Market Restrains
- 3.4. Market Trends
- 4. Market Factor Analysis
- 4.1. Porters Five Forces
- 4.2. Supply/Value Chain
- 4.3. PESTEL analysis
- 4.4. Market Entropy
- 4.5. Patent/Trademark Analysis
- 5. Global Arak Analysis, Insights and Forecast, 2020-2032
- 5.1. Market Analysis, Insights and Forecast - by Application
- 5.1.1. Supermarket
- 5.1.2. Travel Retail
- 5.1.3. Liquor Shop
- 5.1.4. Bar/Pub
- 5.2. Market Analysis, Insights and Forecast - by Type
- 5.2.1. Obeidi or Merwah Grapes
- 5.2.2. Anise Seeds
- 5.3. Market Analysis, Insights and Forecast - by Region
- 5.3.1. North America
- 5.3.2. South America
- 5.3.3. Europe
- 5.3.4. Middle East & Africa
- 5.3.5. Asia Pacific
- 5.1. Market Analysis, Insights and Forecast - by Application
- 6. North America Arak Analysis, Insights and Forecast, 2020-2032
- 6.1. Market Analysis, Insights and Forecast - by Application
- 6.1.1. Supermarket
- 6.1.2. Travel Retail
- 6.1.3. Liquor Shop
- 6.1.4. Bar/Pub
- 6.2. Market Analysis, Insights and Forecast - by Type
- 6.2.1. Obeidi or Merwah Grapes
- 6.2.2. Anise Seeds
- 6.1. Market Analysis, Insights and Forecast - by Application
- 7. South America Arak Analysis, Insights and Forecast, 2020-2032
- 7.1. Market Analysis, Insights and Forecast - by Application
- 7.1.1. Supermarket
- 7.1.2. Travel Retail
- 7.1.3. Liquor Shop
- 7.1.4. Bar/Pub
- 7.2. Market Analysis, Insights and Forecast - by Type
- 7.2.1. Obeidi or Merwah Grapes
- 7.2.2. Anise Seeds
- 7.1. Market Analysis, Insights and Forecast - by Application
- 8. Europe Arak Analysis, Insights and Forecast, 2020-2032
- 8.1. Market Analysis, Insights and Forecast - by Application
- 8.1.1. Supermarket
- 8.1.2. Travel Retail
- 8.1.3. Liquor Shop
- 8.1.4. Bar/Pub
- 8.2. Market Analysis, Insights and Forecast - by Type
- 8.2.1. Obeidi or Merwah Grapes
- 8.2.2. Anise Seeds
- 8.1. Market Analysis, Insights and Forecast - by Application
- 9. Middle East & Africa Arak Analysis, Insights and Forecast, 2020-2032
- 9.1. Market Analysis, Insights and Forecast - by Application
- 9.1.1. Supermarket
- 9.1.2. Travel Retail
- 9.1.3. Liquor Shop
- 9.1.4. Bar/Pub
- 9.2. Market Analysis, Insights and Forecast - by Type
- 9.2.1. Obeidi or Merwah Grapes
- 9.2.2. Anise Seeds
- 9.1. Market Analysis, Insights and Forecast - by Application
- 10. Asia Pacific Arak Analysis, Insights and Forecast, 2020-2032
- 10.1. Market Analysis, Insights and Forecast - by Application
- 10.1.1. Supermarket
- 10.1.2. Travel Retail
- 10.1.3. Liquor Shop
- 10.1.4. Bar/Pub
- 10.2. Market Analysis, Insights and Forecast - by Type
- 10.2.1. Obeidi or Merwah Grapes
- 10.2.2. Anise Seeds
- 10.1. Market Analysis, Insights and Forecast - by Application
- 11. Competitive Analysis
- 11.1. Global Market Share Analysis 2025
- 11.2. Company Profiles
- 11.2.1 Lebanese Arak Corporation
- 11.2.1.1. Overview
- 11.2.1.2. Products
- 11.2.1.3. SWOT Analysis
- 11.2.1.4. Recent Developments
- 11.2.1.5. Financials (Based on Availability)
- 11.2.2 Abi Raad Group Sarl
- 11.2.2.1. Overview
- 11.2.2.2. Products
- 11.2.2.3. SWOT Analysis
- 11.2.2.4. Recent Developments
- 11.2.2.5. Financials (Based on Availability)
- 11.2.3 Kawar Arak
- 11.2.3.1. Overview
- 11.2.3.2. Products
- 11.2.3.3. SWOT Analysis
- 11.2.3.4. Recent Developments
- 11.2.3.5. Financials (Based on Availability)
- 11.2.4 Eagle Distilleries
- 11.2.4.1. Overview
- 11.2.4.2. Products
- 11.2.4.3. SWOT Analysis
- 11.2.4.4. Recent Developments
- 11.2.4.5. Financials (Based on Availability)
- 11.2.5 Haddad Distilleries
- 11.2.5.1. Overview
- 11.2.5.2. Products
- 11.2.5.3. SWOT Analysis
- 11.2.5.4. Recent Developments
- 11.2.5.5. Financials (Based on Availability)
- 11.2.6 Château Ksara
- 11.2.6.1. Overview
- 11.2.6.2. Products
- 11.2.6.3. SWOT Analysis
- 11.2.6.4. Recent Developments
- 11.2.6.5. Financials (Based on Availability)
- 11.2.7 Lebanese Fine Wines
- 11.2.7.1. Overview
- 11.2.7.2. Products
- 11.2.7.3. SWOT Analysis
- 11.2.7.4. Recent Developments
- 11.2.7.5. Financials (Based on Availability)
- 11.2.8 Domaine des Tourelles
- 11.2.8.1. Overview
- 11.2.8.2. Products
- 11.2.8.3. SWOT Analysis
- 11.2.8.4. Recent Developments
- 11.2.8.5. Financials (Based on Availability)
- 11.2.1 Lebanese Arak Corporation
List of Figures
- Figure 1: Global Arak Revenue Breakdown (million, %) by Region 2025 & 2033
- Figure 2: Global Arak Volume Breakdown (K, %) by Region 2025 & 2033
- Figure 3: North America Arak Revenue (million), by Application 2025 & 2033
- Figure 4: North America Arak Volume (K), by Application 2025 & 2033
- Figure 5: North America Arak Revenue Share (%), by Application 2025 & 2033
- Figure 6: North America Arak Volume Share (%), by Application 2025 & 2033
- Figure 7: North America Arak Revenue (million), by Type 2025 & 2033
- Figure 8: North America Arak Volume (K), by Type 2025 & 2033
- Figure 9: North America Arak Revenue Share (%), by Type 2025 & 2033
- Figure 10: North America Arak Volume Share (%), by Type 2025 & 2033
- Figure 11: North America Arak Revenue (million), by Country 2025 & 2033
- Figure 12: North America Arak Volume (K), by Country 2025 & 2033
- Figure 13: North America Arak Revenue Share (%), by Country 2025 & 2033
- Figure 14: North America Arak Volume Share (%), by Country 2025 & 2033
- Figure 15: South America Arak Revenue (million), by Application 2025 & 2033
- Figure 16: South America Arak Volume (K), by Application 2025 & 2033
- Figure 17: South America Arak Revenue Share (%), by Application 2025 & 2033
- Figure 18: South America Arak Volume Share (%), by Application 2025 & 2033
- Figure 19: South America Arak Revenue (million), by Type 2025 & 2033
- Figure 20: South America Arak Volume (K), by Type 2025 & 2033
- Figure 21: South America Arak Revenue Share (%), by Type 2025 & 2033
- Figure 22: South America Arak Volume Share (%), by Type 2025 & 2033
- Figure 23: South America Arak Revenue (million), by Country 2025 & 2033
- Figure 24: South America Arak Volume (K), by Country 2025 & 2033
- Figure 25: South America Arak Revenue Share (%), by Country 2025 & 2033
- Figure 26: South America Arak Volume Share (%), by Country 2025 & 2033
- Figure 27: Europe Arak Revenue (million), by Application 2025 & 2033
- Figure 28: Europe Arak Volume (K), by Application 2025 & 2033
- Figure 29: Europe Arak Revenue Share (%), by Application 2025 & 2033
- Figure 30: Europe Arak Volume Share (%), by Application 2025 & 2033
- Figure 31: Europe Arak Revenue (million), by Type 2025 & 2033
- Figure 32: Europe Arak Volume (K), by Type 2025 & 2033
- Figure 33: Europe Arak Revenue Share (%), by Type 2025 & 2033
- Figure 34: Europe Arak Volume Share (%), by Type 2025 & 2033
- Figure 35: Europe Arak Revenue (million), by Country 2025 & 2033
- Figure 36: Europe Arak Volume (K), by Country 2025 & 2033
- Figure 37: Europe Arak Revenue Share (%), by Country 2025 & 2033
- Figure 38: Europe Arak Volume Share (%), by Country 2025 & 2033
- Figure 39: Middle East & Africa Arak Revenue (million), by Application 2025 & 2033
- Figure 40: Middle East & Africa Arak Volume (K), by Application 2025 & 2033
- Figure 41: Middle East & Africa Arak Revenue Share (%), by Application 2025 & 2033
- Figure 42: Middle East & Africa Arak Volume Share (%), by Application 2025 & 2033
- Figure 43: Middle East & Africa Arak Revenue (million), by Type 2025 & 2033
- Figure 44: Middle East & Africa Arak Volume (K), by Type 2025 & 2033
- Figure 45: Middle East & Africa Arak Revenue Share (%), by Type 2025 & 2033
- Figure 46: Middle East & Africa Arak Volume Share (%), by Type 2025 & 2033
- Figure 47: Middle East & Africa Arak Revenue (million), by Country 2025 & 2033
- Figure 48: Middle East & Africa Arak Volume (K), by Country 2025 & 2033
- Figure 49: Middle East & Africa Arak Revenue Share (%), by Country 2025 & 2033
- Figure 50: Middle East & Africa Arak Volume Share (%), by Country 2025 & 2033
- Figure 51: Asia Pacific Arak Revenue (million), by Application 2025 & 2033
- Figure 52: Asia Pacific Arak Volume (K), by Application 2025 & 2033
- Figure 53: Asia Pacific Arak Revenue Share (%), by Application 2025 & 2033
- Figure 54: Asia Pacific Arak Volume Share (%), by Application 2025 & 2033
- Figure 55: Asia Pacific Arak Revenue (million), by Type 2025 & 2033
- Figure 56: Asia Pacific Arak Volume (K), by Type 2025 & 2033
- Figure 57: Asia Pacific Arak Revenue Share (%), by Type 2025 & 2033
- Figure 58: Asia Pacific Arak Volume Share (%), by Type 2025 & 2033
- Figure 59: Asia Pacific Arak Revenue (million), by Country 2025 & 2033
- Figure 60: Asia Pacific Arak Volume (K), by Country 2025 & 2033
- Figure 61: Asia Pacific Arak Revenue Share (%), by Country 2025 & 2033
- Figure 62: Asia Pacific Arak Volume Share (%), by Country 2025 & 2033
List of Tables
- Table 1: Global Arak Revenue million Forecast, by Application 2020 & 2033
- Table 2: Global Arak Volume K Forecast, by Application 2020 & 2033
- Table 3: Global Arak Revenue million Forecast, by Type 2020 & 2033
- Table 4: Global Arak Volume K Forecast, by Type 2020 & 2033
- Table 5: Global Arak Revenue million Forecast, by Region 2020 & 2033
- Table 6: Global Arak Volume K Forecast, by Region 2020 & 2033
- Table 7: Global Arak Revenue million Forecast, by Application 2020 & 2033
- Table 8: Global Arak Volume K Forecast, by Application 2020 & 2033
- Table 9: Global Arak Revenue million Forecast, by Type 2020 & 2033
- Table 10: Global Arak Volume K Forecast, by Type 2020 & 2033
- Table 11: Global Arak Revenue million Forecast, by Country 2020 & 2033
- Table 12: Global Arak Volume K Forecast, by Country 2020 & 2033
- Table 13: United States Arak Revenue (million) Forecast, by Application 2020 & 2033
- Table 14: United States Arak Volume (K) Forecast, by Application 2020 & 2033
- Table 15: Canada Arak Revenue (million) Forecast, by Application 2020 & 2033
- Table 16: Canada Arak Volume (K) Forecast, by Application 2020 & 2033
- Table 17: Mexico Arak Revenue (million) Forecast, by Application 2020 & 2033
- Table 18: Mexico Arak Volume (K) Forecast, by Application 2020 & 2033
- Table 19: Global Arak Revenue million Forecast, by Application 2020 & 2033
- Table 20: Global Arak Volume K Forecast, by Application 2020 & 2033
- Table 21: Global Arak Revenue million Forecast, by Type 2020 & 2033
- Table 22: Global Arak Volume K Forecast, by Type 2020 & 2033
- Table 23: Global Arak Revenue million Forecast, by Country 2020 & 2033
- Table 24: Global Arak Volume K Forecast, by Country 2020 & 2033
- Table 25: Brazil Arak Revenue (million) Forecast, by Application 2020 & 2033
- Table 26: Brazil Arak Volume (K) Forecast, by Application 2020 & 2033
- Table 27: Argentina Arak Revenue (million) Forecast, by Application 2020 & 2033
- Table 28: Argentina Arak Volume (K) Forecast, by Application 2020 & 2033
- Table 29: Rest of South America Arak Revenue (million) Forecast, by Application 2020 & 2033
- Table 30: Rest of South America Arak Volume (K) Forecast, by Application 2020 & 2033
- Table 31: Global Arak Revenue million Forecast, by Application 2020 & 2033
- Table 32: Global Arak Volume K Forecast, by Application 2020 & 2033
- Table 33: Global Arak Revenue million Forecast, by Type 2020 & 2033
- Table 34: Global Arak Volume K Forecast, by Type 2020 & 2033
- Table 35: Global Arak Revenue million Forecast, by Country 2020 & 2033
- Table 36: Global Arak Volume K Forecast, by Country 2020 & 2033
- Table 37: United Kingdom Arak Revenue (million) Forecast, by Application 2020 & 2033
- Table 38: United Kingdom Arak Volume (K) Forecast, by Application 2020 & 2033
- Table 39: Germany Arak Revenue (million) Forecast, by Application 2020 & 2033
- Table 40: Germany Arak Volume (K) Forecast, by Application 2020 & 2033
- Table 41: France Arak Revenue (million) Forecast, by Application 2020 & 2033
- Table 42: France Arak Volume (K) Forecast, by Application 2020 & 2033
- Table 43: Italy Arak Revenue (million) Forecast, by Application 2020 & 2033
- Table 44: Italy Arak Volume (K) Forecast, by Application 2020 & 2033
- Table 45: Spain Arak Revenue (million) Forecast, by Application 2020 & 2033
- Table 46: Spain Arak Volume (K) Forecast, by Application 2020 & 2033
- Table 47: Russia Arak Revenue (million) Forecast, by Application 2020 & 2033
- Table 48: Russia Arak Volume (K) Forecast, by Application 2020 & 2033
- Table 49: Benelux Arak Revenue (million) Forecast, by Application 2020 & 2033
- Table 50: Benelux Arak Volume (K) Forecast, by Application 2020 & 2033
- Table 51: Nordics Arak Revenue (million) Forecast, by Application 2020 & 2033
- Table 52: Nordics Arak Volume (K) Forecast, by Application 2020 & 2033
- Table 53: Rest of Europe Arak Revenue (million) Forecast, by Application 2020 & 2033
- Table 54: Rest of Europe Arak Volume (K) Forecast, by Application 2020 & 2033
- Table 55: Global Arak Revenue million Forecast, by Application 2020 & 2033
- Table 56: Global Arak Volume K Forecast, by Application 2020 & 2033
- Table 57: Global Arak Revenue million Forecast, by Type 2020 & 2033
- Table 58: Global Arak Volume K Forecast, by Type 2020 & 2033
- Table 59: Global Arak Revenue million Forecast, by Country 2020 & 2033
- Table 60: Global Arak Volume K Forecast, by Country 2020 & 2033
- Table 61: Turkey Arak Revenue (million) Forecast, by Application 2020 & 2033
- Table 62: Turkey Arak Volume (K) Forecast, by Application 2020 & 2033
- Table 63: Israel Arak Revenue (million) Forecast, by Application 2020 & 2033
- Table 64: Israel Arak Volume (K) Forecast, by Application 2020 & 2033
- Table 65: GCC Arak Revenue (million) Forecast, by Application 2020 & 2033
- Table 66: GCC Arak Volume (K) Forecast, by Application 2020 & 2033
- Table 67: North Africa Arak Revenue (million) Forecast, by Application 2020 & 2033
- Table 68: North Africa Arak Volume (K) Forecast, by Application 2020 & 2033
- Table 69: South Africa Arak Revenue (million) Forecast, by Application 2020 & 2033
- Table 70: South Africa Arak Volume (K) Forecast, by Application 2020 & 2033
- Table 71: Rest of Middle East & Africa Arak Revenue (million) Forecast, by Application 2020 & 2033
- Table 72: Rest of Middle East & Africa Arak Volume (K) Forecast, by Application 2020 & 2033
- Table 73: Global Arak Revenue million Forecast, by Application 2020 & 2033
- Table 74: Global Arak Volume K Forecast, by Application 2020 & 2033
- Table 75: Global Arak Revenue million Forecast, by Type 2020 & 2033
- Table 76: Global Arak Volume K Forecast, by Type 2020 & 2033
- Table 77: Global Arak Revenue million Forecast, by Country 2020 & 2033
- Table 78: Global Arak Volume K Forecast, by Country 2020 & 2033
- Table 79: China Arak Revenue (million) Forecast, by Application 2020 & 2033
- Table 80: China Arak Volume (K) Forecast, by Application 2020 & 2033
- Table 81: India Arak Revenue (million) Forecast, by Application 2020 & 2033
- Table 82: India Arak Volume (K) Forecast, by Application 2020 & 2033
- Table 83: Japan Arak Revenue (million) Forecast, by Application 2020 & 2033
- Table 84: Japan Arak Volume (K) Forecast, by Application 2020 & 2033
- Table 85: South Korea Arak Revenue (million) Forecast, by Application 2020 & 2033
- Table 86: South Korea Arak Volume (K) Forecast, by Application 2020 & 2033
- Table 87: ASEAN Arak Revenue (million) Forecast, by Application 2020 & 2033
- Table 88: ASEAN Arak Volume (K) Forecast, by Application 2020 & 2033
- Table 89: Oceania Arak Revenue (million) Forecast, by Application 2020 & 2033
- Table 90: Oceania Arak Volume (K) Forecast, by Application 2020 & 2033
- Table 91: Rest of Asia Pacific Arak Revenue (million) Forecast, by Application 2020 & 2033
- Table 92: Rest of Asia Pacific Arak Volume (K) Forecast, by Application 2020 & 2033
Frequently Asked Questions
1. What is the projected Compound Annual Growth Rate (CAGR) of the Arak?
The projected CAGR is approximately 2%.
2. Which companies are prominent players in the Arak?
Key companies in the market include Lebanese Arak Corporation, Abi Raad Group Sarl, Kawar Arak, Eagle Distilleries, Haddad Distilleries, Château Ksara, Lebanese Fine Wines, Domaine des Tourelles.
3. What are the main segments of the Arak?
The market segments include Application, Type.
4. Can you provide details about the market size?
The market size is estimated to be USD 17350 million as of 2022.
5. What are some drivers contributing to market growth?
N/A
6. What are the notable trends driving market growth?
N/A
7. Are there any restraints impacting market growth?
N/A
8. Can you provide examples of recent developments in the market?
N/A
9. What pricing options are available for accessing the report?
Pricing options include single-user, multi-user, and enterprise licenses priced at USD 3950.00, USD 5925.00, and USD 7900.00 respectively.
10. Is the market size provided in terms of value or volume?
The market size is provided in terms of value, measured in million and volume, measured in K.
11. Are there any specific market keywords associated with the report?
Yes, the market keyword associated with the report is "Arak," which aids in identifying and referencing the specific market segment covered.
12. How do I determine which pricing option suits my needs best?
The pricing options vary based on user requirements and access needs. Individual users may opt for single-user licenses, while businesses requiring broader access may choose multi-user or enterprise licenses for cost-effective access to the report.
13. Are there any additional resources or data provided in the Arak report?
While the report offers comprehensive insights, it's advisable to review the specific contents or supplementary materials provided to ascertain if additional resources or data are available.
14. How can I stay updated on further developments or reports in the Arak?
To stay informed about further developments, trends, and reports in the Arak, consider subscribing to industry newsletters, following relevant companies and organizations, or regularly checking reputable industry news sources and publications.
Methodology
Step 1 - Identification of Relevant Samples Size from Population Database


Step 2 - Approaches for Defining Global Market Size (Value, Volume* & Price*)

Note*: In applicable scenarios
Step 3 - Data Sources
Primary Research
- Web Analytics
- Survey Reports
- Research Institute
- Latest Research Reports
- Opinion Leaders
Secondary Research
- Annual Reports
- White Paper
- Latest Press Release
- Industry Association
- Paid Database
- Investor Presentations

Step 4 - Data Triangulation
Involves using different sources of information in order to increase the validity of a study
These sources are likely to be stakeholders in a program - participants, other researchers, program staff, other community members, and so on.
Then we put all data in single framework & apply various statistical tools to find out the dynamic on the market.
During the analysis stage, feedback from the stakeholder groups would be compared to determine areas of agreement as well as areas of divergence