

Key Insights
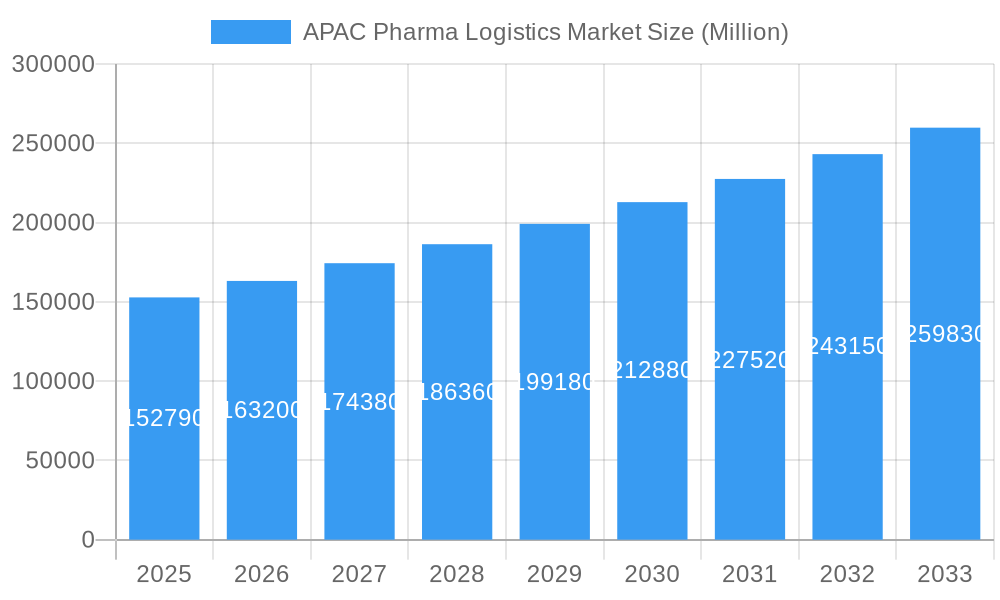
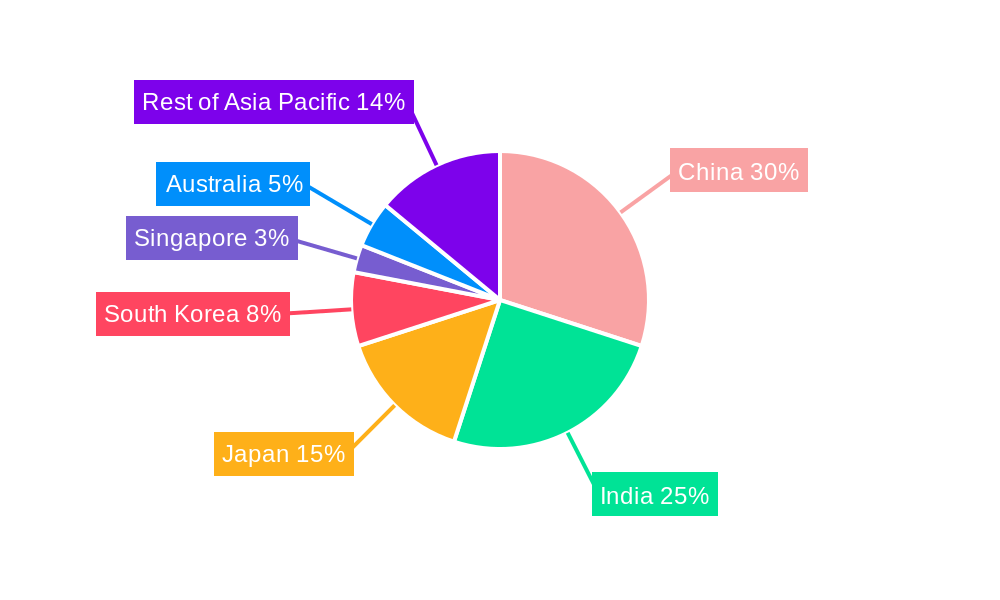
The Asia-Pacific (APAC) pharma logistics market, valued at $152.79 billion in 2025, is projected to experience robust growth, driven by a compound annual growth rate (CAGR) of 6.68% from 2025 to 2033. This expansion is fueled by several key factors. The region's burgeoning pharmaceutical industry, coupled with increasing demand for temperature-sensitive biologics and specialized pharmaceuticals, necessitates sophisticated cold chain and logistics solutions. Growth in e-commerce and direct-to-patient drug delivery models further fuels market expansion. Government initiatives promoting healthcare infrastructure and stringent regulations regarding drug storage and transportation are also contributing positively. The market is segmented by product (generic and branded drugs), mode of operation (cold chain and non-cold chain), application (biopharma, chemical pharma, and specialized pharma), and mode of transport (air, rail, road, and sea). China, India, and Japan are expected to be the largest contributors to market growth due to their substantial pharmaceutical production and consumption. However, challenges such as infrastructure limitations in certain regions and fluctuating fuel prices remain potential restraints. The competitive landscape is dominated by global players like DHL, FedEx, and UPS, alongside regional specialists catering to the unique needs of the APAC market. The increasing adoption of technology, including advanced tracking systems and data analytics, is transforming the sector, enhancing efficiency and ensuring drug integrity.
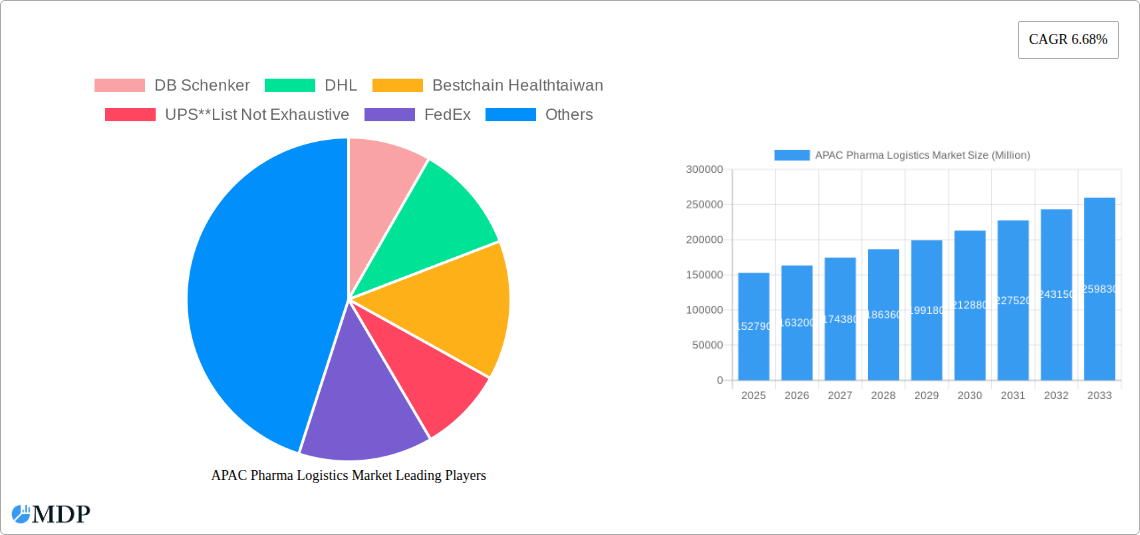
APAC Pharma Logistics Market Market Size (In Billion)
The forecast period (2025-2033) anticipates significant market expansion, with higher growth projected in the initial years due to accelerated infrastructure development and increased investment in pharmaceutical manufacturing and distribution across the region. Specific growth within segments like cold chain transport for biologics will likely outpace other segments due to the growing demand for temperature-sensitive medications. Furthermore, strategic partnerships and mergers and acquisitions are expected to shape the competitive landscape, driving consolidation and technological advancements within the APAC pharma logistics market. This growth will be further spurred by increased investments in research and development leading to newer drugs and therapies requiring specialized handling and transportation. The market will see continued diversification of logistics solutions to meet the unique demands of individual countries and the varying needs of different pharmaceutical products.
APAC Pharma Logistics Market Company Market Share
APAC Pharma Logistics Market: A Comprehensive Report (2019-2033)
This comprehensive report provides an in-depth analysis of the Asia-Pacific Pharma Logistics Market, offering invaluable insights for industry stakeholders, investors, and strategic decision-makers. Covering the period from 2019 to 2033, with a focus on 2025, this report meticulously examines market dynamics, trends, leading players, and future growth potential. The market is projected to reach xx Million by 2033, exhibiting a CAGR of xx% during the forecast period (2025-2033).
APAC Pharma Logistics Market Market Dynamics & Concentration
The APAC Pharma Logistics market is characterized by a dynamic and evolving landscape, transitioning from a moderately concentrated structure to one with increasing strategic importance. While global giants like DHL, DB Schenker, and FedEx continue to command significant market share through their extensive networks and robust capabilities, the region also offers fertile ground for agile, specialized logistics providers targeting niche segments. Market concentration is increasingly shaped by a confluence of factors, including substantial investments in advanced technological infrastructure, the imperative for stringent regulatory adherence across diverse national frameworks, and the pursuit of operational efficiencies through economies of scale.
Innovation Drivers: The relentless pursuit of innovation is primarily propelled by advancements in cold chain integrity, leveraging sophisticated technologies such as IoT-enabled sensors for real-time temperature monitoring, advanced analytics for predictive insights into supply chain performance, and automation to streamline warehousing and distribution processes. The burgeoning demand for highly sensitive biologics and temperature-critical pharmaceuticals is a major impetus for the adoption of these cutting-edge tracking and monitoring systems, ensuring product efficacy and patient safety.
Regulatory Frameworks: Navigating the complex and often disparate regulatory environments across APAC nations remains a critical challenge and a significant determinant of market dynamics. Stringent guidelines governing the storage, transportation, and handling of pharmaceutical products necessitate substantial compliance investments. While these regulations ensure the integrity of the supply chain, they also present considerable hurdles, particularly for smaller or emerging players. The ongoing harmonization efforts and the emergence of regional regulatory bodies are expected to gradually streamline these complexities.
Product Substitutes: While direct substitutes for specialized pharmaceutical logistics are limited, particularly for temperature-sensitive products, alternative logistics solutions catering to non-temperature-controlled pharmaceuticals can exert indirect competitive pressure. The industry's focus on optimizing cost-effectiveness and reliability drives continuous evaluation of all logistical approaches, encouraging innovation in service offerings and pricing strategies.
End-User Trends: The robust growth of the APAC pharma logistics market is intrinsically linked to escalating healthcare expenditure, an aging population, and the increasing prevalence of chronic diseases. This fuels a growing demand for specialized pharmaceuticals, biologics, and personalized medicine. Furthermore, the exponential rise of e-pharmacies and telehealth services is creating entirely new distribution channels and demanding agile, direct-to-consumer logistics solutions.
M&A Activities: Mergers and acquisitions (M&A) are playing a pivotal role in shaping the market's competitive structure. The APAC pharma logistics sector has witnessed a consistent trend of consolidation, with an estimated average of [Insert specific, updated number here, e.g., 8-10] M&A deals annually between 2021 and 2026. Larger, well-established players are strategically acquiring smaller, specialized companies to expand their geographical reach, enhance their service portfolios, and gain access to innovative technologies or market segments. While the market remains relatively fragmented in certain sub-regions, this consolidation trend is projected to accelerate, leading to a more concentrated landscape in the coming years.
APAC Pharma Logistics Market Industry Trends & Analysis
The APAC pharma logistics market is experiencing robust growth, driven by several key factors. The rising prevalence of chronic diseases, an aging population, and increasing healthcare spending are significant drivers. Technological advancements in cold chain technologies, particularly in temperature-controlled containers and monitoring systems, are revolutionizing the industry, enabling the safe and efficient transport of temperature-sensitive pharmaceuticals. This is leading to increased market penetration of cold chain logistics solutions. The market exhibits a robust growth rate, with a projected CAGR of xx% during the forecast period (2025-2033). This growth is being driven by increasing demand for specialized pharmaceuticals, expansion of healthcare infrastructure, and regulatory changes promoting efficient drug supply chains. Competitive dynamics are characterized by both fierce competition among established global players and the emergence of regional logistics providers specializing in specific segments and geographical areas. Consumer preferences are shifting towards reliable, secure, and technologically advanced logistics solutions with real-time tracking and monitoring capabilities.
Leading Markets & Segments in APAC Pharma Logistics Market
The Cold Chain Transport segment dominates the APAC Pharma Logistics market, driven by the increasing demand for temperature-sensitive pharmaceutical products, especially biologics. China and India are the leading markets, accounting for xx% of the total market value in 2025.
Dominant Segments:
- By Product: Branded drugs represent a larger segment than generic drugs due to higher value and stringent handling requirements.
- By Mode of Operation: Cold chain transport holds the largest share, reflecting the growing need for temperature-sensitive drug delivery.
- By Application: Biopharmaceuticals and specialized pharmaceuticals are driving high growth, due to increased research and development.
- By Mode of Transport: Air freight is preferred for time-sensitive and high-value shipments, while road transport holds a larger market share due to cost-effectiveness for shorter distances.
Key Drivers by Region/Segment:
- China: Rapid economic growth, expanding healthcare infrastructure, and increasing investments in cold chain logistics.
- India: Growing pharmaceutical manufacturing base, increasing domestic demand, and government initiatives to improve healthcare access.
- Japan: High demand for advanced pharmaceuticals and stringent regulatory compliance standards driving adoption of cutting-edge technologies.
- Southeast Asia: Rapid economic expansion and rising healthcare expenditure creating significant growth opportunities.
APAC Pharma Logistics Market Product Developments
Recent product and service developments in the APAC Pharma Logistics market are sharply focused on elevating temperature control precision, enhancing real-time monitoring capabilities, and leveraging advanced data analytics for greater supply chain visibility and optimization. Innovations include the widespread integration of state-of-the-art IoT sensors, advanced telemetry devices capable of capturing granular environmental data, and the application of artificial intelligence (AI) and machine learning (ML) algorithms to predict potential disruptions, optimize routes, and proactively manage inventory. These technological advancements are instrumental in providing a competitive edge by significantly improving product traceability, minimizing spoilage and waste, and bolstering the overall resilience of the pharmaceutical supply chain. A growing emphasis on sustainability is also driving the adoption of eco-friendly logistics solutions, with a pronounced focus on reducing carbon footprints through optimized transport modes, green packaging, and energy-efficient warehousing.
Key Drivers of APAC Pharma Logistics Market Growth
The APAC Pharma Logistics market is propelled by several factors:
- Increasing Healthcare Expenditure: Rising disposable incomes and government initiatives to improve healthcare access are boosting demand for pharmaceuticals.
- Technological Advancements: Innovations in cold chain technology, automation, and data analytics are improving efficiency and reliability.
- Stringent Regulatory Compliance: Governments are strengthening regulations to ensure drug safety and quality, creating a demand for specialized logistics services.
- Growth of E-Pharmacies: The rise of online pharmacies is driving demand for efficient last-mile delivery solutions.
Challenges in the APAP Pharma Logistics Market Market
Significant challenges include:
- Infrastructure Gaps: Limited cold chain infrastructure in certain regions hinders efficient drug distribution.
- Regulatory Hurdles: Compliance with stringent regulations across diverse markets adds complexity and cost.
- Supply Chain Disruptions: Global events, such as pandemics, can severely impact the supply chain, causing delays and shortages.
- Intense Competition: The market is highly competitive, with both global and regional players vying for market share. These challenges collectively impact the market by limiting growth potential and increasing operational costs. For instance, infrastructure gaps might lead to xx Million in annual revenue losses.
Emerging Opportunities in APAC Pharma Logistics Market
The APAC Pharma Logistics market presents a wealth of burgeoning opportunities for growth and innovation. Strategic collaborations between leading logistics providers and pharmaceutical manufacturers are proving instrumental in harnessing technological breakthroughs to enhance cold chain efficiency and expand service offerings. Significant potential lies in the untapped markets within the region, where demand for reliable pharmaceutical logistics is steadily increasing. The advanced integration of AI and ML algorithms offers transformative possibilities for predictive maintenance of logistics infrastructure and dynamic route optimization, thereby bolstering supply chain resilience and operational efficiency. Furthermore, the escalating global and regional focus on environmental responsibility is creating substantial avenues for logistics companies that can offer demonstrably sustainable and environmentally conscious solutions, aligning with the corporate social responsibility goals of pharmaceutical clients.
Leading Players in the APAC Pharma Logistics Market Sector
- DB Schenker
- DHL
- Bestchain Healthtaiwan
- UPS
- FedEx
- CEVA Logistics
- Genco
- Kuehne + Nagel
- Mainfreight Ltd
- Bio Pharma Logistics
- Kerry Logistics
- Thermotraffic
- DSV Panalpina
- Arich Enterprise Co Ltd
Key Milestones in APAC Pharma Logistics Market Industry
- December 2022: DHL Supply Chain announced a significant investment of EUR 10 million (approximately USD 10,515,247.11) towards expanding its operational capacity in Northern Taiwan. This strategic move underscores the escalating demand for specialized logistics services tailored to the Life Sciences, Healthcare, and Semiconductor (LSHC) sectors, reflecting the region's growing importance as a hub for these industries.
- August 2022: Nippon Express strategically launched a dedicated Healthcare Branch in Shanghai, China. This initiative signifies a strong commitment to bolstering its presence within the critically important Chinese pharmaceutical market and capitalizing on the burgeoning opportunities for advanced pharmaceutical logistics solutions in this dynamic region.
Strategic Outlook for APAC Pharma Logistics Market Market
The APAC Pharma Logistics market presents significant growth potential. Strategic partnerships, technological innovations, and expansion into underserved markets will drive future growth. Focusing on specialized services, particularly in the cold chain logistics and biopharma sectors, offers attractive opportunities for market players. Companies that successfully adapt to evolving regulatory landscapes, adopt sustainable practices, and leverage technological advancements will be best positioned for long-term success.
APAC Pharma Logistics Market Segmentation
-
1. Product
- 1.1. Generic Drugs
- 1.2. Branded Drugs
-
2. Mode of Operation
- 2.1. Cold Chain Transport
- 2.2. Non-Cold Chain Transport
-
3. Application
- 3.1. Bio Pharma
- 3.2. Chemical Pharma
- 3.3. Specialized Pharma
-
4. Mode of Transport
- 4.1. Air
- 4.2. Rail
- 4.3. Road
- 4.4. Sea
-
5. Geography
- 5.1. China
- 5.2. India
- 5.3. Japan
- 5.4. South Korea
- 5.5. Singapore
- 5.6. Australia
- 5.7. Rest of Asia Pacific
APAC Pharma Logistics Market Segmentation By Geography
- 1. China
- 2. India
- 3. Japan
- 4. South Korea
- 5. Singapore
- 6. Australia
- 7. Rest of Asia Pacific
APAC Pharma Logistics Market Regional Market Share
Geographic Coverage of APAC Pharma Logistics Market
APAC Pharma Logistics Market REPORT HIGHLIGHTS
| Aspects | Details |
|---|---|
| Study Period | 2020-2034 |
| Base Year | 2025 |
| Estimated Year | 2026 |
| Forecast Period | 2026-2034 |
| Historical Period | 2020-2025 |
| Growth Rate | CAGR of 6.68% from 2020-2034 |
| Segmentation |
|
Table of Contents
- 1. Introduction
- 1.1. Research Scope
- 1.2. Market Segmentation
- 1.3. Research Objective
- 1.4. Definitions and Assumptions
- 2. Executive Summary
- 2.1. Market Snapshot
- 3. Market Dynamics
- 3.1. Market Drivers
- 3.2. Market Restrains
- 3.3. Market Trends
- 3.4. Market Opportunities
- 4. Market Factor Analysis
- 4.1. Porters Five Forces
- 4.1.1. Bargaining Power of Suppliers
- 4.1.2. Bargaining Power of Buyers
- 4.1.3. Threat of New Entrants
- 4.1.4. Threat of Substitutes
- 4.1.5. Competitive Rivalry
- 4.2. PESTEL analysis
- 4.3. BCG Analysis
- 4.3.1. Stars (High Growth, High Market Share)
- 4.3.2. Cash Cows (Low Growth, High Market Share)
- 4.3.3. Question Mark (High Growth, Low Market Share)
- 4.3.4. Dogs (Low Growth, Low Market Share)
- 4.4. Ansoff Matrix Analysis
- 4.5. Supply Chain Analysis
- 4.6. Regulatory Landscape
- 4.7. Current Market Potential and Opportunity Assessment (TAM–SAM–SOM Framework)
- 4.8. MDP Analyst Note
- 4.1. Porters Five Forces
- 5. Market Analysis, Insights and Forecast 2021-2033
- 5.1. Market Analysis, Insights and Forecast - by Product
- 5.1.1. Generic Drugs
- 5.1.2. Branded Drugs
- 5.2. Market Analysis, Insights and Forecast - by Mode of Operation
- 5.2.1. Cold Chain Transport
- 5.2.2. Non-Cold Chain Transport
- 5.3. Market Analysis, Insights and Forecast - by Application
- 5.3.1. Bio Pharma
- 5.3.2. Chemical Pharma
- 5.3.3. Specialized Pharma
- 5.4. Market Analysis, Insights and Forecast - by Mode of Transport
- 5.4.1. Air
- 5.4.2. Rail
- 5.4.3. Road
- 5.4.4. Sea
- 5.5. Market Analysis, Insights and Forecast - by Geography
- 5.5.1. China
- 5.5.2. India
- 5.5.3. Japan
- 5.5.4. South Korea
- 5.5.5. Singapore
- 5.5.6. Australia
- 5.5.7. Rest of Asia Pacific
- 5.6. Market Analysis, Insights and Forecast - by Region
- 5.6.1. China
- 5.6.2. India
- 5.6.3. Japan
- 5.6.4. South Korea
- 5.6.5. Singapore
- 5.6.6. Australia
- 5.6.7. Rest of Asia Pacific
- 5.1. Market Analysis, Insights and Forecast - by Product
- 6. Global APAC Pharma Logistics Market Analysis, Insights and Forecast, 2021-2033
- 6.1. Market Analysis, Insights and Forecast - by Product
- 6.1.1. Generic Drugs
- 6.1.2. Branded Drugs
- 6.2. Market Analysis, Insights and Forecast - by Mode of Operation
- 6.2.1. Cold Chain Transport
- 6.2.2. Non-Cold Chain Transport
- 6.3. Market Analysis, Insights and Forecast - by Application
- 6.3.1. Bio Pharma
- 6.3.2. Chemical Pharma
- 6.3.3. Specialized Pharma
- 6.4. Market Analysis, Insights and Forecast - by Mode of Transport
- 6.4.1. Air
- 6.4.2. Rail
- 6.4.3. Road
- 6.4.4. Sea
- 6.5. Market Analysis, Insights and Forecast - by Geography
- 6.5.1. China
- 6.5.2. India
- 6.5.3. Japan
- 6.5.4. South Korea
- 6.5.5. Singapore
- 6.5.6. Australia
- 6.5.7. Rest of Asia Pacific
- 6.1. Market Analysis, Insights and Forecast - by Product
- 7. China APAC Pharma Logistics Market Analysis, Insights and Forecast, 2020-2032
- 7.1. Market Analysis, Insights and Forecast - by Product
- 7.1.1. Generic Drugs
- 7.1.2. Branded Drugs
- 7.2. Market Analysis, Insights and Forecast - by Mode of Operation
- 7.2.1. Cold Chain Transport
- 7.2.2. Non-Cold Chain Transport
- 7.3. Market Analysis, Insights and Forecast - by Application
- 7.3.1. Bio Pharma
- 7.3.2. Chemical Pharma
- 7.3.3. Specialized Pharma
- 7.4. Market Analysis, Insights and Forecast - by Mode of Transport
- 7.4.1. Air
- 7.4.2. Rail
- 7.4.3. Road
- 7.4.4. Sea
- 7.5. Market Analysis, Insights and Forecast - by Geography
- 7.5.1. China
- 7.5.2. India
- 7.5.3. Japan
- 7.5.4. South Korea
- 7.5.5. Singapore
- 7.5.6. Australia
- 7.5.7. Rest of Asia Pacific
- 7.1. Market Analysis, Insights and Forecast - by Product
- 8. India APAC Pharma Logistics Market Analysis, Insights and Forecast, 2020-2032
- 8.1. Market Analysis, Insights and Forecast - by Product
- 8.1.1. Generic Drugs
- 8.1.2. Branded Drugs
- 8.2. Market Analysis, Insights and Forecast - by Mode of Operation
- 8.2.1. Cold Chain Transport
- 8.2.2. Non-Cold Chain Transport
- 8.3. Market Analysis, Insights and Forecast - by Application
- 8.3.1. Bio Pharma
- 8.3.2. Chemical Pharma
- 8.3.3. Specialized Pharma
- 8.4. Market Analysis, Insights and Forecast - by Mode of Transport
- 8.4.1. Air
- 8.4.2. Rail
- 8.4.3. Road
- 8.4.4. Sea
- 8.5. Market Analysis, Insights and Forecast - by Geography
- 8.5.1. China
- 8.5.2. India
- 8.5.3. Japan
- 8.5.4. South Korea
- 8.5.5. Singapore
- 8.5.6. Australia
- 8.5.7. Rest of Asia Pacific
- 8.1. Market Analysis, Insights and Forecast - by Product
- 9. Japan APAC Pharma Logistics Market Analysis, Insights and Forecast, 2020-2032
- 9.1. Market Analysis, Insights and Forecast - by Product
- 9.1.1. Generic Drugs
- 9.1.2. Branded Drugs
- 9.2. Market Analysis, Insights and Forecast - by Mode of Operation
- 9.2.1. Cold Chain Transport
- 9.2.2. Non-Cold Chain Transport
- 9.3. Market Analysis, Insights and Forecast - by Application
- 9.3.1. Bio Pharma
- 9.3.2. Chemical Pharma
- 9.3.3. Specialized Pharma
- 9.4. Market Analysis, Insights and Forecast - by Mode of Transport
- 9.4.1. Air
- 9.4.2. Rail
- 9.4.3. Road
- 9.4.4. Sea
- 9.5. Market Analysis, Insights and Forecast - by Geography
- 9.5.1. China
- 9.5.2. India
- 9.5.3. Japan
- 9.5.4. South Korea
- 9.5.5. Singapore
- 9.5.6. Australia
- 9.5.7. Rest of Asia Pacific
- 9.1. Market Analysis, Insights and Forecast - by Product
- 10. South Korea APAC Pharma Logistics Market Analysis, Insights and Forecast, 2020-2032
- 10.1. Market Analysis, Insights and Forecast - by Product
- 10.1.1. Generic Drugs
- 10.1.2. Branded Drugs
- 10.2. Market Analysis, Insights and Forecast - by Mode of Operation
- 10.2.1. Cold Chain Transport
- 10.2.2. Non-Cold Chain Transport
- 10.3. Market Analysis, Insights and Forecast - by Application
- 10.3.1. Bio Pharma
- 10.3.2. Chemical Pharma
- 10.3.3. Specialized Pharma
- 10.4. Market Analysis, Insights and Forecast - by Mode of Transport
- 10.4.1. Air
- 10.4.2. Rail
- 10.4.3. Road
- 10.4.4. Sea
- 10.5. Market Analysis, Insights and Forecast - by Geography
- 10.5.1. China
- 10.5.2. India
- 10.5.3. Japan
- 10.5.4. South Korea
- 10.5.5. Singapore
- 10.5.6. Australia
- 10.5.7. Rest of Asia Pacific
- 10.1. Market Analysis, Insights and Forecast - by Product
- 11. Singapore APAC Pharma Logistics Market Analysis, Insights and Forecast, 2020-2032
- 11.1. Market Analysis, Insights and Forecast - by Product
- 11.1.1. Generic Drugs
- 11.1.2. Branded Drugs
- 11.2. Market Analysis, Insights and Forecast - by Mode of Operation
- 11.2.1. Cold Chain Transport
- 11.2.2. Non-Cold Chain Transport
- 11.3. Market Analysis, Insights and Forecast - by Application
- 11.3.1. Bio Pharma
- 11.3.2. Chemical Pharma
- 11.3.3. Specialized Pharma
- 11.4. Market Analysis, Insights and Forecast - by Mode of Transport
- 11.4.1. Air
- 11.4.2. Rail
- 11.4.3. Road
- 11.4.4. Sea
- 11.5. Market Analysis, Insights and Forecast - by Geography
- 11.5.1. China
- 11.5.2. India
- 11.5.3. Japan
- 11.5.4. South Korea
- 11.5.5. Singapore
- 11.5.6. Australia
- 11.5.7. Rest of Asia Pacific
- 11.1. Market Analysis, Insights and Forecast - by Product
- 12. Australia APAC Pharma Logistics Market Analysis, Insights and Forecast, 2020-2032
- 12.1. Market Analysis, Insights and Forecast - by Product
- 12.1.1. Generic Drugs
- 12.1.2. Branded Drugs
- 12.2. Market Analysis, Insights and Forecast - by Mode of Operation
- 12.2.1. Cold Chain Transport
- 12.2.2. Non-Cold Chain Transport
- 12.3. Market Analysis, Insights and Forecast - by Application
- 12.3.1. Bio Pharma
- 12.3.2. Chemical Pharma
- 12.3.3. Specialized Pharma
- 12.4. Market Analysis, Insights and Forecast - by Mode of Transport
- 12.4.1. Air
- 12.4.2. Rail
- 12.4.3. Road
- 12.4.4. Sea
- 12.5. Market Analysis, Insights and Forecast - by Geography
- 12.5.1. China
- 12.5.2. India
- 12.5.3. Japan
- 12.5.4. South Korea
- 12.5.5. Singapore
- 12.5.6. Australia
- 12.5.7. Rest of Asia Pacific
- 12.1. Market Analysis, Insights and Forecast - by Product
- 13. Rest of Asia Pacific APAC Pharma Logistics Market Analysis, Insights and Forecast, 2020-2032
- 13.1. Market Analysis, Insights and Forecast - by Product
- 13.1.1. Generic Drugs
- 13.1.2. Branded Drugs
- 13.2. Market Analysis, Insights and Forecast - by Mode of Operation
- 13.2.1. Cold Chain Transport
- 13.2.2. Non-Cold Chain Transport
- 13.3. Market Analysis, Insights and Forecast - by Application
- 13.3.1. Bio Pharma
- 13.3.2. Chemical Pharma
- 13.3.3. Specialized Pharma
- 13.4. Market Analysis, Insights and Forecast - by Mode of Transport
- 13.4.1. Air
- 13.4.2. Rail
- 13.4.3. Road
- 13.4.4. Sea
- 13.5. Market Analysis, Insights and Forecast - by Geography
- 13.5.1. China
- 13.5.2. India
- 13.5.3. Japan
- 13.5.4. South Korea
- 13.5.5. Singapore
- 13.5.6. Australia
- 13.5.7. Rest of Asia Pacific
- 13.1. Market Analysis, Insights and Forecast - by Product
- 14. Competitive Analysis
- 14.1. Company Profiles
- 14.1.1 DB Schenker
- 14.1.1.1. Company Overview
- 14.1.1.2. Products
- 14.1.1.3. Company Financials
- 14.1.1.4. SWOT Analysis
- 14.1.2 DHL
- 14.1.2.1. Company Overview
- 14.1.2.2. Products
- 14.1.2.3. Company Financials
- 14.1.2.4. SWOT Analysis
- 14.1.3 Bestchain Healthtaiwan
- 14.1.3.1. Company Overview
- 14.1.3.2. Products
- 14.1.3.3. Company Financials
- 14.1.3.4. SWOT Analysis
- 14.1.4 UPS**List Not Exhaustive
- 14.1.4.1. Company Overview
- 14.1.4.2. Products
- 14.1.4.3. Company Financials
- 14.1.4.4. SWOT Analysis
- 14.1.5 FedEx
- 14.1.5.1. Company Overview
- 14.1.5.2. Products
- 14.1.5.3. Company Financials
- 14.1.5.4. SWOT Analysis
- 14.1.6 CEVA Logistics
- 14.1.6.1. Company Overview
- 14.1.6.2. Products
- 14.1.6.3. Company Financials
- 14.1.6.4. SWOT Analysis
- 14.1.7 Genco
- 14.1.7.1. Company Overview
- 14.1.7.2. Products
- 14.1.7.3. Company Financials
- 14.1.7.4. SWOT Analysis
- 14.1.8 Kuehne + Nagel
- 14.1.8.1. Company Overview
- 14.1.8.2. Products
- 14.1.8.3. Company Financials
- 14.1.8.4. SWOT Analysis
- 14.1.9 Mainfreight Ltd
- 14.1.9.1. Company Overview
- 14.1.9.2. Products
- 14.1.9.3. Company Financials
- 14.1.9.4. SWOT Analysis
- 14.1.10 Bio Pharma Logistics
- 14.1.10.1. Company Overview
- 14.1.10.2. Products
- 14.1.10.3. Company Financials
- 14.1.10.4. SWOT Analysis
- 14.1.11 Kerry Logistics
- 14.1.11.1. Company Overview
- 14.1.11.2. Products
- 14.1.11.3. Company Financials
- 14.1.11.4. SWOT Analysis
- 14.1.12 Thermotraffic
- 14.1.12.1. Company Overview
- 14.1.12.2. Products
- 14.1.12.3. Company Financials
- 14.1.12.4. SWOT Analysis
- 14.1.13 DSV Panalpina
- 14.1.13.1. Company Overview
- 14.1.13.2. Products
- 14.1.13.3. Company Financials
- 14.1.13.4. SWOT Analysis
- 14.1.14 Arich Enterprise Co Ltd
- 14.1.14.1. Company Overview
- 14.1.14.2. Products
- 14.1.14.3. Company Financials
- 14.1.14.4. SWOT Analysis
- 14.1.1 DB Schenker
- 14.2. Market Entropy
- 14.2.1 Company's Key Areas Served
- 14.2.2 Recent Developments
- 14.3. Company Market Share Analysis 2025
- 14.3.1 Top 5 Companies Market Share Analysis
- 14.3.2 Top 3 Companies Market Share Analysis
- 14.4. List of Potential Customers
- 15. Research Methodology
List of Figures
- Figure 1: Global APAC Pharma Logistics Market Revenue Breakdown (Million, %) by Region 2025 & 2033
- Figure 2: China APAC Pharma Logistics Market Revenue (Million), by Product 2025 & 2033
- Figure 3: China APAC Pharma Logistics Market Revenue Share (%), by Product 2025 & 2033
- Figure 4: China APAC Pharma Logistics Market Revenue (Million), by Mode of Operation 2025 & 2033
- Figure 5: China APAC Pharma Logistics Market Revenue Share (%), by Mode of Operation 2025 & 2033
- Figure 6: China APAC Pharma Logistics Market Revenue (Million), by Application 2025 & 2033
- Figure 7: China APAC Pharma Logistics Market Revenue Share (%), by Application 2025 & 2033
- Figure 8: China APAC Pharma Logistics Market Revenue (Million), by Mode of Transport 2025 & 2033
- Figure 9: China APAC Pharma Logistics Market Revenue Share (%), by Mode of Transport 2025 & 2033
- Figure 10: China APAC Pharma Logistics Market Revenue (Million), by Geography 2025 & 2033
- Figure 11: China APAC Pharma Logistics Market Revenue Share (%), by Geography 2025 & 2033
- Figure 12: China APAC Pharma Logistics Market Revenue (Million), by Country 2025 & 2033
- Figure 13: China APAC Pharma Logistics Market Revenue Share (%), by Country 2025 & 2033
- Figure 14: India APAC Pharma Logistics Market Revenue (Million), by Product 2025 & 2033
- Figure 15: India APAC Pharma Logistics Market Revenue Share (%), by Product 2025 & 2033
- Figure 16: India APAC Pharma Logistics Market Revenue (Million), by Mode of Operation 2025 & 2033
- Figure 17: India APAC Pharma Logistics Market Revenue Share (%), by Mode of Operation 2025 & 2033
- Figure 18: India APAC Pharma Logistics Market Revenue (Million), by Application 2025 & 2033
- Figure 19: India APAC Pharma Logistics Market Revenue Share (%), by Application 2025 & 2033
- Figure 20: India APAC Pharma Logistics Market Revenue (Million), by Mode of Transport 2025 & 2033
- Figure 21: India APAC Pharma Logistics Market Revenue Share (%), by Mode of Transport 2025 & 2033
- Figure 22: India APAC Pharma Logistics Market Revenue (Million), by Geography 2025 & 2033
- Figure 23: India APAC Pharma Logistics Market Revenue Share (%), by Geography 2025 & 2033
- Figure 24: India APAC Pharma Logistics Market Revenue (Million), by Country 2025 & 2033
- Figure 25: India APAC Pharma Logistics Market Revenue Share (%), by Country 2025 & 2033
- Figure 26: Japan APAC Pharma Logistics Market Revenue (Million), by Product 2025 & 2033
- Figure 27: Japan APAC Pharma Logistics Market Revenue Share (%), by Product 2025 & 2033
- Figure 28: Japan APAC Pharma Logistics Market Revenue (Million), by Mode of Operation 2025 & 2033
- Figure 29: Japan APAC Pharma Logistics Market Revenue Share (%), by Mode of Operation 2025 & 2033
- Figure 30: Japan APAC Pharma Logistics Market Revenue (Million), by Application 2025 & 2033
- Figure 31: Japan APAC Pharma Logistics Market Revenue Share (%), by Application 2025 & 2033
- Figure 32: Japan APAC Pharma Logistics Market Revenue (Million), by Mode of Transport 2025 & 2033
- Figure 33: Japan APAC Pharma Logistics Market Revenue Share (%), by Mode of Transport 2025 & 2033
- Figure 34: Japan APAC Pharma Logistics Market Revenue (Million), by Geography 2025 & 2033
- Figure 35: Japan APAC Pharma Logistics Market Revenue Share (%), by Geography 2025 & 2033
- Figure 36: Japan APAC Pharma Logistics Market Revenue (Million), by Country 2025 & 2033
- Figure 37: Japan APAC Pharma Logistics Market Revenue Share (%), by Country 2025 & 2033
- Figure 38: South Korea APAC Pharma Logistics Market Revenue (Million), by Product 2025 & 2033
- Figure 39: South Korea APAC Pharma Logistics Market Revenue Share (%), by Product 2025 & 2033
- Figure 40: South Korea APAC Pharma Logistics Market Revenue (Million), by Mode of Operation 2025 & 2033
- Figure 41: South Korea APAC Pharma Logistics Market Revenue Share (%), by Mode of Operation 2025 & 2033
- Figure 42: South Korea APAC Pharma Logistics Market Revenue (Million), by Application 2025 & 2033
- Figure 43: South Korea APAC Pharma Logistics Market Revenue Share (%), by Application 2025 & 2033
- Figure 44: South Korea APAC Pharma Logistics Market Revenue (Million), by Mode of Transport 2025 & 2033
- Figure 45: South Korea APAC Pharma Logistics Market Revenue Share (%), by Mode of Transport 2025 & 2033
- Figure 46: South Korea APAC Pharma Logistics Market Revenue (Million), by Geography 2025 & 2033
- Figure 47: South Korea APAC Pharma Logistics Market Revenue Share (%), by Geography 2025 & 2033
- Figure 48: South Korea APAC Pharma Logistics Market Revenue (Million), by Country 2025 & 2033
- Figure 49: South Korea APAC Pharma Logistics Market Revenue Share (%), by Country 2025 & 2033
- Figure 50: Singapore APAC Pharma Logistics Market Revenue (Million), by Product 2025 & 2033
- Figure 51: Singapore APAC Pharma Logistics Market Revenue Share (%), by Product 2025 & 2033
- Figure 52: Singapore APAC Pharma Logistics Market Revenue (Million), by Mode of Operation 2025 & 2033
- Figure 53: Singapore APAC Pharma Logistics Market Revenue Share (%), by Mode of Operation 2025 & 2033
- Figure 54: Singapore APAC Pharma Logistics Market Revenue (Million), by Application 2025 & 2033
- Figure 55: Singapore APAC Pharma Logistics Market Revenue Share (%), by Application 2025 & 2033
- Figure 56: Singapore APAC Pharma Logistics Market Revenue (Million), by Mode of Transport 2025 & 2033
- Figure 57: Singapore APAC Pharma Logistics Market Revenue Share (%), by Mode of Transport 2025 & 2033
- Figure 58: Singapore APAC Pharma Logistics Market Revenue (Million), by Geography 2025 & 2033
- Figure 59: Singapore APAC Pharma Logistics Market Revenue Share (%), by Geography 2025 & 2033
- Figure 60: Singapore APAC Pharma Logistics Market Revenue (Million), by Country 2025 & 2033
- Figure 61: Singapore APAC Pharma Logistics Market Revenue Share (%), by Country 2025 & 2033
- Figure 62: Australia APAC Pharma Logistics Market Revenue (Million), by Product 2025 & 2033
- Figure 63: Australia APAC Pharma Logistics Market Revenue Share (%), by Product 2025 & 2033
- Figure 64: Australia APAC Pharma Logistics Market Revenue (Million), by Mode of Operation 2025 & 2033
- Figure 65: Australia APAC Pharma Logistics Market Revenue Share (%), by Mode of Operation 2025 & 2033
- Figure 66: Australia APAC Pharma Logistics Market Revenue (Million), by Application 2025 & 2033
- Figure 67: Australia APAC Pharma Logistics Market Revenue Share (%), by Application 2025 & 2033
- Figure 68: Australia APAC Pharma Logistics Market Revenue (Million), by Mode of Transport 2025 & 2033
- Figure 69: Australia APAC Pharma Logistics Market Revenue Share (%), by Mode of Transport 2025 & 2033
- Figure 70: Australia APAC Pharma Logistics Market Revenue (Million), by Geography 2025 & 2033
- Figure 71: Australia APAC Pharma Logistics Market Revenue Share (%), by Geography 2025 & 2033
- Figure 72: Australia APAC Pharma Logistics Market Revenue (Million), by Country 2025 & 2033
- Figure 73: Australia APAC Pharma Logistics Market Revenue Share (%), by Country 2025 & 2033
- Figure 74: Rest of Asia Pacific APAC Pharma Logistics Market Revenue (Million), by Product 2025 & 2033
- Figure 75: Rest of Asia Pacific APAC Pharma Logistics Market Revenue Share (%), by Product 2025 & 2033
- Figure 76: Rest of Asia Pacific APAC Pharma Logistics Market Revenue (Million), by Mode of Operation 2025 & 2033
- Figure 77: Rest of Asia Pacific APAC Pharma Logistics Market Revenue Share (%), by Mode of Operation 2025 & 2033
- Figure 78: Rest of Asia Pacific APAC Pharma Logistics Market Revenue (Million), by Application 2025 & 2033
- Figure 79: Rest of Asia Pacific APAC Pharma Logistics Market Revenue Share (%), by Application 2025 & 2033
- Figure 80: Rest of Asia Pacific APAC Pharma Logistics Market Revenue (Million), by Mode of Transport 2025 & 2033
- Figure 81: Rest of Asia Pacific APAC Pharma Logistics Market Revenue Share (%), by Mode of Transport 2025 & 2033
- Figure 82: Rest of Asia Pacific APAC Pharma Logistics Market Revenue (Million), by Geography 2025 & 2033
- Figure 83: Rest of Asia Pacific APAC Pharma Logistics Market Revenue Share (%), by Geography 2025 & 2033
- Figure 84: Rest of Asia Pacific APAC Pharma Logistics Market Revenue (Million), by Country 2025 & 2033
- Figure 85: Rest of Asia Pacific APAC Pharma Logistics Market Revenue Share (%), by Country 2025 & 2033
List of Tables
- Table 1: Global APAC Pharma Logistics Market Revenue Million Forecast, by Product 2020 & 2033
- Table 2: Global APAC Pharma Logistics Market Revenue Million Forecast, by Mode of Operation 2020 & 2033
- Table 3: Global APAC Pharma Logistics Market Revenue Million Forecast, by Application 2020 & 2033
- Table 4: Global APAC Pharma Logistics Market Revenue Million Forecast, by Mode of Transport 2020 & 2033
- Table 5: Global APAC Pharma Logistics Market Revenue Million Forecast, by Geography 2020 & 2033
- Table 6: Global APAC Pharma Logistics Market Revenue Million Forecast, by Region 2020 & 2033
- Table 7: Global APAC Pharma Logistics Market Revenue Million Forecast, by Product 2020 & 2033
- Table 8: Global APAC Pharma Logistics Market Revenue Million Forecast, by Mode of Operation 2020 & 2033
- Table 9: Global APAC Pharma Logistics Market Revenue Million Forecast, by Application 2020 & 2033
- Table 10: Global APAC Pharma Logistics Market Revenue Million Forecast, by Mode of Transport 2020 & 2033
- Table 11: Global APAC Pharma Logistics Market Revenue Million Forecast, by Geography 2020 & 2033
- Table 12: Global APAC Pharma Logistics Market Revenue Million Forecast, by Country 2020 & 2033
- Table 13: Global APAC Pharma Logistics Market Revenue Million Forecast, by Product 2020 & 2033
- Table 14: Global APAC Pharma Logistics Market Revenue Million Forecast, by Mode of Operation 2020 & 2033
- Table 15: Global APAC Pharma Logistics Market Revenue Million Forecast, by Application 2020 & 2033
- Table 16: Global APAC Pharma Logistics Market Revenue Million Forecast, by Mode of Transport 2020 & 2033
- Table 17: Global APAC Pharma Logistics Market Revenue Million Forecast, by Geography 2020 & 2033
- Table 18: Global APAC Pharma Logistics Market Revenue Million Forecast, by Country 2020 & 2033
- Table 19: Global APAC Pharma Logistics Market Revenue Million Forecast, by Product 2020 & 2033
- Table 20: Global APAC Pharma Logistics Market Revenue Million Forecast, by Mode of Operation 2020 & 2033
- Table 21: Global APAC Pharma Logistics Market Revenue Million Forecast, by Application 2020 & 2033
- Table 22: Global APAC Pharma Logistics Market Revenue Million Forecast, by Mode of Transport 2020 & 2033
- Table 23: Global APAC Pharma Logistics Market Revenue Million Forecast, by Geography 2020 & 2033
- Table 24: Global APAC Pharma Logistics Market Revenue Million Forecast, by Country 2020 & 2033
- Table 25: Global APAC Pharma Logistics Market Revenue Million Forecast, by Product 2020 & 2033
- Table 26: Global APAC Pharma Logistics Market Revenue Million Forecast, by Mode of Operation 2020 & 2033
- Table 27: Global APAC Pharma Logistics Market Revenue Million Forecast, by Application 2020 & 2033
- Table 28: Global APAC Pharma Logistics Market Revenue Million Forecast, by Mode of Transport 2020 & 2033
- Table 29: Global APAC Pharma Logistics Market Revenue Million Forecast, by Geography 2020 & 2033
- Table 30: Global APAC Pharma Logistics Market Revenue Million Forecast, by Country 2020 & 2033
- Table 31: Global APAC Pharma Logistics Market Revenue Million Forecast, by Product 2020 & 2033
- Table 32: Global APAC Pharma Logistics Market Revenue Million Forecast, by Mode of Operation 2020 & 2033
- Table 33: Global APAC Pharma Logistics Market Revenue Million Forecast, by Application 2020 & 2033
- Table 34: Global APAC Pharma Logistics Market Revenue Million Forecast, by Mode of Transport 2020 & 2033
- Table 35: Global APAC Pharma Logistics Market Revenue Million Forecast, by Geography 2020 & 2033
- Table 36: Global APAC Pharma Logistics Market Revenue Million Forecast, by Country 2020 & 2033
- Table 37: Global APAC Pharma Logistics Market Revenue Million Forecast, by Product 2020 & 2033
- Table 38: Global APAC Pharma Logistics Market Revenue Million Forecast, by Mode of Operation 2020 & 2033
- Table 39: Global APAC Pharma Logistics Market Revenue Million Forecast, by Application 2020 & 2033
- Table 40: Global APAC Pharma Logistics Market Revenue Million Forecast, by Mode of Transport 2020 & 2033
- Table 41: Global APAC Pharma Logistics Market Revenue Million Forecast, by Geography 2020 & 2033
- Table 42: Global APAC Pharma Logistics Market Revenue Million Forecast, by Country 2020 & 2033
- Table 43: Global APAC Pharma Logistics Market Revenue Million Forecast, by Product 2020 & 2033
- Table 44: Global APAC Pharma Logistics Market Revenue Million Forecast, by Mode of Operation 2020 & 2033
- Table 45: Global APAC Pharma Logistics Market Revenue Million Forecast, by Application 2020 & 2033
- Table 46: Global APAC Pharma Logistics Market Revenue Million Forecast, by Mode of Transport 2020 & 2033
- Table 47: Global APAC Pharma Logistics Market Revenue Million Forecast, by Geography 2020 & 2033
- Table 48: Global APAC Pharma Logistics Market Revenue Million Forecast, by Country 2020 & 2033
Frequently Asked Questions
1. What is the projected Compound Annual Growth Rate (CAGR) of the APAC Pharma Logistics Market?
The projected CAGR is approximately 6.68%.
2. Which companies are prominent players in the APAC Pharma Logistics Market?
Key companies in the market include DB Schenker, DHL, Bestchain Healthtaiwan, UPS**List Not Exhaustive, FedEx, CEVA Logistics, Genco, Kuehne + Nagel, Mainfreight Ltd, Bio Pharma Logistics, Kerry Logistics, Thermotraffic, DSV Panalpina, Arich Enterprise Co Ltd.
3. What are the main segments of the APAC Pharma Logistics Market?
The market segments include Product, Mode of Operation, Application, Mode of Transport, Geography.
4. Can you provide details about the market size?
The market size is estimated to be USD 152.79 Million as of 2022.
5. What are some drivers contributing to market growth?
Growing Events in E-commerce Sector; Increasing Demand for Qualified Event Logistics Services.
6. What are the notable trends driving market growth?
Cold chain Logistics is driving the market.
7. Are there any restraints impacting market growth?
High Labour Cost; High Pricing.
8. Can you provide examples of recent developments in the market?
December 2022: DHL Supply Chain has disclosed its Northern Taiwan plant growth plans for five years. The investment of EUR 10 million (USD 10515247.1083) would expand DHL Supply Chain's market reach and meet the logistics needs of the LSHC and semiconductor industries. The newly inaugurated Taoyuan Distribution Center-Jian Guo, DHL Supply Chain's second location in Taoyuan, is a part of the development.
9. What pricing options are available for accessing the report?
Pricing options include single-user, multi-user, and enterprise licenses priced at USD 4750, USD 5250, and USD 8750 respectively.
10. Is the market size provided in terms of value or volume?
The market size is provided in terms of value, measured in Million.
11. Are there any specific market keywords associated with the report?
Yes, the market keyword associated with the report is "APAC Pharma Logistics Market," which aids in identifying and referencing the specific market segment covered.
12. How do I determine which pricing option suits my needs best?
The pricing options vary based on user requirements and access needs. Individual users may opt for single-user licenses, while businesses requiring broader access may choose multi-user or enterprise licenses for cost-effective access to the report.
13. Are there any additional resources or data provided in the APAC Pharma Logistics Market report?
While the report offers comprehensive insights, it's advisable to review the specific contents or supplementary materials provided to ascertain if additional resources or data are available.
14. How can I stay updated on further developments or reports in the APAC Pharma Logistics Market?
To stay informed about further developments, trends, and reports in the APAC Pharma Logistics Market, consider subscribing to industry newsletters, following relevant companies and organizations, or regularly checking reputable industry news sources and publications.
Methodology
Step 1 - Identification of Relevant Samples Size from Population Database


Step 2 - Approaches for Defining Global Market Size (Value, Volume* & Price*)

Note*: In applicable scenarios
Step 3 - Data Sources
Primary Research
- Web Analytics
- Survey Reports
- Research Institute
- Latest Research Reports
- Opinion Leaders
Secondary Research
- Annual Reports
- White Paper
- Latest Press Release
- Industry Association
- Paid Database
- Investor Presentations

Step 4 - Data Triangulation
Involves using different sources of information in order to increase the validity of a study
These sources are likely to be stakeholders in a program - participants, other researchers, program staff, other community members, and so on.
Then we put all data in single framework & apply various statistical tools to find out the dynamic on the market.
During the analysis stage, feedback from the stakeholder groups would be compared to determine areas of agreement as well as areas of divergence