

Key Insights
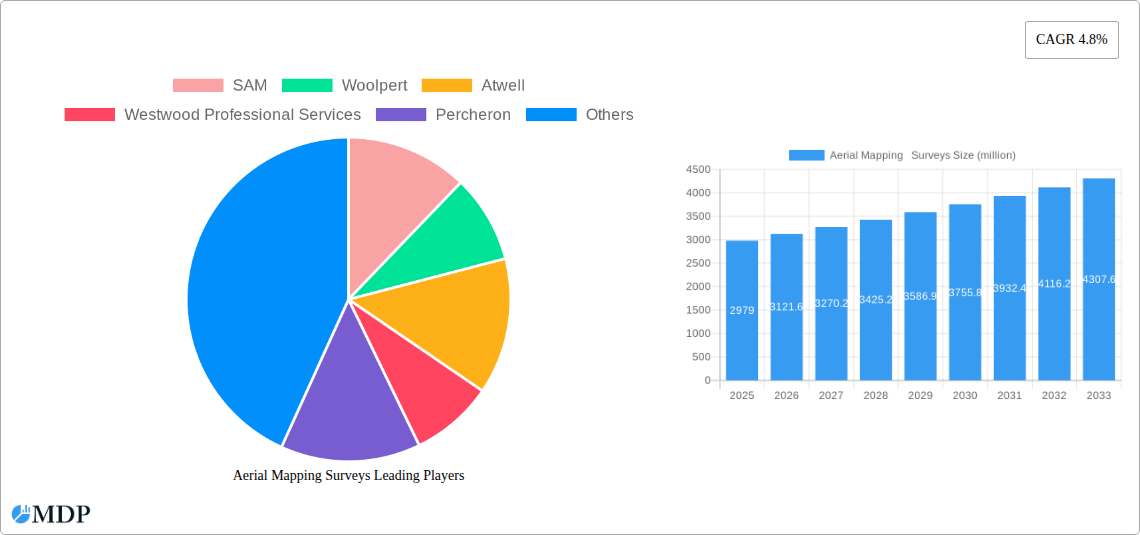
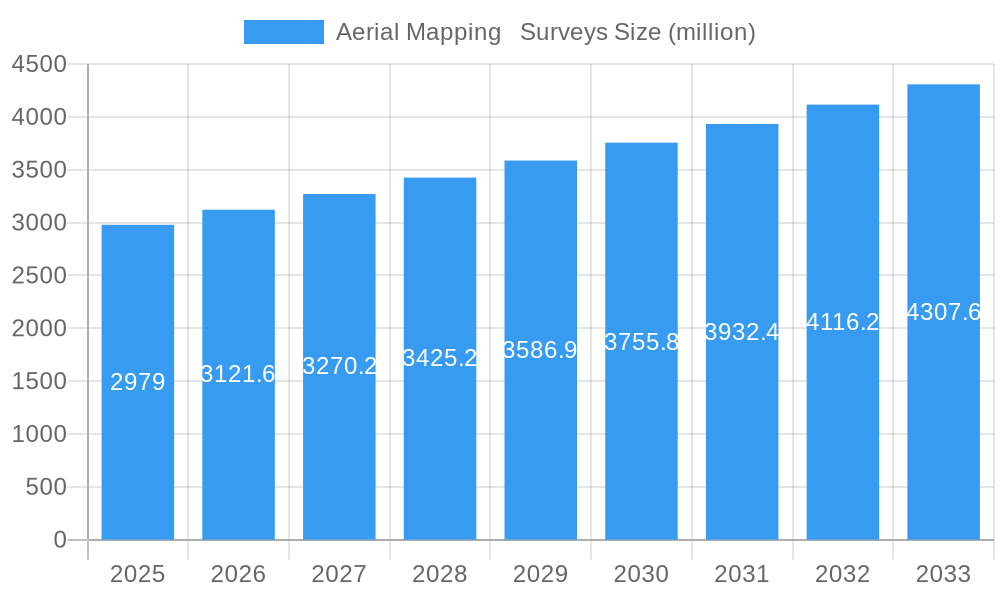
The aerial mapping surveys market, currently valued at $2979 million in 2025, is projected to experience robust growth, driven by a compound annual growth rate (CAGR) of 4.8% from 2025 to 2033. This expansion is fueled by several key factors. The increasing adoption of drones and advanced sensor technologies, such as LiDAR and hyperspectral imaging, is significantly reducing the cost and time associated with data acquisition. This technological advancement makes aerial mapping accessible to a broader range of industries, including agriculture (precision farming), construction (site surveying and progress monitoring), mining (resource exploration and environmental impact assessment), and infrastructure development (planning and asset management). Furthermore, the growing demand for high-resolution imagery and 3D models for various applications, coupled with the increasing need for accurate and timely geospatial data, is bolstering market growth. Government initiatives promoting digitalization and smart city projects are also contributing to the market's expansion, particularly in developed regions.
Aerial Mapping Surveys Market Size (In Billion)
However, the market faces certain restraints. High initial investment costs for equipment and specialized software can be a barrier to entry for smaller players. Data processing and analysis require skilled professionals, leading to a potential talent shortage in some regions. Regulatory hurdles and safety concerns related to drone operations also present challenges. Nevertheless, the ongoing technological advancements, increasing demand across diverse industries, and supportive government policies are expected to outweigh these restraints, ensuring a positive growth trajectory for the aerial mapping surveys market over the forecast period. The segmentation analysis indicates that the 3D modeling segment is experiencing significant growth, fueled by the rising demand for detailed visual representations across industries. Geographically, North America and Europe currently dominate the market, benefiting from a higher adoption rate of advanced technologies and substantial investment in infrastructure projects; however, the Asia-Pacific region is projected to showcase rapid growth in the coming years, driven by expanding urbanization and economic development.
Aerial Mapping Surveys Company Market Share
Aerial Mapping Surveys Market Report: 2019-2033
This comprehensive report provides an in-depth analysis of the global Aerial Mapping Surveys market, projecting a market value exceeding $XX million by 2033. The study covers the historical period (2019-2024), base year (2025), and forecast period (2025-2033), offering invaluable insights for industry stakeholders. Key players like SAM, Woolpert, Atwell, and many more are profiled, providing a complete picture of the competitive landscape and future growth potential.
Aerial Mapping Surveys Market Dynamics & Concentration
The global aerial mapping surveys market is experiencing significant growth driven by increasing demand across diverse sectors. Market concentration is moderately high, with a few major players holding substantial market share. However, the entry of smaller, specialized firms is increasing competition. Innovation is primarily driven by advancements in sensor technology (LiDAR, hyperspectral imaging), drone technology, and data processing capabilities. Regulatory frameworks, particularly concerning data privacy and airspace management, are evolving, impacting market dynamics. Product substitutes, such as traditional ground surveying methods, are gradually being replaced due to the efficiency and cost-effectiveness of aerial mapping. End-user trends showcase a strong preference for high-resolution data and faster turnaround times. M&A activity is moderate, with approximately xx deals recorded between 2019 and 2024, primarily focusing on consolidating market share and acquiring specialized technologies. Key metrics show that the top 5 players collectively hold approximately xx% of the market share in 2025.
- Market Share Concentration: Top 5 players hold approximately xx% in 2025.
- M&A Activity: xx deals between 2019-2024.
- Innovation Drivers: Advancements in sensor technology, drone technology, and data processing.
- Regulatory Impacts: Evolving data privacy and airspace management regulations.
Aerial Mapping Surveys Industry Trends & Analysis
The aerial mapping surveys market is exhibiting a robust Compound Annual Growth Rate (CAGR) of xx% during the forecast period (2025-2033), propelled by several key trends. The increasing adoption of drones for aerial data acquisition is significantly reducing operational costs and enhancing accessibility to remote areas. Technological disruptions, such as the integration of Artificial Intelligence (AI) and Machine Learning (ML) for data processing and analysis, are improving accuracy and efficiency. Consumer preferences are shifting towards higher resolution data, advanced analytical capabilities, and quicker delivery times. Competitive dynamics are characterized by ongoing innovation, strategic partnerships, and a focus on providing comprehensive solutions. Market penetration is increasing rapidly, particularly in developing economies, with xx% estimated market penetration by 2033. Furthermore, the growing adoption of cloud-based data processing and storage solutions is streamlining workflows and improving accessibility. The integration of advanced analytics is also transforming how the collected data is utilized, driving additional growth.
Leading Markets & Segments in Aerial Mapping Surveys
The North American region currently holds the largest market share in aerial mapping surveys, driven by robust infrastructure development, advanced technology adoption, and a supportive regulatory environment. Within the application segments, Land Surveying and Construction are dominant, collectively accounting for over xx million in revenue in 2025. The 3D modeling segment demonstrates exceptional growth within the Type segment due to its increasing use in various applications.
Key Drivers in North America:
- Strong infrastructure development initiatives.
- High adoption of advanced technologies.
- Supportive regulatory environment.
Dominant Application Segments:
- Land Surveying: xx million in revenue in 2025.
- Construction: xx million in revenue in 2025.
Dominant Type Segment:
- 3D Modeling: High growth driven by visualization and analysis needs.
Aerial Mapping Surveys Product Developments
Recent product innovations focus on integrating advanced sensors, such as hyperspectral and LiDAR, for enhanced data capture. These advancements improve the accuracy and detail of the generated maps, expanding the applications across diverse sectors. The development of user-friendly software platforms simplifies data processing and analysis, making aerial mapping more accessible to a wider range of users. The competitive advantage lies in offering comprehensive solutions that combine data acquisition, processing, and analysis capabilities. Technological trends are driving the integration of AI and ML to automate data processing, reduce human error, and improve efficiency. These products are well-positioned to cater to the increasing market demand for accurate, timely, and cost-effective aerial mapping solutions.
Key Drivers of Aerial Mapping Surveys Growth
The growth of the aerial mapping surveys market is driven by several key factors. Technological advancements, particularly in drone technology and sensor capabilities, are enabling higher-resolution data acquisition at lower costs. Government initiatives promoting infrastructure development and smart city projects are fueling demand. The increasing adoption of precision agriculture techniques relies heavily on aerial data for efficient resource management. Finally, the need for efficient and cost-effective monitoring of large-scale infrastructure projects and mining operations is a major contributor to market growth.
Challenges in the Aerial Mapping Surveys Market
The aerial mapping surveys market faces several challenges. Regulatory hurdles, including airspace restrictions and data privacy concerns, can impede operations. Supply chain disruptions related to sensor technology and drone components can impact availability and costs. Intense competition from established players and new entrants necessitates continuous innovation and cost optimization. These factors collectively contribute to a complex market environment impacting profitability and sustainable growth. The estimated impact of these challenges on market growth is approximately xx% reduction in the projected CAGR.
Emerging Opportunities in Aerial Mapping Surveys
Emerging opportunities exist in integrating advanced analytics with aerial data to extract actionable insights across sectors. Strategic partnerships between aerial mapping providers and data analytics firms are creating innovative solutions. Market expansion into developing economies with limited infrastructure presents significant potential for growth. The integration of IoT (Internet of Things) sensors with aerial mapping systems is creating opportunities for real-time monitoring and data collection. These factors are expected to drive future growth and create new market opportunities.
Leading Players in the Aerial Mapping Surveys Sector
- SAM
- Woolpert
- Atwell
- Westwood Professional Services
- Percheron
- SAF Aerogroup
- Aescit Spatial Analysis
- ARC Aerial Imaging
- Fugro
- Applus+
- Keystone Aerial Surveys
- Kenn Borek Air
- BSF Swissphoto
- Operational Solutions
- Aerometrex
- Nearmap
- mdGroup
- AB Surveying and Development
- Goodland
- EMC Survey
- Getmapping
- Arya Geospatial
- Landpoint
- VMAPS
- Feiyan Aviation and Remote Sensing
- Centre Testing International
- Zhongshui Chengkan Institute
- Shaanxi Jinggong General Aviation
- Guangzhou Lantu Geography Information Technology
- Beijing ZK Exploring & Mapping
Key Milestones in Aerial Mapping Surveys Industry
- 2020: Increased adoption of drone technology for data acquisition.
- 2021: Significant advancements in LiDAR sensor technology.
- 2022: Development of cloud-based data processing platforms.
- 2023: Integration of AI and ML for automated data analysis.
- 2024: Several key mergers and acquisitions amongst leading players.
Strategic Outlook for Aerial Mapping Surveys Market
The aerial mapping surveys market is poised for continued robust growth, driven by technological advancements, increasing demand from diverse sectors, and expansion into new markets. Strategic opportunities exist in developing innovative solutions that integrate advanced analytics, AI, and IoT technologies. Partnerships and collaborations will play a critical role in expanding market reach and developing comprehensive service offerings. The market will see sustained growth, exceeding $XX million by 2033, driven by continued technological innovations and expanding applications across various industries.
Aerial Mapping Surveys Segmentation
-
1. Application
- 1.1. Land Surveying
- 1.2. Construction
- 1.3. Agriculture
- 1.4. Mining
- 1.5. Others
-
2. Type
- 2.1. 3D Modeling
- 2.2. Surveying and Mapping
- 2.3. Industrial Inspection
Aerial Mapping Surveys Segmentation By Geography
-
1. North America
- 1.1. United States
- 1.2. Canada
- 1.3. Mexico
-
2. South America
- 2.1. Brazil
- 2.2. Argentina
- 2.3. Rest of South America
-
3. Europe
- 3.1. United Kingdom
- 3.2. Germany
- 3.3. France
- 3.4. Italy
- 3.5. Spain
- 3.6. Russia
- 3.7. Benelux
- 3.8. Nordics
- 3.9. Rest of Europe
-
4. Middle East & Africa
- 4.1. Turkey
- 4.2. Israel
- 4.3. GCC
- 4.4. North Africa
- 4.5. South Africa
- 4.6. Rest of Middle East & Africa
-
5. Asia Pacific
- 5.1. China
- 5.2. India
- 5.3. Japan
- 5.4. South Korea
- 5.5. ASEAN
- 5.6. Oceania
- 5.7. Rest of Asia Pacific
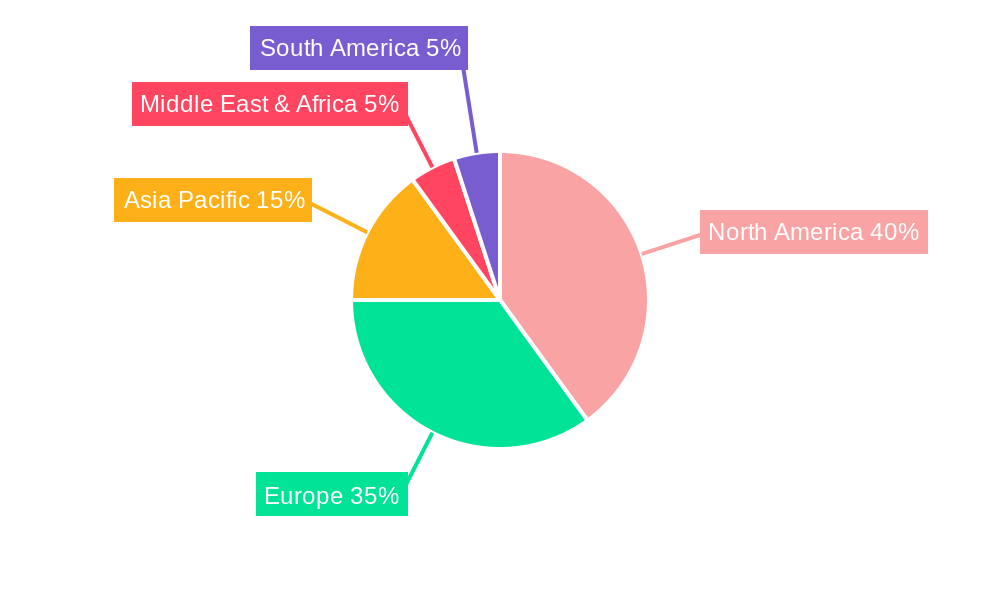
Aerial Mapping Surveys Regional Market Share
Geographic Coverage of Aerial Mapping Surveys
Aerial Mapping Surveys REPORT HIGHLIGHTS
| Aspects | Details |
|---|---|
| Study Period | 2020-2034 |
| Base Year | 2025 |
| Estimated Year | 2026 |
| Forecast Period | 2026-2034 |
| Historical Period | 2020-2025 |
| Growth Rate | CAGR of 4.8% from 2020-2034 |
| Segmentation |
|
Table of Contents
- 1. Introduction
- 1.1. Research Scope
- 1.2. Market Segmentation
- 1.3. Research Methodology
- 1.4. Definitions and Assumptions
- 2. Executive Summary
- 2.1. Introduction
- 3. Market Dynamics
- 3.1. Introduction
- 3.2. Market Drivers
- 3.3. Market Restrains
- 3.4. Market Trends
- 4. Market Factor Analysis
- 4.1. Porters Five Forces
- 4.2. Supply/Value Chain
- 4.3. PESTEL analysis
- 4.4. Market Entropy
- 4.5. Patent/Trademark Analysis
- 5. Global Aerial Mapping Surveys Analysis, Insights and Forecast, 2020-2032
- 5.1. Market Analysis, Insights and Forecast - by Application
- 5.1.1. Land Surveying
- 5.1.2. Construction
- 5.1.3. Agriculture
- 5.1.4. Mining
- 5.1.5. Others
- 5.2. Market Analysis, Insights and Forecast - by Type
- 5.2.1. 3D Modeling
- 5.2.2. Surveying and Mapping
- 5.2.3. Industrial Inspection
- 5.3. Market Analysis, Insights and Forecast - by Region
- 5.3.1. North America
- 5.3.2. South America
- 5.3.3. Europe
- 5.3.4. Middle East & Africa
- 5.3.5. Asia Pacific
- 5.1. Market Analysis, Insights and Forecast - by Application
- 6. North America Aerial Mapping Surveys Analysis, Insights and Forecast, 2020-2032
- 6.1. Market Analysis, Insights and Forecast - by Application
- 6.1.1. Land Surveying
- 6.1.2. Construction
- 6.1.3. Agriculture
- 6.1.4. Mining
- 6.1.5. Others
- 6.2. Market Analysis, Insights and Forecast - by Type
- 6.2.1. 3D Modeling
- 6.2.2. Surveying and Mapping
- 6.2.3. Industrial Inspection
- 6.1. Market Analysis, Insights and Forecast - by Application
- 7. South America Aerial Mapping Surveys Analysis, Insights and Forecast, 2020-2032
- 7.1. Market Analysis, Insights and Forecast - by Application
- 7.1.1. Land Surveying
- 7.1.2. Construction
- 7.1.3. Agriculture
- 7.1.4. Mining
- 7.1.5. Others
- 7.2. Market Analysis, Insights and Forecast - by Type
- 7.2.1. 3D Modeling
- 7.2.2. Surveying and Mapping
- 7.2.3. Industrial Inspection
- 7.1. Market Analysis, Insights and Forecast - by Application
- 8. Europe Aerial Mapping Surveys Analysis, Insights and Forecast, 2020-2032
- 8.1. Market Analysis, Insights and Forecast - by Application
- 8.1.1. Land Surveying
- 8.1.2. Construction
- 8.1.3. Agriculture
- 8.1.4. Mining
- 8.1.5. Others
- 8.2. Market Analysis, Insights and Forecast - by Type
- 8.2.1. 3D Modeling
- 8.2.2. Surveying and Mapping
- 8.2.3. Industrial Inspection
- 8.1. Market Analysis, Insights and Forecast - by Application
- 9. Middle East & Africa Aerial Mapping Surveys Analysis, Insights and Forecast, 2020-2032
- 9.1. Market Analysis, Insights and Forecast - by Application
- 9.1.1. Land Surveying
- 9.1.2. Construction
- 9.1.3. Agriculture
- 9.1.4. Mining
- 9.1.5. Others
- 9.2. Market Analysis, Insights and Forecast - by Type
- 9.2.1. 3D Modeling
- 9.2.2. Surveying and Mapping
- 9.2.3. Industrial Inspection
- 9.1. Market Analysis, Insights and Forecast - by Application
- 10. Asia Pacific Aerial Mapping Surveys Analysis, Insights and Forecast, 2020-2032
- 10.1. Market Analysis, Insights and Forecast - by Application
- 10.1.1. Land Surveying
- 10.1.2. Construction
- 10.1.3. Agriculture
- 10.1.4. Mining
- 10.1.5. Others
- 10.2. Market Analysis, Insights and Forecast - by Type
- 10.2.1. 3D Modeling
- 10.2.2. Surveying and Mapping
- 10.2.3. Industrial Inspection
- 10.1. Market Analysis, Insights and Forecast - by Application
- 11. Competitive Analysis
- 11.1. Global Market Share Analysis 2025
- 11.2. Company Profiles
- 11.2.1 SAM
- 11.2.1.1. Overview
- 11.2.1.2. Products
- 11.2.1.3. SWOT Analysis
- 11.2.1.4. Recent Developments
- 11.2.1.5. Financials (Based on Availability)
- 11.2.2 Woolpert
- 11.2.2.1. Overview
- 11.2.2.2. Products
- 11.2.2.3. SWOT Analysis
- 11.2.2.4. Recent Developments
- 11.2.2.5. Financials (Based on Availability)
- 11.2.3 Atwell
- 11.2.3.1. Overview
- 11.2.3.2. Products
- 11.2.3.3. SWOT Analysis
- 11.2.3.4. Recent Developments
- 11.2.3.5. Financials (Based on Availability)
- 11.2.4 Westwood Professional Services
- 11.2.4.1. Overview
- 11.2.4.2. Products
- 11.2.4.3. SWOT Analysis
- 11.2.4.4. Recent Developments
- 11.2.4.5. Financials (Based on Availability)
- 11.2.5 Percheron
- 11.2.5.1. Overview
- 11.2.5.2. Products
- 11.2.5.3. SWOT Analysis
- 11.2.5.4. Recent Developments
- 11.2.5.5. Financials (Based on Availability)
- 11.2.6 SAF Aerogroup
- 11.2.6.1. Overview
- 11.2.6.2. Products
- 11.2.6.3. SWOT Analysis
- 11.2.6.4. Recent Developments
- 11.2.6.5. Financials (Based on Availability)
- 11.2.7 Aescit Spatial Analysis
- 11.2.7.1. Overview
- 11.2.7.2. Products
- 11.2.7.3. SWOT Analysis
- 11.2.7.4. Recent Developments
- 11.2.7.5. Financials (Based on Availability)
- 11.2.8 ARC Aerial Imaging
- 11.2.8.1. Overview
- 11.2.8.2. Products
- 11.2.8.3. SWOT Analysis
- 11.2.8.4. Recent Developments
- 11.2.8.5. Financials (Based on Availability)
- 11.2.9 Fugro
- 11.2.9.1. Overview
- 11.2.9.2. Products
- 11.2.9.3. SWOT Analysis
- 11.2.9.4. Recent Developments
- 11.2.9.5. Financials (Based on Availability)
- 11.2.10 Applus+
- 11.2.10.1. Overview
- 11.2.10.2. Products
- 11.2.10.3. SWOT Analysis
- 11.2.10.4. Recent Developments
- 11.2.10.5. Financials (Based on Availability)
- 11.2.11 Keystone Aerial Surveys
- 11.2.11.1. Overview
- 11.2.11.2. Products
- 11.2.11.3. SWOT Analysis
- 11.2.11.4. Recent Developments
- 11.2.11.5. Financials (Based on Availability)
- 11.2.12 Kenn Borek Air
- 11.2.12.1. Overview
- 11.2.12.2. Products
- 11.2.12.3. SWOT Analysis
- 11.2.12.4. Recent Developments
- 11.2.12.5. Financials (Based on Availability)
- 11.2.13 BSF Swissphoto
- 11.2.13.1. Overview
- 11.2.13.2. Products
- 11.2.13.3. SWOT Analysis
- 11.2.13.4. Recent Developments
- 11.2.13.5. Financials (Based on Availability)
- 11.2.14 Operational Solutions
- 11.2.14.1. Overview
- 11.2.14.2. Products
- 11.2.14.3. SWOT Analysis
- 11.2.14.4. Recent Developments
- 11.2.14.5. Financials (Based on Availability)
- 11.2.15 Aerometrex
- 11.2.15.1. Overview
- 11.2.15.2. Products
- 11.2.15.3. SWOT Analysis
- 11.2.15.4. Recent Developments
- 11.2.15.5. Financials (Based on Availability)
- 11.2.16 Nearmap
- 11.2.16.1. Overview
- 11.2.16.2. Products
- 11.2.16.3. SWOT Analysis
- 11.2.16.4. Recent Developments
- 11.2.16.5. Financials (Based on Availability)
- 11.2.17 mdGroup
- 11.2.17.1. Overview
- 11.2.17.2. Products
- 11.2.17.3. SWOT Analysis
- 11.2.17.4. Recent Developments
- 11.2.17.5. Financials (Based on Availability)
- 11.2.18 AB Surveying and Development
- 11.2.18.1. Overview
- 11.2.18.2. Products
- 11.2.18.3. SWOT Analysis
- 11.2.18.4. Recent Developments
- 11.2.18.5. Financials (Based on Availability)
- 11.2.19 Goodland
- 11.2.19.1. Overview
- 11.2.19.2. Products
- 11.2.19.3. SWOT Analysis
- 11.2.19.4. Recent Developments
- 11.2.19.5. Financials (Based on Availability)
- 11.2.20 EMC Survey
- 11.2.20.1. Overview
- 11.2.20.2. Products
- 11.2.20.3. SWOT Analysis
- 11.2.20.4. Recent Developments
- 11.2.20.5. Financials (Based on Availability)
- 11.2.21 Getmapping
- 11.2.21.1. Overview
- 11.2.21.2. Products
- 11.2.21.3. SWOT Analysis
- 11.2.21.4. Recent Developments
- 11.2.21.5. Financials (Based on Availability)
- 11.2.22 Arya Geospatial
- 11.2.22.1. Overview
- 11.2.22.2. Products
- 11.2.22.3. SWOT Analysis
- 11.2.22.4. Recent Developments
- 11.2.22.5. Financials (Based on Availability)
- 11.2.23 Landpoint
- 11.2.23.1. Overview
- 11.2.23.2. Products
- 11.2.23.3. SWOT Analysis
- 11.2.23.4. Recent Developments
- 11.2.23.5. Financials (Based on Availability)
- 11.2.24 VMAPS
- 11.2.24.1. Overview
- 11.2.24.2. Products
- 11.2.24.3. SWOT Analysis
- 11.2.24.4. Recent Developments
- 11.2.24.5. Financials (Based on Availability)
- 11.2.25 Feiyan Aviation and Remote Sensing
- 11.2.25.1. Overview
- 11.2.25.2. Products
- 11.2.25.3. SWOT Analysis
- 11.2.25.4. Recent Developments
- 11.2.25.5. Financials (Based on Availability)
- 11.2.26 Centre Testing International
- 11.2.26.1. Overview
- 11.2.26.2. Products
- 11.2.26.3. SWOT Analysis
- 11.2.26.4. Recent Developments
- 11.2.26.5. Financials (Based on Availability)
- 11.2.27 Zhongshui Chengkan Institute
- 11.2.27.1. Overview
- 11.2.27.2. Products
- 11.2.27.3. SWOT Analysis
- 11.2.27.4. Recent Developments
- 11.2.27.5. Financials (Based on Availability)
- 11.2.28 Shaanxi Jinggong General Aviation
- 11.2.28.1. Overview
- 11.2.28.2. Products
- 11.2.28.3. SWOT Analysis
- 11.2.28.4. Recent Developments
- 11.2.28.5. Financials (Based on Availability)
- 11.2.29 Guangzhou Lantu Geography Information Technology
- 11.2.29.1. Overview
- 11.2.29.2. Products
- 11.2.29.3. SWOT Analysis
- 11.2.29.4. Recent Developments
- 11.2.29.5. Financials (Based on Availability)
- 11.2.30 Beijing ZK Exploring & Mapping
- 11.2.30.1. Overview
- 11.2.30.2. Products
- 11.2.30.3. SWOT Analysis
- 11.2.30.4. Recent Developments
- 11.2.30.5. Financials (Based on Availability)
- 11.2.1 SAM
List of Figures
- Figure 1: Global Aerial Mapping Surveys Revenue Breakdown (million, %) by Region 2025 & 2033
- Figure 2: North America Aerial Mapping Surveys Revenue (million), by Application 2025 & 2033
- Figure 3: North America Aerial Mapping Surveys Revenue Share (%), by Application 2025 & 2033
- Figure 4: North America Aerial Mapping Surveys Revenue (million), by Type 2025 & 2033
- Figure 5: North America Aerial Mapping Surveys Revenue Share (%), by Type 2025 & 2033
- Figure 6: North America Aerial Mapping Surveys Revenue (million), by Country 2025 & 2033
- Figure 7: North America Aerial Mapping Surveys Revenue Share (%), by Country 2025 & 2033
- Figure 8: South America Aerial Mapping Surveys Revenue (million), by Application 2025 & 2033
- Figure 9: South America Aerial Mapping Surveys Revenue Share (%), by Application 2025 & 2033
- Figure 10: South America Aerial Mapping Surveys Revenue (million), by Type 2025 & 2033
- Figure 11: South America Aerial Mapping Surveys Revenue Share (%), by Type 2025 & 2033
- Figure 12: South America Aerial Mapping Surveys Revenue (million), by Country 2025 & 2033
- Figure 13: South America Aerial Mapping Surveys Revenue Share (%), by Country 2025 & 2033
- Figure 14: Europe Aerial Mapping Surveys Revenue (million), by Application 2025 & 2033
- Figure 15: Europe Aerial Mapping Surveys Revenue Share (%), by Application 2025 & 2033
- Figure 16: Europe Aerial Mapping Surveys Revenue (million), by Type 2025 & 2033
- Figure 17: Europe Aerial Mapping Surveys Revenue Share (%), by Type 2025 & 2033
- Figure 18: Europe Aerial Mapping Surveys Revenue (million), by Country 2025 & 2033
- Figure 19: Europe Aerial Mapping Surveys Revenue Share (%), by Country 2025 & 2033
- Figure 20: Middle East & Africa Aerial Mapping Surveys Revenue (million), by Application 2025 & 2033
- Figure 21: Middle East & Africa Aerial Mapping Surveys Revenue Share (%), by Application 2025 & 2033
- Figure 22: Middle East & Africa Aerial Mapping Surveys Revenue (million), by Type 2025 & 2033
- Figure 23: Middle East & Africa Aerial Mapping Surveys Revenue Share (%), by Type 2025 & 2033
- Figure 24: Middle East & Africa Aerial Mapping Surveys Revenue (million), by Country 2025 & 2033
- Figure 25: Middle East & Africa Aerial Mapping Surveys Revenue Share (%), by Country 2025 & 2033
- Figure 26: Asia Pacific Aerial Mapping Surveys Revenue (million), by Application 2025 & 2033
- Figure 27: Asia Pacific Aerial Mapping Surveys Revenue Share (%), by Application 2025 & 2033
- Figure 28: Asia Pacific Aerial Mapping Surveys Revenue (million), by Type 2025 & 2033
- Figure 29: Asia Pacific Aerial Mapping Surveys Revenue Share (%), by Type 2025 & 2033
- Figure 30: Asia Pacific Aerial Mapping Surveys Revenue (million), by Country 2025 & 2033
- Figure 31: Asia Pacific Aerial Mapping Surveys Revenue Share (%), by Country 2025 & 2033
List of Tables
- Table 1: Global Aerial Mapping Surveys Revenue million Forecast, by Application 2020 & 2033
- Table 2: Global Aerial Mapping Surveys Revenue million Forecast, by Type 2020 & 2033
- Table 3: Global Aerial Mapping Surveys Revenue million Forecast, by Region 2020 & 2033
- Table 4: Global Aerial Mapping Surveys Revenue million Forecast, by Application 2020 & 2033
- Table 5: Global Aerial Mapping Surveys Revenue million Forecast, by Type 2020 & 2033
- Table 6: Global Aerial Mapping Surveys Revenue million Forecast, by Country 2020 & 2033
- Table 7: United States Aerial Mapping Surveys Revenue (million) Forecast, by Application 2020 & 2033
- Table 8: Canada Aerial Mapping Surveys Revenue (million) Forecast, by Application 2020 & 2033
- Table 9: Mexico Aerial Mapping Surveys Revenue (million) Forecast, by Application 2020 & 2033
- Table 10: Global Aerial Mapping Surveys Revenue million Forecast, by Application 2020 & 2033
- Table 11: Global Aerial Mapping Surveys Revenue million Forecast, by Type 2020 & 2033
- Table 12: Global Aerial Mapping Surveys Revenue million Forecast, by Country 2020 & 2033
- Table 13: Brazil Aerial Mapping Surveys Revenue (million) Forecast, by Application 2020 & 2033
- Table 14: Argentina Aerial Mapping Surveys Revenue (million) Forecast, by Application 2020 & 2033
- Table 15: Rest of South America Aerial Mapping Surveys Revenue (million) Forecast, by Application 2020 & 2033
- Table 16: Global Aerial Mapping Surveys Revenue million Forecast, by Application 2020 & 2033
- Table 17: Global Aerial Mapping Surveys Revenue million Forecast, by Type 2020 & 2033
- Table 18: Global Aerial Mapping Surveys Revenue million Forecast, by Country 2020 & 2033
- Table 19: United Kingdom Aerial Mapping Surveys Revenue (million) Forecast, by Application 2020 & 2033
- Table 20: Germany Aerial Mapping Surveys Revenue (million) Forecast, by Application 2020 & 2033
- Table 21: France Aerial Mapping Surveys Revenue (million) Forecast, by Application 2020 & 2033
- Table 22: Italy Aerial Mapping Surveys Revenue (million) Forecast, by Application 2020 & 2033
- Table 23: Spain Aerial Mapping Surveys Revenue (million) Forecast, by Application 2020 & 2033
- Table 24: Russia Aerial Mapping Surveys Revenue (million) Forecast, by Application 2020 & 2033
- Table 25: Benelux Aerial Mapping Surveys Revenue (million) Forecast, by Application 2020 & 2033
- Table 26: Nordics Aerial Mapping Surveys Revenue (million) Forecast, by Application 2020 & 2033
- Table 27: Rest of Europe Aerial Mapping Surveys Revenue (million) Forecast, by Application 2020 & 2033
- Table 28: Global Aerial Mapping Surveys Revenue million Forecast, by Application 2020 & 2033
- Table 29: Global Aerial Mapping Surveys Revenue million Forecast, by Type 2020 & 2033
- Table 30: Global Aerial Mapping Surveys Revenue million Forecast, by Country 2020 & 2033
- Table 31: Turkey Aerial Mapping Surveys Revenue (million) Forecast, by Application 2020 & 2033
- Table 32: Israel Aerial Mapping Surveys Revenue (million) Forecast, by Application 2020 & 2033
- Table 33: GCC Aerial Mapping Surveys Revenue (million) Forecast, by Application 2020 & 2033
- Table 34: North Africa Aerial Mapping Surveys Revenue (million) Forecast, by Application 2020 & 2033
- Table 35: South Africa Aerial Mapping Surveys Revenue (million) Forecast, by Application 2020 & 2033
- Table 36: Rest of Middle East & Africa Aerial Mapping Surveys Revenue (million) Forecast, by Application 2020 & 2033
- Table 37: Global Aerial Mapping Surveys Revenue million Forecast, by Application 2020 & 2033
- Table 38: Global Aerial Mapping Surveys Revenue million Forecast, by Type 2020 & 2033
- Table 39: Global Aerial Mapping Surveys Revenue million Forecast, by Country 2020 & 2033
- Table 40: China Aerial Mapping Surveys Revenue (million) Forecast, by Application 2020 & 2033
- Table 41: India Aerial Mapping Surveys Revenue (million) Forecast, by Application 2020 & 2033
- Table 42: Japan Aerial Mapping Surveys Revenue (million) Forecast, by Application 2020 & 2033
- Table 43: South Korea Aerial Mapping Surveys Revenue (million) Forecast, by Application 2020 & 2033
- Table 44: ASEAN Aerial Mapping Surveys Revenue (million) Forecast, by Application 2020 & 2033
- Table 45: Oceania Aerial Mapping Surveys Revenue (million) Forecast, by Application 2020 & 2033
- Table 46: Rest of Asia Pacific Aerial Mapping Surveys Revenue (million) Forecast, by Application 2020 & 2033
Frequently Asked Questions
1. What is the projected Compound Annual Growth Rate (CAGR) of the Aerial Mapping Surveys?
The projected CAGR is approximately 4.8%.
2. Which companies are prominent players in the Aerial Mapping Surveys?
Key companies in the market include SAM, Woolpert, Atwell, Westwood Professional Services, Percheron, SAF Aerogroup, Aescit Spatial Analysis, ARC Aerial Imaging, Fugro, Applus+, Keystone Aerial Surveys, Kenn Borek Air, BSF Swissphoto, Operational Solutions, Aerometrex, Nearmap, mdGroup, AB Surveying and Development, Goodland, EMC Survey, Getmapping, Arya Geospatial, Landpoint, VMAPS, Feiyan Aviation and Remote Sensing, Centre Testing International, Zhongshui Chengkan Institute, Shaanxi Jinggong General Aviation, Guangzhou Lantu Geography Information Technology, Beijing ZK Exploring & Mapping.
3. What are the main segments of the Aerial Mapping Surveys?
The market segments include Application, Type.
4. Can you provide details about the market size?
The market size is estimated to be USD 2979 million as of 2022.
5. What are some drivers contributing to market growth?
N/A
6. What are the notable trends driving market growth?
N/A
7. Are there any restraints impacting market growth?
N/A
8. Can you provide examples of recent developments in the market?
N/A
9. What pricing options are available for accessing the report?
Pricing options include single-user, multi-user, and enterprise licenses priced at USD 4250.00, USD 6375.00, and USD 8500.00 respectively.
10. Is the market size provided in terms of value or volume?
The market size is provided in terms of value, measured in million.
11. Are there any specific market keywords associated with the report?
Yes, the market keyword associated with the report is "Aerial Mapping Surveys," which aids in identifying and referencing the specific market segment covered.
12. How do I determine which pricing option suits my needs best?
The pricing options vary based on user requirements and access needs. Individual users may opt for single-user licenses, while businesses requiring broader access may choose multi-user or enterprise licenses for cost-effective access to the report.
13. Are there any additional resources or data provided in the Aerial Mapping Surveys report?
While the report offers comprehensive insights, it's advisable to review the specific contents or supplementary materials provided to ascertain if additional resources or data are available.
14. How can I stay updated on further developments or reports in the Aerial Mapping Surveys?
To stay informed about further developments, trends, and reports in the Aerial Mapping Surveys, consider subscribing to industry newsletters, following relevant companies and organizations, or regularly checking reputable industry news sources and publications.
Methodology
Step 1 - Identification of Relevant Samples Size from Population Database


Step 2 - Approaches for Defining Global Market Size (Value, Volume* & Price*)

Note*: In applicable scenarios
Step 3 - Data Sources
Primary Research
- Web Analytics
- Survey Reports
- Research Institute
- Latest Research Reports
- Opinion Leaders
Secondary Research
- Annual Reports
- White Paper
- Latest Press Release
- Industry Association
- Paid Database
- Investor Presentations

Step 4 - Data Triangulation
Involves using different sources of information in order to increase the validity of a study
These sources are likely to be stakeholders in a program - participants, other researchers, program staff, other community members, and so on.
Then we put all data in single framework & apply various statistical tools to find out the dynamic on the market.
During the analysis stage, feedback from the stakeholder groups would be compared to determine areas of agreement as well as areas of divergence