

Key Insights
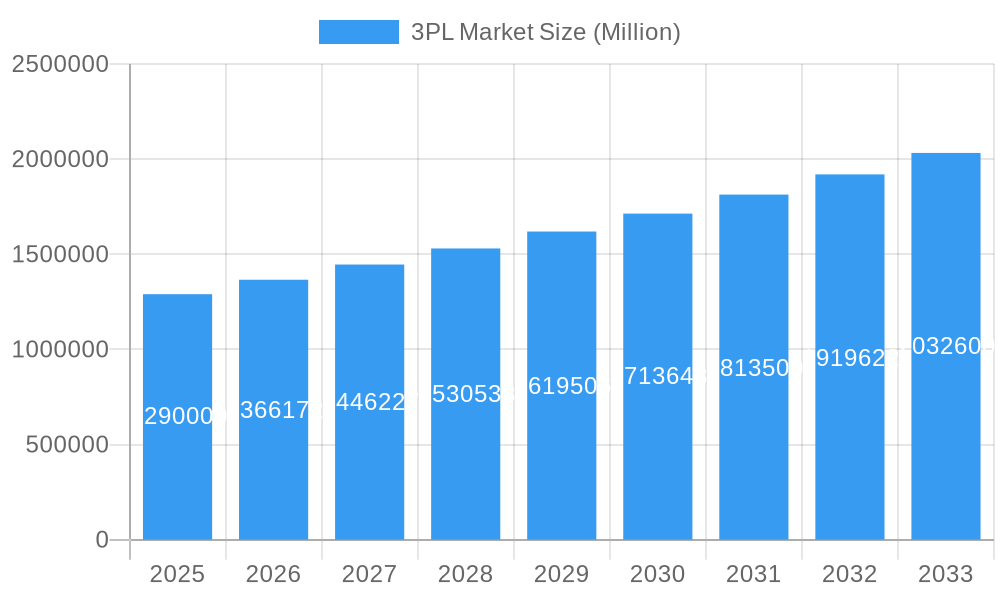
The global third-party logistics (3PL) market, valued at $1.29 trillion in 2025, is experiencing robust growth, projected to expand at a compound annual growth rate (CAGR) of 5.48% from 2025 to 2033. This expansion is driven by several key factors. The increasing complexity of global supply chains necessitates outsourcing logistics functions to specialized 3PL providers, enabling businesses to focus on core competencies. E-commerce's continued surge fuels demand for efficient warehousing, last-mile delivery, and order fulfillment services. Furthermore, technological advancements, such as automation, artificial intelligence, and real-time tracking, are enhancing efficiency and transparency within the 3PL sector, driving further adoption. The diverse range of services offered, including domestic and international transportation management, value-added warehousing and distribution, caters to various end-user industries, including automobile, energy, manufacturing, life sciences and healthcare, retail technology, and others, contributing to the market's broad appeal. Competition amongst established players like DB Schenker, DHL, FedEx, and Kuehne+Nagel, alongside emerging regional players, fosters innovation and drives down costs.
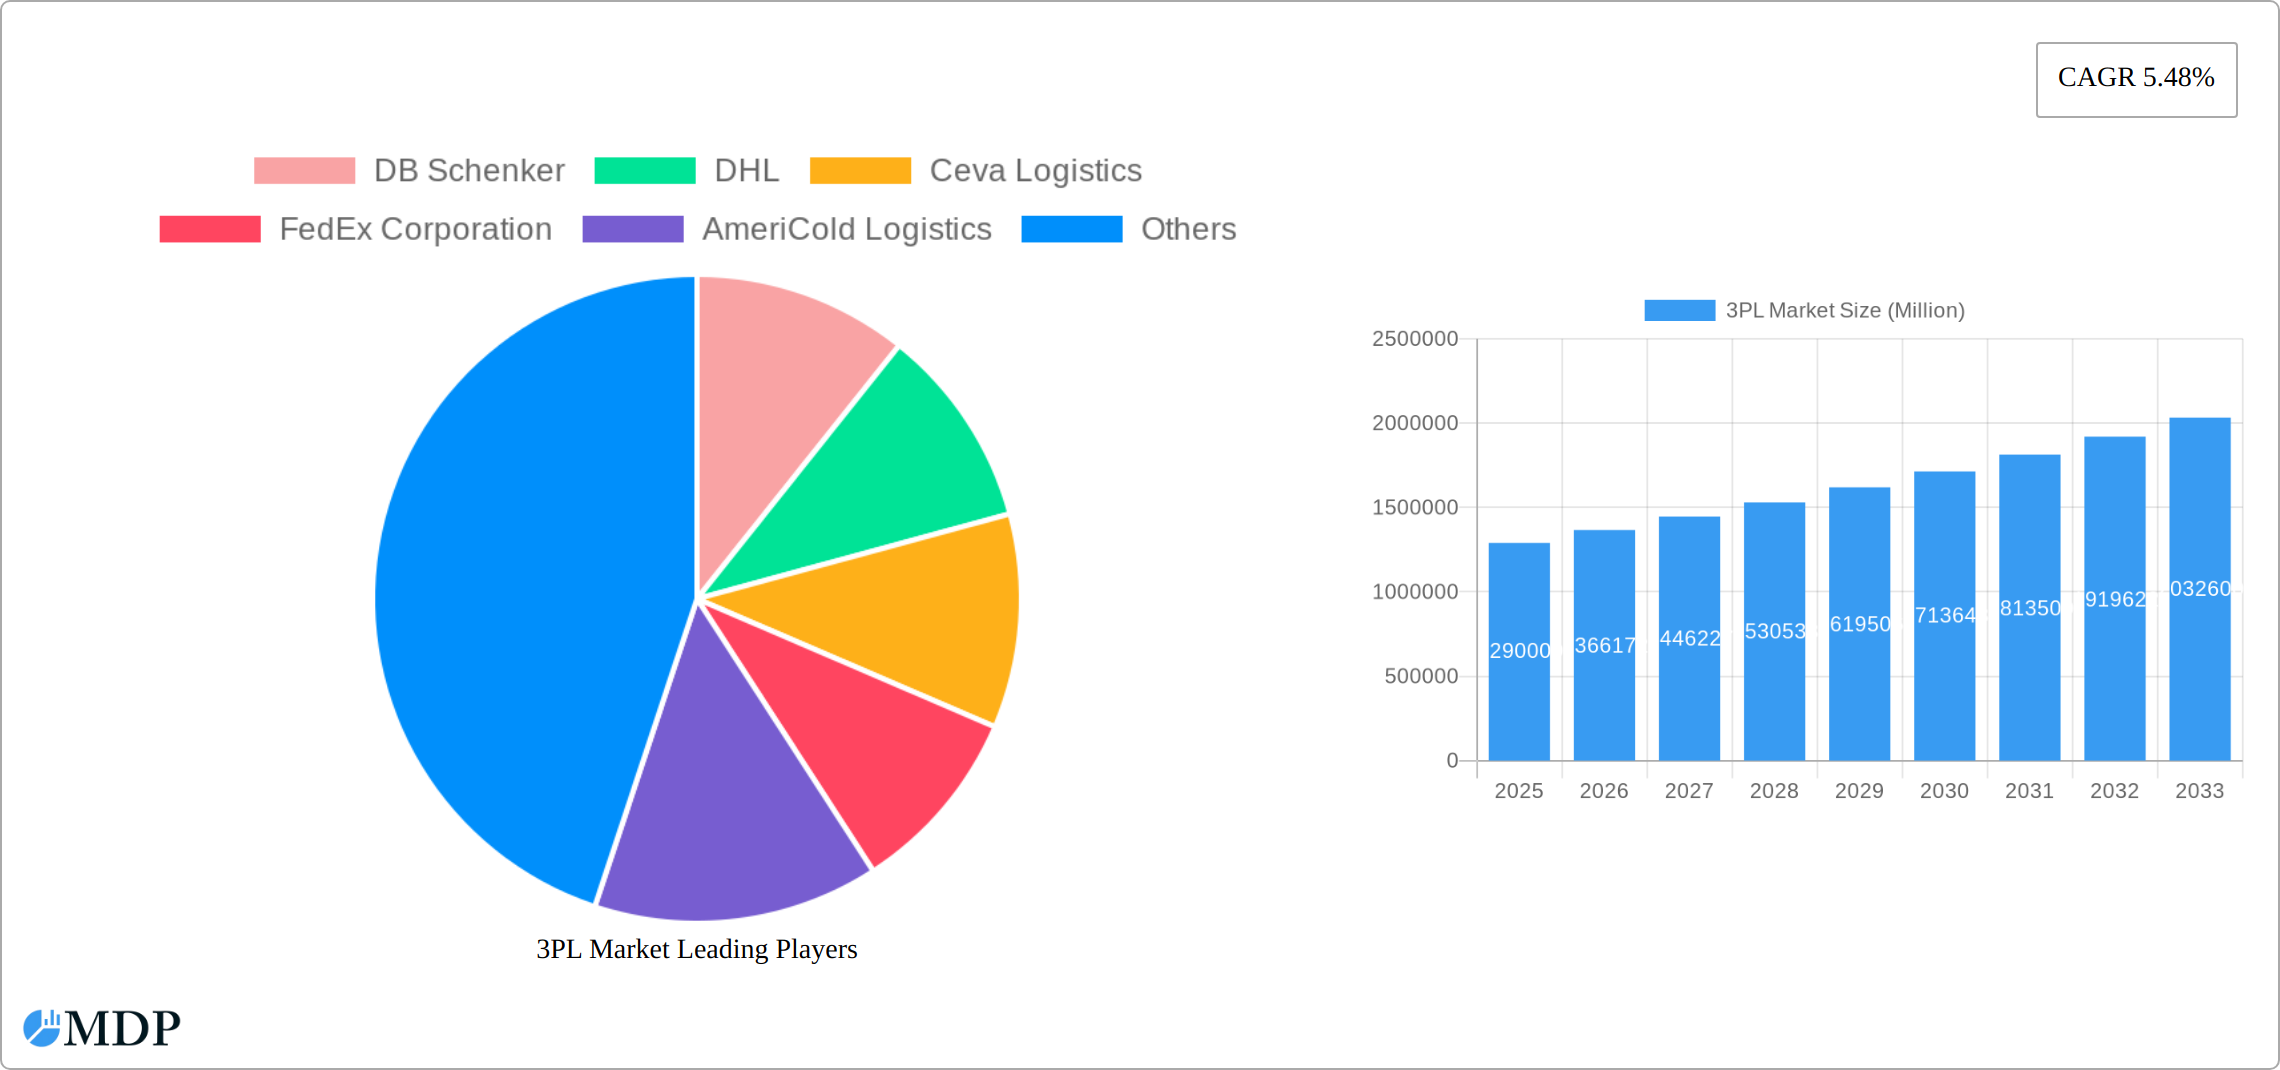
3PL Market Market Size (In Million)
Geographical distribution reveals a substantial market presence across North America, Europe, and Asia-Pacific. North America benefits from robust e-commerce and established logistics infrastructure, while Europe's mature economies and extensive trade networks provide ample opportunities. The Asia-Pacific region demonstrates strong growth potential driven by rapid industrialization and expanding e-commerce markets. While market growth is expected to remain steady, potential restraints include geopolitical instability, economic fluctuations, and potential supply chain disruptions, all of which may cause fluctuations in the market's growth trajectory. However, the overall outlook remains optimistic, driven by the enduring need for efficient and reliable logistics solutions across various industries and geographies. The continuous integration of technology and the rise of specialized services are poised to further reshape the competitive landscape and fuel the market's long-term growth.
3PL Market Company Market Share
This comprehensive report provides a detailed analysis of the 3PL market, offering invaluable insights for industry stakeholders, investors, and businesses seeking to navigate this dynamic sector. With a forecast period spanning 2025-2033 and a historical overview from 2019-2024, this report offers a 360-degree perspective, incorporating detailed market segmentation, competitive landscapes, and emerging trends shaping the future of third-party logistics. The report projects a market valued at $xx Million by 2025 and is poised for significant growth throughout the forecast period.
3PL Market Market Dynamics & Concentration
The 3PL market is characterized by a high degree of concentration, with a handful of major players commanding significant market share. The market's dynamism is fueled by constant innovation, evolving regulatory frameworks, the rise of substitute products (e.g., in-house logistics solutions), and shifting end-user trends. Mergers and acquisitions (M&A) activity is frequent, reflecting consolidation and expansion strategies within the sector.
- Market Concentration: The top 10 players account for an estimated xx% of the global market share in 2025.
- Innovation Drivers: Automation, AI, and data analytics are driving significant innovation, improving efficiency and optimizing supply chains.
- Regulatory Landscape: Evolving regulations regarding transportation, trade, and data privacy significantly influence market dynamics and operational costs.
- Product Substitutes: The increasing feasibility of in-house logistics solutions presents a competitive challenge to 3PL providers.
- End-User Trends: Growth in e-commerce and the rise of omnichannel retail are key drivers of 3PL market expansion.
- M&A Activity: The annual number of M&A deals in the 3PL sector averaged approximately xx in the period 2019-2024, indicative of consolidation and expansion within the industry. Notable deals include (examples needed, data not provided).
3PL Market Industry Trends & Analysis
The 3PL market is experiencing a period of unprecedented expansion, propelled by a confluence of powerful forces. Projections indicate a robust Compound Annual Growth Rate (CAGR) of approximately **6.5% to 7.5%** during the forecast period spanning 2025-2033. This accelerated growth is largely attributed to profound technological disruptions, with the increasing integration of automation, artificial intelligence (AI), and the Internet of Things (IoT) fundamentally revolutionizing logistics operations. These advancements are not only optimizing efficiency and drastically reducing operational costs but also enabling more agile and responsive supply chains. Simultaneously, evolving consumer expectations for expedited, reliable, and transparent delivery services are significantly elevating the demand for sophisticated 3PL solutions. The competitive landscape is intensely dynamic, characterized by both established industry giants and agile new entrants, fostering a climate of continuous innovation. The market penetration of 3PL services is steadily climbing across a diverse range of sectors, with e-commerce demonstrating particularly remarkable adoption, projected to reach an estimated **75-80%** penetration rate by 2025. Furthermore, the escalating complexity and global reach of modern supply chains are creating an increasing imperative for specialized and expert 3PL providers to navigate these intricate networks.
Leading Markets & Segments in 3PL Market
North America currently holds a commanding position in the global 3PL market, representing an estimated **30-35%** of the worldwide market share in 2025. However, the Asia-Pacific region is poised to emerge as the fastest-growing market, exhibiting significant upward momentum during the forecast period, driven by rapid industrialization and expanding trade networks.
By Service:
- Domestic Transportation Management: Experiencing substantial growth, largely fueled by the explosive expansion of domestic e-commerce and strengthening regional trade ties. Key catalysts include ongoing robust infrastructure investments and the implementation of supportive economic policies that encourage internal commerce.
- International Transportation Management: This segment is seeing accelerated growth as a direct consequence of increasing globalization and the steady rise in cross-border trade activities. Enhanced trade agreements and continuous advancements in logistics technology are pivotal drivers here.
- Value-added Warehousing and Distribution: Witnessing considerable growth, primarily driven by the escalating demand for specialized warehousing solutions tailored to specific industry needs and a growing emphasis on comprehensive supply chain optimization services. The burgeoning e-commerce fulfillment sector and the widespread adoption of advanced Warehouse Management Systems (WMS) are key contributors.
By End User:
- Retail: This segment continues to be the largest end-user, predominantly propelled by the unprecedented boom in e-commerce, which necessitates highly efficient and scalable order fulfillment and last-mile delivery operations.
- Manufacturing: Growth in this sector is intrinsically linked to the expansion of global manufacturing hubs and the increasing reliance on agile and cost-effective supply chains to manage inbound and outbound logistics.
- Life Science and Healthcare: Characterized by a unique set of challenges, including stringent regulatory compliance requirements and the critical need for specialized logistics solutions that ensure product integrity and timely delivery, this segment is showing steady growth.
- Other End Users: Encompassing a diverse array of industries with varying and often complex logistics requirements, this collective segment plays a significant role in the overall market expansion, contributing to the broad application of 3PL services.
3PL Market Product Developments
Recent product innovations focus on integrating advanced technologies like artificial intelligence (AI), machine learning (ML), and the Internet of Things (IoT) to enhance supply chain visibility, automation, and predictive analytics. These developments improve efficiency, optimize costs, and enhance the overall customer experience. The market is also witnessing the integration of robotics and automation in warehousing and distribution, further improving operational efficiency and reducing labor costs.
Key Drivers of 3PL Market Growth
Several pivotal factors are actively propelling the growth trajectory of the 3PL market:
- Technological Advancements: The pervasive integration of AI, sophisticated automation, and IoT technologies is fundamentally transforming logistics operations, leading to enhanced efficiency, reduced errors, and significant cost savings.
- E-commerce Boom: The exponential and sustained growth of e-commerce platforms worldwide is creating an insatiable demand for streamlined order fulfillment, efficient warehousing, and reliable last-mile delivery solutions, all core competencies of 3PL providers.
- Globalization: As businesses increasingly operate on a global scale, the inherent complexity of international trade and multi-national supply chains necessitates the expertise and infrastructure offered by 3PL services for effective management and optimization.
- Supply Chain Optimization: Businesses are increasingly recognizing the strategic advantage of outsourcing their logistics functions to specialized 3PL providers who can offer expertise in streamlining operations, reducing lead times, and improving overall supply chain resilience and efficiency.
Challenges in the 3PL Market Market
The 3PL market faces several challenges:
- Regulatory Compliance: Stringent regulations in different regions increase operational complexities and compliance costs.
- Supply Chain Disruptions: Geopolitical uncertainties and unforeseen events (e.g., pandemics) can disrupt supply chains, impacting 3PL operations.
- Competition: The market is intensely competitive, with both established players and new entrants vying for market share. This can lead to price pressure and reduced profit margins.
Emerging Opportunities in 3PL Market
The 3PL market is ripe with significant and expanding long-term growth opportunities:
- Technological Breakthroughs: The ongoing development and widespread adoption of cutting-edge technologies such as advanced AI algorithms, robotic automation, and blockchain for enhanced transparency and security are expected to further revolutionize efficiency and create entirely new service paradigms.
- Strategic Partnerships: The formation of synergistic collaborations and strategic alliances between 3PL providers and innovative technology companies presents a powerful avenue for unlocking new market segments, developing unique service offerings, and enhancing overall service capabilities and customer value.
- Market Expansion: Significant growth potential lies in the expansion into rapidly developing emerging economies and currently underserved markets, where the adoption of formalized logistics services is still gaining momentum, offering substantial untapped market share.
Leading Players in the 3PL Market Sector
Key Milestones in 3PL Market Industry
- December 2022: SEKO Logistics partners with GreyOrange to implement robotics in its UK warehouses, signaling a wider adoption of automation in the industry.
- September 2022: AI LOGISTIX partners with SUN Mobility to provide electric vehicle-based last-mile delivery services in India, highlighting the growing importance of sustainable logistics solutions.
Strategic Outlook for 3PL Market Market
The 3PL market is poised for continued expansion, driven by technological innovation, globalization, and the growth of e-commerce. Strategic partnerships, investments in advanced technologies, and expansion into new markets will be critical for success in this dynamic and competitive sector. The focus on sustainability and the adoption of environmentally friendly practices will also be crucial factors shaping the future of the 3PL market.
3PL Market Segmentation
-
1. Service
- 1.1. Domestic Transportation Management
- 1.2. International Transportation Management
- 1.3. Value-added Warehousing and Distribution
-
2. End User
- 2.1. Automobile
- 2.2. Energy
- 2.3. Manufacturing
- 2.4. Life Science and Healthcare
- 2.5. Retail Technology
- 2.6. Other End Users
3PL Market Segmentation By Geography
-
1. North America
- 1.1. United States
- 1.2. Canada
- 1.3. Mexico
-
2. South America
- 2.1. Brazil
- 2.2. Argentina
- 2.3. Rest of South America
-
3. Asia Pacific
- 3.1. India
- 3.2. China
- 3.3. Singapore
- 3.4. Japan
- 3.5. South Korea
- 3.6. Vietnam
- 3.7. Australia
- 3.8. Rest of Asia Pacific
-
4. Middle East and Africa
- 4.1. South Africa
- 4.2. United Arab Emirates
- 4.3. Saudi Arabia
- 4.4. Egypt
- 4.5. Rest of Middle East and Africa
-
5. Europe
- 5.1. Germany
- 5.2. Spain
- 5.3. France
- 5.4. Russia
- 5.5. United Kingdom
- 5.6. Rest of Europe
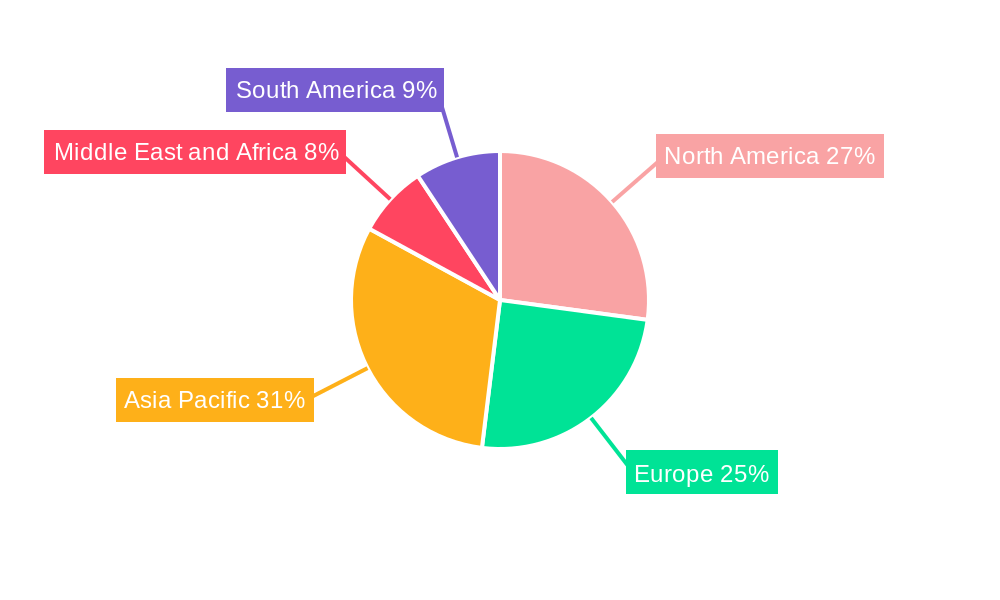
3PL Market Regional Market Share
Geographic Coverage of 3PL Market
3PL Market REPORT HIGHLIGHTS
| Aspects | Details |
|---|---|
| Study Period | 2020-2034 |
| Base Year | 2025 |
| Estimated Year | 2026 |
| Forecast Period | 2026-2034 |
| Historical Period | 2020-2025 |
| Growth Rate | CAGR of 5.48% from 2020-2034 |
| Segmentation |
|
Table of Contents
- 1. Introduction
- 1.1. Research Scope
- 1.2. Market Segmentation
- 1.3. Research Objective
- 1.4. Definitions and Assumptions
- 2. Executive Summary
- 2.1. Market Snapshot
- 3. Market Dynamics
- 3.1. Market Drivers
- 3.2. Market Restrains
- 3.3. Market Trends
- 3.4. Market Opportunities
- 4. Market Factor Analysis
- 4.1. Porters Five Forces
- 4.1.1. Bargaining Power of Suppliers
- 4.1.2. Bargaining Power of Buyers
- 4.1.3. Threat of New Entrants
- 4.1.4. Threat of Substitutes
- 4.1.5. Competitive Rivalry
- 4.2. PESTEL analysis
- 4.3. BCG Analysis
- 4.3.1. Stars (High Growth, High Market Share)
- 4.3.2. Cash Cows (Low Growth, High Market Share)
- 4.3.3. Question Mark (High Growth, Low Market Share)
- 4.3.4. Dogs (Low Growth, Low Market Share)
- 4.4. Ansoff Matrix Analysis
- 4.5. Supply Chain Analysis
- 4.6. Regulatory Landscape
- 4.7. Current Market Potential and Opportunity Assessment (TAM–SAM–SOM Framework)
- 4.8. MDP Analyst Note
- 4.1. Porters Five Forces
- 5. Market Analysis, Insights and Forecast 2021-2033
- 5.1. Market Analysis, Insights and Forecast - by Service
- 5.1.1. Domestic Transportation Management
- 5.1.2. International Transportation Management
- 5.1.3. Value-added Warehousing and Distribution
- 5.2. Market Analysis, Insights and Forecast - by End User
- 5.2.1. Automobile
- 5.2.2. Energy
- 5.2.3. Manufacturing
- 5.2.4. Life Science and Healthcare
- 5.2.5. Retail Technology
- 5.2.6. Other End Users
- 5.3. Market Analysis, Insights and Forecast - by Region
- 5.3.1. North America
- 5.3.2. South America
- 5.3.3. Asia Pacific
- 5.3.4. Middle East and Africa
- 5.3.5. Europe
- 5.1. Market Analysis, Insights and Forecast - by Service
- 6. 3PL Market Analysis, Insights and Forecast, 2021-2033
- 6.1. Market Analysis, Insights and Forecast - by Service
- 6.1.1. Domestic Transportation Management
- 6.1.2. International Transportation Management
- 6.1.3. Value-added Warehousing and Distribution
- 6.2. Market Analysis, Insights and Forecast - by End User
- 6.2.1. Automobile
- 6.2.2. Energy
- 6.2.3. Manufacturing
- 6.2.4. Life Science and Healthcare
- 6.2.5. Retail Technology
- 6.2.6. Other End Users
- 6.1. Market Analysis, Insights and Forecast - by Service
- 7. North America 3PL Market Analysis, Insights and Forecast, 2020-2032
- 7.1. Market Analysis, Insights and Forecast - by Service
- 7.1.1. Domestic Transportation Management
- 7.1.2. International Transportation Management
- 7.1.3. Value-added Warehousing and Distribution
- 7.2. Market Analysis, Insights and Forecast - by End User
- 7.2.1. Automobile
- 7.2.2. Energy
- 7.2.3. Manufacturing
- 7.2.4. Life Science and Healthcare
- 7.2.5. Retail Technology
- 7.2.6. Other End Users
- 7.1. Market Analysis, Insights and Forecast - by Service
- 8. South America 3PL Market Analysis, Insights and Forecast, 2020-2032
- 8.1. Market Analysis, Insights and Forecast - by Service
- 8.1.1. Domestic Transportation Management
- 8.1.2. International Transportation Management
- 8.1.3. Value-added Warehousing and Distribution
- 8.2. Market Analysis, Insights and Forecast - by End User
- 8.2.1. Automobile
- 8.2.2. Energy
- 8.2.3. Manufacturing
- 8.2.4. Life Science and Healthcare
- 8.2.5. Retail Technology
- 8.2.6. Other End Users
- 8.1. Market Analysis, Insights and Forecast - by Service
- 9. Asia Pacific 3PL Market Analysis, Insights and Forecast, 2020-2032
- 9.1. Market Analysis, Insights and Forecast - by Service
- 9.1.1. Domestic Transportation Management
- 9.1.2. International Transportation Management
- 9.1.3. Value-added Warehousing and Distribution
- 9.2. Market Analysis, Insights and Forecast - by End User
- 9.2.1. Automobile
- 9.2.2. Energy
- 9.2.3. Manufacturing
- 9.2.4. Life Science and Healthcare
- 9.2.5. Retail Technology
- 9.2.6. Other End Users
- 9.1. Market Analysis, Insights and Forecast - by Service
- 10. Middle East and Africa 3PL Market Analysis, Insights and Forecast, 2020-2032
- 10.1. Market Analysis, Insights and Forecast - by Service
- 10.1.1. Domestic Transportation Management
- 10.1.2. International Transportation Management
- 10.1.3. Value-added Warehousing and Distribution
- 10.2. Market Analysis, Insights and Forecast - by End User
- 10.2.1. Automobile
- 10.2.2. Energy
- 10.2.3. Manufacturing
- 10.2.4. Life Science and Healthcare
- 10.2.5. Retail Technology
- 10.2.6. Other End Users
- 10.1. Market Analysis, Insights and Forecast - by Service
- 11. Europe 3PL Market Analysis, Insights and Forecast, 2020-2032
- 11.1. Market Analysis, Insights and Forecast - by Service
- 11.1.1. Domestic Transportation Management
- 11.1.2. International Transportation Management
- 11.1.3. Value-added Warehousing and Distribution
- 11.2. Market Analysis, Insights and Forecast - by End User
- 11.2.1. Automobile
- 11.2.2. Energy
- 11.2.3. Manufacturing
- 11.2.4. Life Science and Healthcare
- 11.2.5. Retail Technology
- 11.2.6. Other End Users
- 11.1. Market Analysis, Insights and Forecast - by Service
- 12. Competitive Analysis
- 12.1. Company Profiles
- 12.1.1 DB Schenker
- 12.1.1.1. Company Overview
- 12.1.1.2. Products
- 12.1.1.3. Company Financials
- 12.1.1.4. SWOT Analysis
- 12.1.2 DHL
- 12.1.2.1. Company Overview
- 12.1.2.2. Products
- 12.1.2.3. Company Financials
- 12.1.2.4. SWOT Analysis
- 12.1.3 Ceva Logistics
- 12.1.3.1. Company Overview
- 12.1.3.2. Products
- 12.1.3.3. Company Financials
- 12.1.3.4. SWOT Analysis
- 12.1.4 FedEx Corporation
- 12.1.4.1. Company Overview
- 12.1.4.2. Products
- 12.1.4.3. Company Financials
- 12.1.4.4. SWOT Analysis
- 12.1.5 AmeriCold Logistics
- 12.1.5.1. Company Overview
- 12.1.5.2. Products
- 12.1.5.3. Company Financials
- 12.1.5.4. SWOT Analysis
- 12.1.6 Nippon Express
- 12.1.6.1. Company Overview
- 12.1.6.2. Products
- 12.1.6.3. Company Financials
- 12.1.6.4. SWOT Analysis
- 12.1.7 Yusen Logistics
- 12.1.7.1. Company Overview
- 12.1.7.2. Products
- 12.1.7.3. Company Financials
- 12.1.7.4. SWOT Analysis
- 12.1.8 CH Robinson
- 12.1.8.1. Company Overview
- 12.1.8.2. Products
- 12.1.8.3. Company Financials
- 12.1.8.4. SWOT Analysis
- 12.1.9 Agility Logistics
- 12.1.9.1. Company Overview
- 12.1.9.2. Products
- 12.1.9.3. Company Financials
- 12.1.9.4. SWOT Analysis
- 12.1.10 Kuehne+Nagel Inc
- 12.1.10.1. Company Overview
- 12.1.10.2. Products
- 12.1.10.3. Company Financials
- 12.1.10.4. SWOT Analysis
- 12.1.11 Kerry Logistics
- 12.1.11.1. Company Overview
- 12.1.11.2. Products
- 12.1.11.3. Company Financials
- 12.1.11.4. SWOT Analysis
- 12.1.12 Panalpina
- 12.1.12.1. Company Overview
- 12.1.12.2. Products
- 12.1.12.3. Company Financials
- 12.1.12.4. SWOT Analysis
- 12.1.13 MAERSK
- 12.1.13.1. Company Overview
- 12.1.13.2. Products
- 12.1.13.3. Company Financials
- 12.1.13.4. SWOT Analysis
- 12.1.14 Geodis**List Not Exhaustive
- 12.1.14.1. Company Overview
- 12.1.14.2. Products
- 12.1.14.3. Company Financials
- 12.1.14.4. SWOT Analysis
- 12.1.15 DSV
- 12.1.15.1. Company Overview
- 12.1.15.2. Products
- 12.1.15.3. Company Financials
- 12.1.15.4. SWOT Analysis
- 12.1.1 DB Schenker
- 12.2. Market Entropy
- 12.2.1 Company's Key Areas Served
- 12.2.2 Recent Developments
- 12.3. Company Market Share Analysis 2025
- 12.3.1 Top 5 Companies Market Share Analysis
- 12.3.2 Top 3 Companies Market Share Analysis
- 12.4. List of Potential Customers
- 13. Research Methodology
List of Figures
- Figure 1: 3PL Market Revenue Breakdown (Million, %) by Product 2025 & 2033
- Figure 2: 3PL Market Share (%) by Company 2025
List of Tables
- Table 1: 3PL Market Revenue Million Forecast, by Service 2020 & 2033
- Table 2: 3PL Market Revenue Million Forecast, by End User 2020 & 2033
- Table 3: 3PL Market Revenue Million Forecast, by Region 2020 & 2033
- Table 4: 3PL Market Revenue Million Forecast, by Service 2020 & 2033
- Table 5: 3PL Market Revenue Million Forecast, by End User 2020 & 2033
- Table 6: 3PL Market Revenue Million Forecast, by Country 2020 & 2033
- Table 7: United States 3PL Market Revenue (Million) Forecast, by Application 2020 & 2033
- Table 8: Canada 3PL Market Revenue (Million) Forecast, by Application 2020 & 2033
- Table 9: Mexico 3PL Market Revenue (Million) Forecast, by Application 2020 & 2033
- Table 10: 3PL Market Revenue Million Forecast, by Service 2020 & 2033
- Table 11: 3PL Market Revenue Million Forecast, by End User 2020 & 2033
- Table 12: 3PL Market Revenue Million Forecast, by Country 2020 & 2033
- Table 13: Brazil 3PL Market Revenue (Million) Forecast, by Application 2020 & 2033
- Table 14: Argentina 3PL Market Revenue (Million) Forecast, by Application 2020 & 2033
- Table 15: Rest of South America 3PL Market Revenue (Million) Forecast, by Application 2020 & 2033
- Table 16: 3PL Market Revenue Million Forecast, by Service 2020 & 2033
- Table 17: 3PL Market Revenue Million Forecast, by End User 2020 & 2033
- Table 18: 3PL Market Revenue Million Forecast, by Country 2020 & 2033
- Table 19: India 3PL Market Revenue (Million) Forecast, by Application 2020 & 2033
- Table 20: China 3PL Market Revenue (Million) Forecast, by Application 2020 & 2033
- Table 21: Singapore 3PL Market Revenue (Million) Forecast, by Application 2020 & 2033
- Table 22: Japan 3PL Market Revenue (Million) Forecast, by Application 2020 & 2033
- Table 23: South Korea 3PL Market Revenue (Million) Forecast, by Application 2020 & 2033
- Table 24: Vietnam 3PL Market Revenue (Million) Forecast, by Application 2020 & 2033
- Table 25: Australia 3PL Market Revenue (Million) Forecast, by Application 2020 & 2033
- Table 26: Rest of Asia Pacific 3PL Market Revenue (Million) Forecast, by Application 2020 & 2033
- Table 27: 3PL Market Revenue Million Forecast, by Service 2020 & 2033
- Table 28: 3PL Market Revenue Million Forecast, by End User 2020 & 2033
- Table 29: 3PL Market Revenue Million Forecast, by Country 2020 & 2033
- Table 30: South Africa 3PL Market Revenue (Million) Forecast, by Application 2020 & 2033
- Table 31: United Arab Emirates 3PL Market Revenue (Million) Forecast, by Application 2020 & 2033
- Table 32: Saudi Arabia 3PL Market Revenue (Million) Forecast, by Application 2020 & 2033
- Table 33: Egypt 3PL Market Revenue (Million) Forecast, by Application 2020 & 2033
- Table 34: Rest of Middle East and Africa 3PL Market Revenue (Million) Forecast, by Application 2020 & 2033
- Table 35: 3PL Market Revenue Million Forecast, by Service 2020 & 2033
- Table 36: 3PL Market Revenue Million Forecast, by End User 2020 & 2033
- Table 37: 3PL Market Revenue Million Forecast, by Country 2020 & 2033
- Table 38: Germany 3PL Market Revenue (Million) Forecast, by Application 2020 & 2033
- Table 39: Spain 3PL Market Revenue (Million) Forecast, by Application 2020 & 2033
- Table 40: France 3PL Market Revenue (Million) Forecast, by Application 2020 & 2033
- Table 41: Russia 3PL Market Revenue (Million) Forecast, by Application 2020 & 2033
- Table 42: United Kingdom 3PL Market Revenue (Million) Forecast, by Application 2020 & 2033
- Table 43: Rest of Europe 3PL Market Revenue (Million) Forecast, by Application 2020 & 2033
Frequently Asked Questions
1. What is the projected Compound Annual Growth Rate (CAGR) of the 3PL Market?
The projected CAGR is approximately 5.48%.
2. Which companies are prominent players in the 3PL Market?
Key companies in the market include DB Schenker, DHL, Ceva Logistics, FedEx Corporation, AmeriCold Logistics, Nippon Express, Yusen Logistics, CH Robinson, Agility Logistics, Kuehne+Nagel Inc, Kerry Logistics, Panalpina, MAERSK, Geodis**List Not Exhaustive, DSV.
3. What are the main segments of the 3PL Market?
The market segments include Service, End User.
4. Can you provide details about the market size?
The market size is estimated to be USD 1.29 Million as of 2022.
5. What are some drivers contributing to market growth?
4.; Increasing volume of international trade4.; The rise of trade agreements between nations.
6. What are the notable trends driving market growth?
Growth in E-commerce Sales Driving the Market.
7. Are there any restraints impacting market growth?
4.; Surge in fuel costs affecting the market4.; Increasing trade tension.
8. Can you provide examples of recent developments in the market?
Dec 2022: SEKO Logistics established its first robotics partnership, with plans to "scale up" warehouse operations with GreyOrange's Ranger Assist Bots. SEKO will deploy 15 bots in one of its Milton Keynes, UK, during the first stage of the plan. Another 35 robots will be installed early next year. The logistics company intends to expand the bot initiative beyond the UK next year, with the Netherlands as the first location.
9. What pricing options are available for accessing the report?
Pricing options include single-user, multi-user, and enterprise licenses priced at USD 3800, USD 4500, and USD 5800 respectively.
10. Is the market size provided in terms of value or volume?
The market size is provided in terms of value, measured in Million.
11. Are there any specific market keywords associated with the report?
Yes, the market keyword associated with the report is "3PL Market," which aids in identifying and referencing the specific market segment covered.
12. How do I determine which pricing option suits my needs best?
The pricing options vary based on user requirements and access needs. Individual users may opt for single-user licenses, while businesses requiring broader access may choose multi-user or enterprise licenses for cost-effective access to the report.
13. Are there any additional resources or data provided in the 3PL Market report?
While the report offers comprehensive insights, it's advisable to review the specific contents or supplementary materials provided to ascertain if additional resources or data are available.
14. How can I stay updated on further developments or reports in the 3PL Market?
To stay informed about further developments, trends, and reports in the 3PL Market, consider subscribing to industry newsletters, following relevant companies and organizations, or regularly checking reputable industry news sources and publications.
Methodology
Step 1 - Identification of Relevant Samples Size from Population Database


Step 2 - Approaches for Defining Global Market Size (Value, Volume* & Price*)

Note*: In applicable scenarios
Step 3 - Data Sources
Primary Research
- Web Analytics
- Survey Reports
- Research Institute
- Latest Research Reports
- Opinion Leaders
Secondary Research
- Annual Reports
- White Paper
- Latest Press Release
- Industry Association
- Paid Database
- Investor Presentations

Step 4 - Data Triangulation
Involves using different sources of information in order to increase the validity of a study
These sources are likely to be stakeholders in a program - participants, other researchers, program staff, other community members, and so on.
Then we put all data in single framework & apply various statistical tools to find out the dynamic on the market.
During the analysis stage, feedback from the stakeholder groups would be compared to determine areas of agreement as well as areas of divergence