

Key Insights
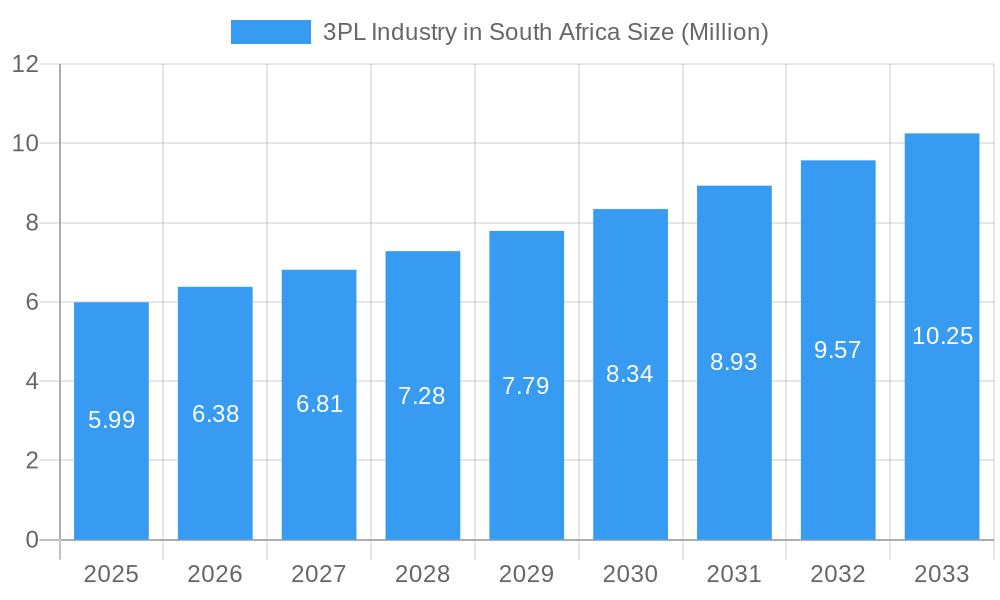
The South African 3PL (Third-Party Logistics) industry, valued at $5.99 million in 2025, is poised for significant growth, projected to expand at a Compound Annual Growth Rate (CAGR) of 6.64% from 2025 to 2033. This expansion is fueled by several key drivers. The burgeoning e-commerce sector in South Africa is creating a surge in demand for efficient warehousing, distribution, and last-mile delivery solutions. Furthermore, the increasing complexity of global supply chains is prompting businesses to outsource logistics operations to specialized 3PL providers, leveraging their expertise in transportation management (both domestic and international), value-added warehousing, and distribution. The manufacturing and automotive sectors, as well as the oil & gas, chemicals, and pharmaceutical industries, are major contributors to this market growth, relying on 3PLs for optimized supply chain management and cost reduction. While the industry faces challenges such as infrastructure limitations and fluctuating fuel prices, the overall outlook remains positive, driven by technological advancements, such as the implementation of advanced logistics software and the integration of automation technologies into warehousing operations. This will increase efficiency and reduce operational costs, further strengthening the appeal of outsourcing logistics. The competitive landscape is marked by both international giants like DHL and Kuehne + Nagel, and established local players like Bidvest International Logistics and Transnova, indicating a robust and diverse market.
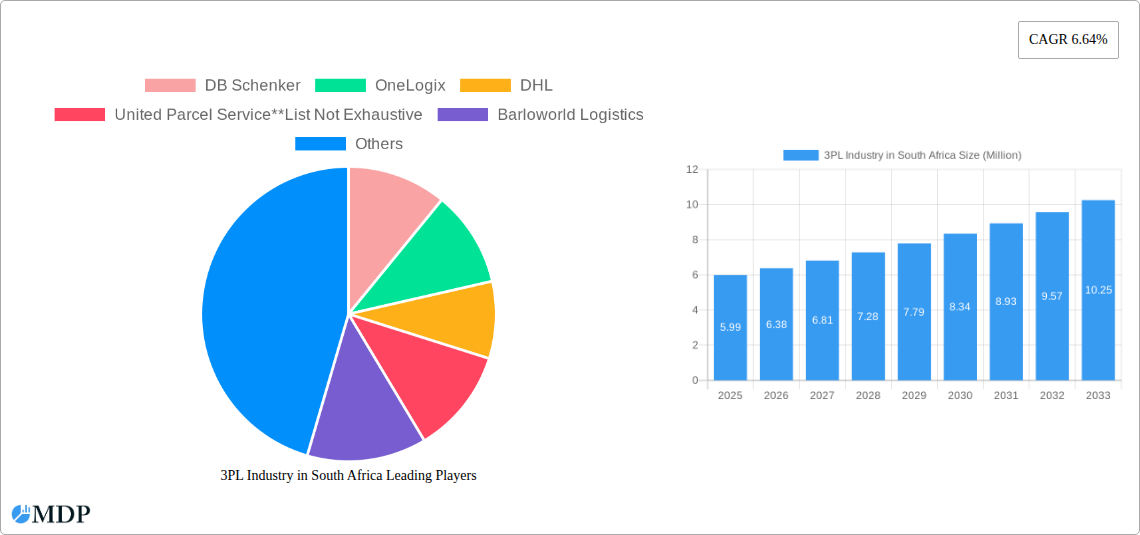
3PL Industry in South Africa Market Size (In Million)
The growth trajectory for the South African 3PL market is expected to continue throughout the forecast period. Growth will be particularly pronounced in segments such as value-added warehousing and distribution, catering to the needs of e-commerce businesses requiring specialized services like order fulfillment and inventory management. International transportation management is also anticipated to witness substantial growth due to South Africa’s increasing participation in global trade. Regional variations within the South African market may exist, with metropolitan areas exhibiting stronger growth compared to more rural regions due to higher concentrations of businesses and consumers. However, ongoing investment in infrastructure and the expansion of logistics networks are expected to mitigate these regional disparities. The increasing adoption of sustainable logistics practices, driven by environmental concerns, will also shape the industry’s future, favoring 3PL providers who prioritize green initiatives.
3PL Industry in South Africa Company Market Share
South Africa 3PL Industry Report: 2019-2033 – Market Size, Share, Trends, and Forecast
This comprehensive report provides an in-depth analysis of the South African 3PL (Third-Party Logistics) industry, covering market dynamics, leading players, and future growth prospects. The study period spans from 2019 to 2033, with a base year of 2025 and a forecast period from 2025 to 2033. This report is essential for industry stakeholders, investors, and businesses seeking to understand the opportunities and challenges within this rapidly evolving sector. The South African 3PL market, valued at ZAR xx Million in 2025, is poised for significant growth, driven by factors such as e-commerce expansion, technological advancements, and increasing demand for efficient supply chain solutions. Key players like DB Schenker, OneLogix, DHL, and United Parcel Service (among many others) are shaping the competitive landscape. Download this report to gain actionable insights and strategic advantages.
3PL Industry in South Africa Market Dynamics & Concentration
The South African 3PL market exhibits a moderately concentrated structure, with a few major players holding significant market share. However, a considerable number of smaller, specialized 3PL providers also contribute to the overall market volume. The market's dynamics are significantly shaped by several factors:
- Market Concentration: The top 5 players collectively hold an estimated xx% market share in 2025, with DB Schenker, DHL, and Kuehne + Nagel among the leading companies. Smaller players focus on niche segments or regional markets.
- Innovation Drivers: Technological advancements, such as warehouse management systems (WMS), transportation management systems (TMS), and blockchain technology, are driving innovation and efficiency improvements within the industry.
- Regulatory Frameworks: Government regulations concerning transportation, warehousing, and customs compliance impact the operational costs and strategies of 3PL providers. Changes in these regulations influence market dynamics.
- Product Substitutes: While direct substitutes are limited, internalization of logistics functions by large companies can be considered a substitute, though it often proves less efficient in the long run.
- End-User Trends: The growth of e-commerce and the increasing demand for faster delivery times are major drivers of growth in the 3PL sector, pushing providers to enhance their capabilities.
- M&A Activities: The number of mergers and acquisitions (M&A) in the South African 3PL industry has shown a steady increase over the past few years, with an estimated xx deals recorded between 2019 and 2024. This trend is expected to continue as larger companies seek to expand their market share and service offerings.
3PL Industry in South Africa Industry Trends & Analysis
The South African 3PL market is experiencing robust growth, driven by several key trends:
The market exhibited a Compound Annual Growth Rate (CAGR) of xx% during the historical period (2019-2024) and is projected to maintain a CAGR of xx% during the forecast period (2025-2033). This growth is fueled by:
- Expanding E-commerce: The burgeoning e-commerce sector necessitates efficient and reliable logistics solutions, significantly boosting demand for 3PL services. Market penetration of e-commerce logistics by 3PL providers stands at approximately xx% in 2025.
- Technological Disruptions: The adoption of advanced technologies, such as AI, machine learning, and IoT, is streamlining operations, improving efficiency, and enhancing visibility across the supply chain.
- Consumer Preferences: Consumers increasingly demand faster, more reliable, and transparent delivery services, placing pressure on 3PL providers to adapt and innovate.
- Competitive Dynamics: The market is characterized by intense competition, with both established players and new entrants vying for market share. This competition drives innovation and efficiency improvements, ultimately benefiting consumers. This also results in competitive pricing strategies and a wide variety of service offerings.
Leading Markets & Segments in 3PL Industry in South Africa
The South African 3PL market is geographically diverse, with significant activity across major urban centers. However, Gauteng province remains the dominant region due to its economic strength and central location. In terms of segments:
By Service:
- Domestic Transportation Management: This segment holds the largest share, fueled by the growth of domestic trade and e-commerce. Key drivers include improved road infrastructure and the increasing demand for efficient last-mile delivery solutions.
- International Transportation Management: This segment is experiencing moderate growth, driven by South Africa's participation in global trade. However, challenges related to customs procedures and port congestion can influence its growth rate.
- Value-added Warehousing and Distribution: This segment is experiencing strong growth due to the rising demand for specialized warehousing services, including inventory management, order fulfillment, and value-added services like kitting and labeling.
By End-User:
- Manufacturing & Automotive: This segment is a major driver of demand for 3PL services, with automotive manufacturing plants relying heavily on just-in-time delivery systems.
- Distributive Trade (Wholesale and Retail trade including e-commerce): The explosive growth of e-commerce is significantly driving demand within this segment, requiring sophisticated warehousing and delivery networks.
- Pharma & Healthcare: The strict regulations and temperature-sensitive nature of pharmaceutical products necessitate specialized 3PL providers with expertise in cold chain logistics. This is a high-growth segment with stringent requirements.
- Oil & Gas and Chemicals: This segment requires specialized handling and transportation expertise due to the hazardous nature of the products. Demand is moderately steady, influenced by global energy markets.
Other end-user segments, including construction and other sectors, contribute to the overall market but hold a smaller market share compared to the dominant segments listed above.
3PL Industry in South Africa Product Developments
Recent product innovations in the South African 3PL industry center on technological advancements. WMS and TMS are becoming increasingly sophisticated, incorporating AI and machine learning to optimize warehouse operations and route planning. Blockchain technology is being explored to enhance supply chain transparency and traceability. These technological advancements provide competitive advantages by improving efficiency, reducing costs, and enhancing customer satisfaction. The market is seeing a strong push for customized solutions tailored to specific industry needs.
Key Drivers of 3PL Industry in South Africa Growth
Several factors are driving the growth of the South African 3PL industry:
- E-commerce boom: The rapid expansion of online retail requires efficient logistics solutions, boosting demand for 3PL services.
- Technological advancements: The adoption of sophisticated technologies like AI and IoT streamlines operations and enhances efficiency.
- Government initiatives: Pro-business policies and investments in infrastructure development create a more favorable environment for the 3PL sector.
Challenges in the 3PL Industry in South Africa Market
The South African 3PL industry faces several challenges:
- Infrastructure limitations: Inefficient infrastructure, including port congestion and inadequate road networks, pose significant operational challenges.
- Skills shortage: A lack of skilled labor in logistics and related fields hampers efficient operations and expansion.
- High operational costs: Factors such as fuel costs, labor expenses, and regulatory compliance contribute to high operating costs, impacting profitability. These costs represent an estimated xx% increase over the past 5 years.
Emerging Opportunities in 3PL Industry in South Africa
The South African 3PL sector presents significant long-term growth opportunities:
- Expansion into emerging markets: The growing middle class in Africa presents opportunities for expansion into neighboring countries.
- Strategic partnerships: Collaboration with technology providers can enhance capabilities and deliver innovative solutions.
- Value-added services: Providing specialized services like cold chain logistics and reverse logistics can increase revenue streams.
Leading Players in the 3PL Industry in South Africa Sector
- DB Schenker
- OneLogix
- DHL
- United Parcel Service
- Barloworld Logistics
- Vital Distribution
- CEVA Logistics
- Kuehne + Nagel
- Transnova
- Bidvest International Logistics
- Bollore Logistics
- DPD Laser Express Logistics
- Value Logistics
- DSV
- City Logistics
Key Milestones in 3PL Industry in South Africa Industry
- 2020: Increased adoption of WMS and TMS by major 3PL providers.
- 2022: Several key mergers and acquisitions consolidate market share among leading players.
- 2023: Launch of several new e-commerce-focused 3PL services.
- 2024: Significant investment in cold chain logistics infrastructure by leading players.
Strategic Outlook for 3PL Industry in South Africa Market
The South African 3PL market is poised for continued growth, driven by e-commerce expansion, technological advancements, and increasing demand for efficient supply chain solutions. Strategic partnerships, investments in technology, and expansion into adjacent markets represent key opportunities for sustained success. The market's future trajectory will be shaped by addressing infrastructure limitations and fostering a skilled workforce. Further M&A activity is expected to reshape the competitive landscape in the coming years.
3PL Industry in South Africa Segmentation
-
1. Service
- 1.1. Domestic Transportation Management
- 1.2. International Transportation Management
- 1.3. Value-added Warehousing and Distribution
-
2. End-User
- 2.1. Manufacturing & Automotive
- 2.2. Oil & Gas and Chemicals
- 2.3. Distribu
- 2.4. Pharma & Healthcare
- 2.5. Construction
- 2.6. Other End Users
3PL Industry in South Africa Segmentation By Geography
-
1. North America
- 1.1. United States
- 1.2. Canada
- 1.3. Mexico
-
2. South America
- 2.1. Brazil
- 2.2. Argentina
- 2.3. Rest of South America
-
3. Europe
- 3.1. United Kingdom
- 3.2. Germany
- 3.3. France
- 3.4. Italy
- 3.5. Spain
- 3.6. Russia
- 3.7. Benelux
- 3.8. Nordics
- 3.9. Rest of Europe
-
4. Middle East & Africa
- 4.1. Turkey
- 4.2. Israel
- 4.3. GCC
- 4.4. North Africa
- 4.5. South Africa
- 4.6. Rest of Middle East & Africa
-
5. Asia Pacific
- 5.1. China
- 5.2. India
- 5.3. Japan
- 5.4. South Korea
- 5.5. ASEAN
- 5.6. Oceania
- 5.7. Rest of Asia Pacific
3PL Industry in South Africa Regional Market Share
Geographic Coverage of 3PL Industry in South Africa
3PL Industry in South Africa REPORT HIGHLIGHTS
| Aspects | Details |
|---|---|
| Study Period | 2020-2034 |
| Base Year | 2025 |
| Estimated Year | 2026 |
| Forecast Period | 2026-2034 |
| Historical Period | 2020-2025 |
| Growth Rate | CAGR of 6.64% from 2020-2034 |
| Segmentation |
|
Table of Contents
- 1. Introduction
- 1.1. Research Scope
- 1.2. Market Segmentation
- 1.3. Research Objective
- 1.4. Definitions and Assumptions
- 2. Executive Summary
- 2.1. Market Snapshot
- 3. Market Dynamics
- 3.1. Market Drivers
- 3.2. Market Restrains
- 3.3. Market Trends
- 3.4. Market Opportunities
- 4. Market Factor Analysis
- 4.1. Porters Five Forces
- 4.1.1. Bargaining Power of Suppliers
- 4.1.2. Bargaining Power of Buyers
- 4.1.3. Threat of New Entrants
- 4.1.4. Threat of Substitutes
- 4.1.5. Competitive Rivalry
- 4.2. PESTEL analysis
- 4.3. BCG Analysis
- 4.3.1. Stars (High Growth, High Market Share)
- 4.3.2. Cash Cows (Low Growth, High Market Share)
- 4.3.3. Question Mark (High Growth, Low Market Share)
- 4.3.4. Dogs (Low Growth, Low Market Share)
- 4.4. Ansoff Matrix Analysis
- 4.5. Supply Chain Analysis
- 4.6. Regulatory Landscape
- 4.7. Current Market Potential and Opportunity Assessment (TAM–SAM–SOM Framework)
- 4.8. MDP Analyst Note
- 4.1. Porters Five Forces
- 5. Market Analysis, Insights and Forecast 2021-2033
- 5.1. Market Analysis, Insights and Forecast - by Service
- 5.1.1. Domestic Transportation Management
- 5.1.2. International Transportation Management
- 5.1.3. Value-added Warehousing and Distribution
- 5.2. Market Analysis, Insights and Forecast - by End-User
- 5.2.1. Manufacturing & Automotive
- 5.2.2. Oil & Gas and Chemicals
- 5.2.3. Distribu
- 5.2.4. Pharma & Healthcare
- 5.2.5. Construction
- 5.2.6. Other End Users
- 5.3. Market Analysis, Insights and Forecast - by Region
- 5.3.1. North America
- 5.3.2. South America
- 5.3.3. Europe
- 5.3.4. Middle East & Africa
- 5.3.5. Asia Pacific
- 5.1. Market Analysis, Insights and Forecast - by Service
- 6. Global 3PL Industry in South Africa Analysis, Insights and Forecast, 2021-2033
- 6.1. Market Analysis, Insights and Forecast - by Service
- 6.1.1. Domestic Transportation Management
- 6.1.2. International Transportation Management
- 6.1.3. Value-added Warehousing and Distribution
- 6.2. Market Analysis, Insights and Forecast - by End-User
- 6.2.1. Manufacturing & Automotive
- 6.2.2. Oil & Gas and Chemicals
- 6.2.3. Distribu
- 6.2.4. Pharma & Healthcare
- 6.2.5. Construction
- 6.2.6. Other End Users
- 6.1. Market Analysis, Insights and Forecast - by Service
- 7. North America 3PL Industry in South Africa Analysis, Insights and Forecast, 2020-2032
- 7.1. Market Analysis, Insights and Forecast - by Service
- 7.1.1. Domestic Transportation Management
- 7.1.2. International Transportation Management
- 7.1.3. Value-added Warehousing and Distribution
- 7.2. Market Analysis, Insights and Forecast - by End-User
- 7.2.1. Manufacturing & Automotive
- 7.2.2. Oil & Gas and Chemicals
- 7.2.3. Distribu
- 7.2.4. Pharma & Healthcare
- 7.2.5. Construction
- 7.2.6. Other End Users
- 7.1. Market Analysis, Insights and Forecast - by Service
- 8. South America 3PL Industry in South Africa Analysis, Insights and Forecast, 2020-2032
- 8.1. Market Analysis, Insights and Forecast - by Service
- 8.1.1. Domestic Transportation Management
- 8.1.2. International Transportation Management
- 8.1.3. Value-added Warehousing and Distribution
- 8.2. Market Analysis, Insights and Forecast - by End-User
- 8.2.1. Manufacturing & Automotive
- 8.2.2. Oil & Gas and Chemicals
- 8.2.3. Distribu
- 8.2.4. Pharma & Healthcare
- 8.2.5. Construction
- 8.2.6. Other End Users
- 8.1. Market Analysis, Insights and Forecast - by Service
- 9. Europe 3PL Industry in South Africa Analysis, Insights and Forecast, 2020-2032
- 9.1. Market Analysis, Insights and Forecast - by Service
- 9.1.1. Domestic Transportation Management
- 9.1.2. International Transportation Management
- 9.1.3. Value-added Warehousing and Distribution
- 9.2. Market Analysis, Insights and Forecast - by End-User
- 9.2.1. Manufacturing & Automotive
- 9.2.2. Oil & Gas and Chemicals
- 9.2.3. Distribu
- 9.2.4. Pharma & Healthcare
- 9.2.5. Construction
- 9.2.6. Other End Users
- 9.1. Market Analysis, Insights and Forecast - by Service
- 10. Middle East & Africa 3PL Industry in South Africa Analysis, Insights and Forecast, 2020-2032
- 10.1. Market Analysis, Insights and Forecast - by Service
- 10.1.1. Domestic Transportation Management
- 10.1.2. International Transportation Management
- 10.1.3. Value-added Warehousing and Distribution
- 10.2. Market Analysis, Insights and Forecast - by End-User
- 10.2.1. Manufacturing & Automotive
- 10.2.2. Oil & Gas and Chemicals
- 10.2.3. Distribu
- 10.2.4. Pharma & Healthcare
- 10.2.5. Construction
- 10.2.6. Other End Users
- 10.1. Market Analysis, Insights and Forecast - by Service
- 11. Asia Pacific 3PL Industry in South Africa Analysis, Insights and Forecast, 2020-2032
- 11.1. Market Analysis, Insights and Forecast - by Service
- 11.1.1. Domestic Transportation Management
- 11.1.2. International Transportation Management
- 11.1.3. Value-added Warehousing and Distribution
- 11.2. Market Analysis, Insights and Forecast - by End-User
- 11.2.1. Manufacturing & Automotive
- 11.2.2. Oil & Gas and Chemicals
- 11.2.3. Distribu
- 11.2.4. Pharma & Healthcare
- 11.2.5. Construction
- 11.2.6. Other End Users
- 11.1. Market Analysis, Insights and Forecast - by Service
- 12. Competitive Analysis
- 12.1. Company Profiles
- 12.1.1 DB Schenker
- 12.1.1.1. Company Overview
- 12.1.1.2. Products
- 12.1.1.3. Company Financials
- 12.1.1.4. SWOT Analysis
- 12.1.2 OneLogix
- 12.1.2.1. Company Overview
- 12.1.2.2. Products
- 12.1.2.3. Company Financials
- 12.1.2.4. SWOT Analysis
- 12.1.3 DHL
- 12.1.3.1. Company Overview
- 12.1.3.2. Products
- 12.1.3.3. Company Financials
- 12.1.3.4. SWOT Analysis
- 12.1.4 United Parcel Service**List Not Exhaustive
- 12.1.4.1. Company Overview
- 12.1.4.2. Products
- 12.1.4.3. Company Financials
- 12.1.4.4. SWOT Analysis
- 12.1.5 Barloworld Logistics
- 12.1.5.1. Company Overview
- 12.1.5.2. Products
- 12.1.5.3. Company Financials
- 12.1.5.4. SWOT Analysis
- 12.1.6 Vital Distribution
- 12.1.6.1. Company Overview
- 12.1.6.2. Products
- 12.1.6.3. Company Financials
- 12.1.6.4. SWOT Analysis
- 12.1.7 CEVA Logistics
- 12.1.7.1. Company Overview
- 12.1.7.2. Products
- 12.1.7.3. Company Financials
- 12.1.7.4. SWOT Analysis
- 12.1.8 Kuehne + Nagel
- 12.1.8.1. Company Overview
- 12.1.8.2. Products
- 12.1.8.3. Company Financials
- 12.1.8.4. SWOT Analysis
- 12.1.9 Transnova
- 12.1.9.1. Company Overview
- 12.1.9.2. Products
- 12.1.9.3. Company Financials
- 12.1.9.4. SWOT Analysis
- 12.1.10 Bidvest International Logistics
- 12.1.10.1. Company Overview
- 12.1.10.2. Products
- 12.1.10.3. Company Financials
- 12.1.10.4. SWOT Analysis
- 12.1.11 Bollore Logistics
- 12.1.11.1. Company Overview
- 12.1.11.2. Products
- 12.1.11.3. Company Financials
- 12.1.11.4. SWOT Analysis
- 12.1.12 DPD Laser Express Logistics
- 12.1.12.1. Company Overview
- 12.1.12.2. Products
- 12.1.12.3. Company Financials
- 12.1.12.4. SWOT Analysis
- 12.1.13 Value Logistics
- 12.1.13.1. Company Overview
- 12.1.13.2. Products
- 12.1.13.3. Company Financials
- 12.1.13.4. SWOT Analysis
- 12.1.14 DSV
- 12.1.14.1. Company Overview
- 12.1.14.2. Products
- 12.1.14.3. Company Financials
- 12.1.14.4. SWOT Analysis
- 12.1.15 City Logistics
- 12.1.15.1. Company Overview
- 12.1.15.2. Products
- 12.1.15.3. Company Financials
- 12.1.15.4. SWOT Analysis
- 12.1.1 DB Schenker
- 12.2. Market Entropy
- 12.2.1 Company's Key Areas Served
- 12.2.2 Recent Developments
- 12.3. Company Market Share Analysis 2025
- 12.3.1 Top 5 Companies Market Share Analysis
- 12.3.2 Top 3 Companies Market Share Analysis
- 12.4. List of Potential Customers
- 13. Research Methodology
List of Figures
- Figure 1: Global 3PL Industry in South Africa Revenue Breakdown (Million, %) by Region 2025 & 2033
- Figure 2: North America 3PL Industry in South Africa Revenue (Million), by Service 2025 & 2033
- Figure 3: North America 3PL Industry in South Africa Revenue Share (%), by Service 2025 & 2033
- Figure 4: North America 3PL Industry in South Africa Revenue (Million), by End-User 2025 & 2033
- Figure 5: North America 3PL Industry in South Africa Revenue Share (%), by End-User 2025 & 2033
- Figure 6: North America 3PL Industry in South Africa Revenue (Million), by Country 2025 & 2033
- Figure 7: North America 3PL Industry in South Africa Revenue Share (%), by Country 2025 & 2033
- Figure 8: South America 3PL Industry in South Africa Revenue (Million), by Service 2025 & 2033
- Figure 9: South America 3PL Industry in South Africa Revenue Share (%), by Service 2025 & 2033
- Figure 10: South America 3PL Industry in South Africa Revenue (Million), by End-User 2025 & 2033
- Figure 11: South America 3PL Industry in South Africa Revenue Share (%), by End-User 2025 & 2033
- Figure 12: South America 3PL Industry in South Africa Revenue (Million), by Country 2025 & 2033
- Figure 13: South America 3PL Industry in South Africa Revenue Share (%), by Country 2025 & 2033
- Figure 14: Europe 3PL Industry in South Africa Revenue (Million), by Service 2025 & 2033
- Figure 15: Europe 3PL Industry in South Africa Revenue Share (%), by Service 2025 & 2033
- Figure 16: Europe 3PL Industry in South Africa Revenue (Million), by End-User 2025 & 2033
- Figure 17: Europe 3PL Industry in South Africa Revenue Share (%), by End-User 2025 & 2033
- Figure 18: Europe 3PL Industry in South Africa Revenue (Million), by Country 2025 & 2033
- Figure 19: Europe 3PL Industry in South Africa Revenue Share (%), by Country 2025 & 2033
- Figure 20: Middle East & Africa 3PL Industry in South Africa Revenue (Million), by Service 2025 & 2033
- Figure 21: Middle East & Africa 3PL Industry in South Africa Revenue Share (%), by Service 2025 & 2033
- Figure 22: Middle East & Africa 3PL Industry in South Africa Revenue (Million), by End-User 2025 & 2033
- Figure 23: Middle East & Africa 3PL Industry in South Africa Revenue Share (%), by End-User 2025 & 2033
- Figure 24: Middle East & Africa 3PL Industry in South Africa Revenue (Million), by Country 2025 & 2033
- Figure 25: Middle East & Africa 3PL Industry in South Africa Revenue Share (%), by Country 2025 & 2033
- Figure 26: Asia Pacific 3PL Industry in South Africa Revenue (Million), by Service 2025 & 2033
- Figure 27: Asia Pacific 3PL Industry in South Africa Revenue Share (%), by Service 2025 & 2033
- Figure 28: Asia Pacific 3PL Industry in South Africa Revenue (Million), by End-User 2025 & 2033
- Figure 29: Asia Pacific 3PL Industry in South Africa Revenue Share (%), by End-User 2025 & 2033
- Figure 30: Asia Pacific 3PL Industry in South Africa Revenue (Million), by Country 2025 & 2033
- Figure 31: Asia Pacific 3PL Industry in South Africa Revenue Share (%), by Country 2025 & 2033
List of Tables
- Table 1: Global 3PL Industry in South Africa Revenue Million Forecast, by Service 2020 & 2033
- Table 2: Global 3PL Industry in South Africa Revenue Million Forecast, by End-User 2020 & 2033
- Table 3: Global 3PL Industry in South Africa Revenue Million Forecast, by Region 2020 & 2033
- Table 4: Global 3PL Industry in South Africa Revenue Million Forecast, by Service 2020 & 2033
- Table 5: Global 3PL Industry in South Africa Revenue Million Forecast, by End-User 2020 & 2033
- Table 6: Global 3PL Industry in South Africa Revenue Million Forecast, by Country 2020 & 2033
- Table 7: United States 3PL Industry in South Africa Revenue (Million) Forecast, by Application 2020 & 2033
- Table 8: Canada 3PL Industry in South Africa Revenue (Million) Forecast, by Application 2020 & 2033
- Table 9: Mexico 3PL Industry in South Africa Revenue (Million) Forecast, by Application 2020 & 2033
- Table 10: Global 3PL Industry in South Africa Revenue Million Forecast, by Service 2020 & 2033
- Table 11: Global 3PL Industry in South Africa Revenue Million Forecast, by End-User 2020 & 2033
- Table 12: Global 3PL Industry in South Africa Revenue Million Forecast, by Country 2020 & 2033
- Table 13: Brazil 3PL Industry in South Africa Revenue (Million) Forecast, by Application 2020 & 2033
- Table 14: Argentina 3PL Industry in South Africa Revenue (Million) Forecast, by Application 2020 & 2033
- Table 15: Rest of South America 3PL Industry in South Africa Revenue (Million) Forecast, by Application 2020 & 2033
- Table 16: Global 3PL Industry in South Africa Revenue Million Forecast, by Service 2020 & 2033
- Table 17: Global 3PL Industry in South Africa Revenue Million Forecast, by End-User 2020 & 2033
- Table 18: Global 3PL Industry in South Africa Revenue Million Forecast, by Country 2020 & 2033
- Table 19: United Kingdom 3PL Industry in South Africa Revenue (Million) Forecast, by Application 2020 & 2033
- Table 20: Germany 3PL Industry in South Africa Revenue (Million) Forecast, by Application 2020 & 2033
- Table 21: France 3PL Industry in South Africa Revenue (Million) Forecast, by Application 2020 & 2033
- Table 22: Italy 3PL Industry in South Africa Revenue (Million) Forecast, by Application 2020 & 2033
- Table 23: Spain 3PL Industry in South Africa Revenue (Million) Forecast, by Application 2020 & 2033
- Table 24: Russia 3PL Industry in South Africa Revenue (Million) Forecast, by Application 2020 & 2033
- Table 25: Benelux 3PL Industry in South Africa Revenue (Million) Forecast, by Application 2020 & 2033
- Table 26: Nordics 3PL Industry in South Africa Revenue (Million) Forecast, by Application 2020 & 2033
- Table 27: Rest of Europe 3PL Industry in South Africa Revenue (Million) Forecast, by Application 2020 & 2033
- Table 28: Global 3PL Industry in South Africa Revenue Million Forecast, by Service 2020 & 2033
- Table 29: Global 3PL Industry in South Africa Revenue Million Forecast, by End-User 2020 & 2033
- Table 30: Global 3PL Industry in South Africa Revenue Million Forecast, by Country 2020 & 2033
- Table 31: Turkey 3PL Industry in South Africa Revenue (Million) Forecast, by Application 2020 & 2033
- Table 32: Israel 3PL Industry in South Africa Revenue (Million) Forecast, by Application 2020 & 2033
- Table 33: GCC 3PL Industry in South Africa Revenue (Million) Forecast, by Application 2020 & 2033
- Table 34: North Africa 3PL Industry in South Africa Revenue (Million) Forecast, by Application 2020 & 2033
- Table 35: South Africa 3PL Industry in South Africa Revenue (Million) Forecast, by Application 2020 & 2033
- Table 36: Rest of Middle East & Africa 3PL Industry in South Africa Revenue (Million) Forecast, by Application 2020 & 2033
- Table 37: Global 3PL Industry in South Africa Revenue Million Forecast, by Service 2020 & 2033
- Table 38: Global 3PL Industry in South Africa Revenue Million Forecast, by End-User 2020 & 2033
- Table 39: Global 3PL Industry in South Africa Revenue Million Forecast, by Country 2020 & 2033
- Table 40: China 3PL Industry in South Africa Revenue (Million) Forecast, by Application 2020 & 2033
- Table 41: India 3PL Industry in South Africa Revenue (Million) Forecast, by Application 2020 & 2033
- Table 42: Japan 3PL Industry in South Africa Revenue (Million) Forecast, by Application 2020 & 2033
- Table 43: South Korea 3PL Industry in South Africa Revenue (Million) Forecast, by Application 2020 & 2033
- Table 44: ASEAN 3PL Industry in South Africa Revenue (Million) Forecast, by Application 2020 & 2033
- Table 45: Oceania 3PL Industry in South Africa Revenue (Million) Forecast, by Application 2020 & 2033
- Table 46: Rest of Asia Pacific 3PL Industry in South Africa Revenue (Million) Forecast, by Application 2020 & 2033
Frequently Asked Questions
1. What is the projected Compound Annual Growth Rate (CAGR) of the 3PL Industry in South Africa?
The projected CAGR is approximately 6.64%.
2. Which companies are prominent players in the 3PL Industry in South Africa?
Key companies in the market include DB Schenker, OneLogix, DHL, United Parcel Service**List Not Exhaustive, Barloworld Logistics, Vital Distribution, CEVA Logistics, Kuehne + Nagel, Transnova, Bidvest International Logistics, Bollore Logistics, DPD Laser Express Logistics, Value Logistics, DSV, City Logistics.
3. What are the main segments of the 3PL Industry in South Africa?
The market segments include Service, End-User.
4. Can you provide details about the market size?
The market size is estimated to be USD 5.99 Million as of 2022.
5. What are some drivers contributing to market growth?
E-commerce Fueling the Growth of 3PL Market.
6. What are the notable trends driving market growth?
AfCFTA to Increase Intra Regional Trade.
7. Are there any restraints impacting market growth?
Slow Infrastructure Development.
8. Can you provide examples of recent developments in the market?
N/A
9. What pricing options are available for accessing the report?
Pricing options include single-user, multi-user, and enterprise licenses priced at USD 3800, USD 4500, and USD 5800 respectively.
10. Is the market size provided in terms of value or volume?
The market size is provided in terms of value, measured in Million.
11. Are there any specific market keywords associated with the report?
Yes, the market keyword associated with the report is "3PL Industry in South Africa," which aids in identifying and referencing the specific market segment covered.
12. How do I determine which pricing option suits my needs best?
The pricing options vary based on user requirements and access needs. Individual users may opt for single-user licenses, while businesses requiring broader access may choose multi-user or enterprise licenses for cost-effective access to the report.
13. Are there any additional resources or data provided in the 3PL Industry in South Africa report?
While the report offers comprehensive insights, it's advisable to review the specific contents or supplementary materials provided to ascertain if additional resources or data are available.
14. How can I stay updated on further developments or reports in the 3PL Industry in South Africa?
To stay informed about further developments, trends, and reports in the 3PL Industry in South Africa, consider subscribing to industry newsletters, following relevant companies and organizations, or regularly checking reputable industry news sources and publications.
Methodology
Step 1 - Identification of Relevant Samples Size from Population Database


Step 2 - Approaches for Defining Global Market Size (Value, Volume* & Price*)

Note*: In applicable scenarios
Step 3 - Data Sources
Primary Research
- Web Analytics
- Survey Reports
- Research Institute
- Latest Research Reports
- Opinion Leaders
Secondary Research
- Annual Reports
- White Paper
- Latest Press Release
- Industry Association
- Paid Database
- Investor Presentations

Step 4 - Data Triangulation
Involves using different sources of information in order to increase the validity of a study
These sources are likely to be stakeholders in a program - participants, other researchers, program staff, other community members, and so on.
Then we put all data in single framework & apply various statistical tools to find out the dynamic on the market.
During the analysis stage, feedback from the stakeholder groups would be compared to determine areas of agreement as well as areas of divergence