

Key Insights
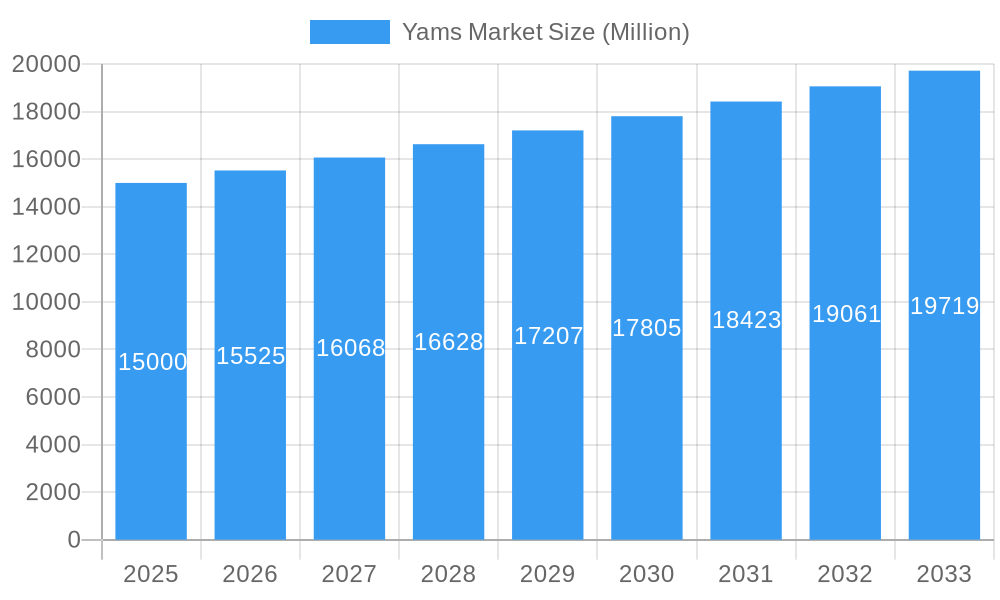
The global yam market, valued at $15 billion in 2025, is projected to experience steady growth, exhibiting a compound annual growth rate (CAGR) of 3.50% from 2025 to 2033. This growth is fueled by several key factors. Increasing consumer demand for nutritious and versatile food sources, particularly in developing economies across Asia and Africa where yams are a staple crop, is a significant driver. Furthermore, the rising popularity of yam-based products in the food and beverage sectors, including processed foods, snacks, and beverages, contributes to market expansion. The pharmaceutical industry's growing interest in yams for their potential health benefits, such as their richness in dietary fiber and antioxidants, further bolsters market growth. While challenges exist, such as fluctuating yam yields due to climate change and dependence on traditional farming practices in some regions, the overall market outlook remains positive. The market segmentation reveals white yams hold the largest market share, followed by yellow and purple varieties, reflecting consumer preferences and regional culinary traditions. The food sector dominates the end-use segments, owing to the versatile culinary applications of yams. Key players, including Agrico, Bafo Farms, Golden Agri-Resources, Sunvi Group, and the African Yam Farmers Association, are actively engaged in improving cultivation techniques, processing methods, and expanding market reach. Regional variations in consumption patterns and market penetration are significant, with North America, Europe, and Asia-Pacific representing major markets.
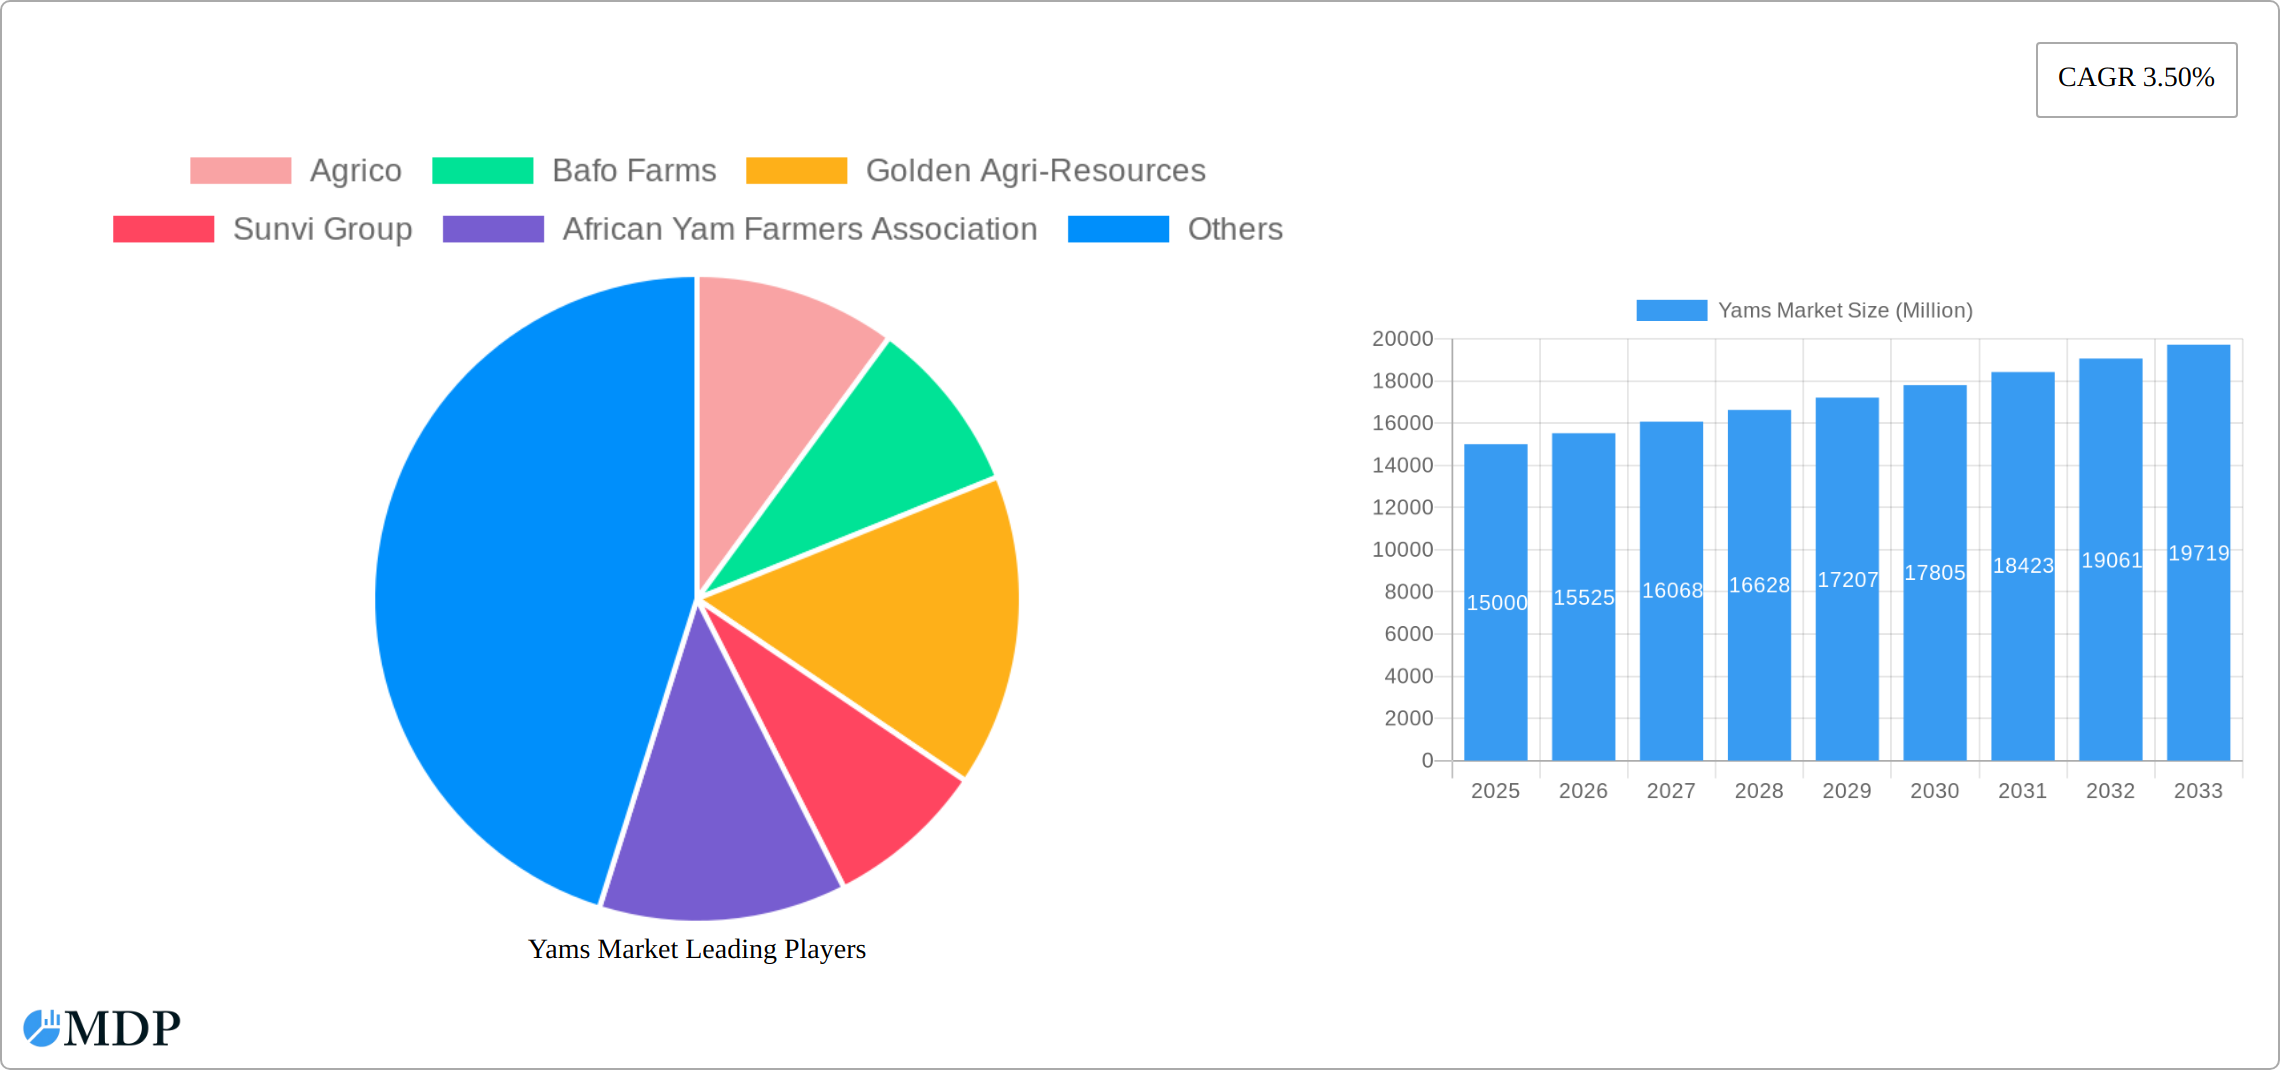
Yams Market Market Size (In Billion)
The competitive landscape is characterized by a mix of established players and emerging businesses. Established firms leverage their expertise in large-scale production and distribution, while smaller, local producers focus on niche markets and specialized yam varieties. Future market growth will likely be influenced by advancements in yam cultivation technologies, the development of value-added yam products, and increasing awareness of yams' nutritional benefits among consumers globally. Sustained investment in research and development, targeted marketing campaigns, and the adoption of sustainable agricultural practices are crucial for achieving long-term market success. The focus will shift toward enhancing product quality, developing innovative yam-based products, and expanding market access in regions with untapped potential. The market's trajectory suggests significant opportunities for growth and innovation in the coming years.
Yams Market Company Market Share
Yams Market Report: 2019-2033 Forecast
This comprehensive report provides a detailed analysis of the global yams market, offering actionable insights for industry stakeholders. With a study period spanning 2019-2033, a base year of 2025, and a forecast period of 2025-2033, this report covers market dynamics, leading players, emerging opportunities, and future growth potential. The market is segmented by variety (white, yellow, purple yams) and end-use (food, beverage, pharmaceutical). Key players analyzed include Agrico, Bafo Farms, Golden Agri-Resources, Sunvi Group, and the African Yam Farmers Association. The report projects a market value exceeding xx Million by 2033, highlighting significant growth opportunities.
Yams Market Dynamics & Concentration
The global yams market exhibits a moderately consolidated structure, with a few dominant players alongside numerous smaller-scale farmers. Market share is heavily influenced by factors such as production volume, geographical reach, and processing capabilities. Agrico, Bafo Farms, and Golden Agri-Resources currently hold significant shares, though precise figures remain proprietary. Innovation, driven by improved farming techniques and processing technologies, remains a key driver, while regulatory frameworks governing food safety and agricultural practices directly impact market operations. Product substitutes, such as other root vegetables, exert competitive pressure. M&A activity, though not extensively documented, has a potential to reshape market dynamics, with an estimated xx M&A deals occurring in the historical period (2019-2024). End-user trends increasingly favor processed yams in convenient forms, while sustainability concerns are driving the adoption of eco-friendly farming methods.
- Market Concentration: Moderately consolidated, with significant regional variations.
- Innovation Drivers: Improved farming techniques, processing technologies, and sustainable practices.
- Regulatory Frameworks: Impact food safety, agricultural practices, and trade.
- Product Substitutes: Other root vegetables and starch sources.
- End-User Trends: Growing preference for convenience and value-added products.
- M&A Activity: Estimated xx deals in 2019-2024, potential for future consolidation.
Yams Market Industry Trends & Analysis
The global yams market is projected to experience robust growth, with a Compound Annual Growth Rate (CAGR) of xx% during the forecast period (2025-2033). This growth is fueled by rising consumer demand driven by increasing awareness of yams' nutritional benefits, growing population, and expanding food processing industries. Technological disruptions, such as the adoption of precision agriculture techniques, enhance efficiency and yield. Consumer preferences are shifting towards processed yams products offering convenience and extended shelf life. The competitive landscape features intense rivalry among both large-scale producers and smallholder farmers. Market penetration remains relatively high in established regions, but significant expansion opportunities exist in emerging markets.
Leading Markets & Segments in Yams Market
The African continent holds a dominant position in global yam production, with Nigeria, Ghana, and Côte d'Ivoire being major producers. Within varieties, white yams account for the largest share of the market, owing to their widespread use in culinary applications. Food applications dominate yam end-use segments, primarily catering to a growing global population.
- Key Drivers for Africa's Dominance:
- Favorable climate conditions and abundant arable land.
- Established farming practices and extensive cultivation.
- Increasing population driving higher demand for staple food.
- Key Drivers for White Yam Dominance:
- Versatile culinary uses in various cuisines.
- Wide acceptance and cultural significance.
- High yields and adaptability across diverse environments.
- Key Drivers for Food End-Use Dominance:
- High nutritional value and versatility as a staple food.
- Wide availability and affordability relative to other food sources.
- Increasing demand for convenient and processed food products.
Yams Market Product Developments
Recent innovations in the yams market are significantly enhancing both yield and the overall value proposition of this versatile root vegetable. Focus areas include extending shelf life through improved post-harvest handling techniques and developing a wider array of value-added products to meet evolving consumer demands. Companies are actively investing in research and development to create novel applications, such as yam-based flours, starches, chips, and ready-to-eat snacks. This diversification caters to the growing preference for convenient and functional foods, tapping into health-conscious consumer trends and expanding beyond traditional culinary uses. Furthermore, research into yam's nutritional profile and potential health benefits is driving further market growth.
Key Drivers of Yams Market Growth
The yams market's growth is fueled by several factors: increasing global population, rising disposable incomes driving demand for nutritious foods, and the growing health awareness that favors yam's nutritional profile. Technological advancements in farming practices improve efficiency and output. Favorable government policies and supportive infrastructure in key regions are also instrumental in boosting production and distribution.
Challenges in the Yams Market Market
Post-harvest losses remain a significant challenge, impacting supply and profitability. Climate change poses a threat to yam production, affecting yield and quality. Competition from other staple crops and substitute products influences market share. Regulatory hurdles and lack of standardization in certain regions create obstacles to trade and market expansion.
Emerging Opportunities in Yams Market
The increasing demand for value-added yam products such as yam starch, yam flour and yam-based snacks presents significant opportunities for market expansion. Strategic partnerships between farmers and processing companies can enhance efficiency and value chain integration. Investing in research to develop drought-resistant yam varieties can improve productivity in arid regions, unlocking substantial market potential.
Leading Players in the Yams Market Sector
- Agrico (if link is available, otherwise replace with only company name)
- Bafo Farms
- Golden Agri-Resources (if link is available, otherwise replace with only company name)
- Sunvi Group
- African Yam Farmers Association
Key Milestones in Yams Market Industry
- August 2022: Formation of the Fiji Yam Farmers Association (FYFA), significantly improving farmer organization, collective bargaining power, and market access.
- May 2021: Successful adoption of improved farming technologies in Ghana, resulting in a demonstrable boost in yield and overall competitiveness on both domestic and international markets.
- April 2021: Pioneering transition to aerial yam farming in Kenya, leading to increased efficiency in land utilization, improved water management, and reduced post-harvest losses.
- October 2023: Launch of a major research initiative focused on identifying and developing new high-yield, disease-resistant yam varieties.
Strategic Outlook for Yams Market Market
The yams market displays substantial growth potential driven by increasing demand and technological advancements. Strategic investments in research and development, innovative processing techniques, and sustainable farming practices will shape future market leadership. Expanding market access in new regions and developing value-added products will be crucial for long-term success.
Yams Market Segmentation
- 1. Production Analysis
- 2. Consumption Analysis
- 3. Import Market Analysis (Value & Volume)
- 4. Export Market Analysis (Value & Volume)
- 5. Price Trend Analysis
Yams Market Segmentation By Geography
-
1. North America
- 1.1. United States
- 1.2. Canada
- 1.3. Mexico
- 1.4. Rest of North America
-
2. Europe
- 2.1. Germany
- 2.2. United Kingdom
- 2.3. France
- 2.4. Russia
- 2.5. Spain
- 2.6. Rest of Europe
-
3. Asia Pacific
- 3.1. India
- 3.2. China
- 3.3. Japan
- 3.4. Rest of Asia Pacific
-
4. South America
- 4.1. Brazil
- 4.2. Argentina
- 4.3. Rest of South America
-
5. Middle East and Africa
- 5.1. Nigeria
- 5.2. Ghana
- 5.3. Rest of Middle East and Africa
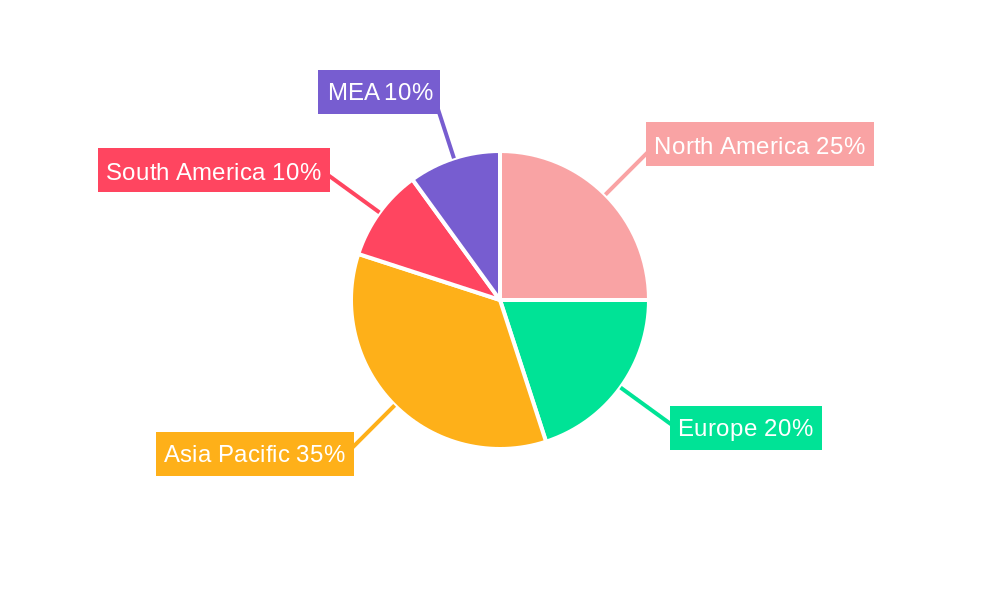
Yams Market Regional Market Share
Geographic Coverage of Yams Market
Yams Market REPORT HIGHLIGHTS
| Aspects | Details |
|---|---|
| Study Period | 2020-2034 |
| Base Year | 2025 |
| Estimated Year | 2026 |
| Forecast Period | 2026-2034 |
| Historical Period | 2020-2025 |
| Growth Rate | CAGR of 3.50% from 2020-2034 |
| Segmentation |
|
Table of Contents
- 1. Introduction
- 1.1. Research Scope
- 1.2. Market Segmentation
- 1.3. Research Methodology
- 1.4. Definitions and Assumptions
- 2. Executive Summary
- 2.1. Introduction
- 3. Market Dynamics
- 3.1. Introduction
- 3.2. Market Drivers
- 3.2.1. Awareness About Health Benefits Associated With Pecan Consumption; Wide Application of Pecan
- 3.3. Market Restrains
- 3.3.1. Volatility in the Prices; Adverse Weather Conditions Affecting Yield
- 3.4. Market Trends
- 3.4.1. Rising Health Benefits of Yams across the Globe
- 4. Market Factor Analysis
- 4.1. Porters Five Forces
- 4.2. Supply/Value Chain
- 4.3. PESTEL analysis
- 4.4. Market Entropy
- 4.5. Patent/Trademark Analysis
- 5. Global Yams Market Analysis, Insights and Forecast, 2020-2032
- 5.1. Market Analysis, Insights and Forecast - by Production Analysis
- 5.2. Market Analysis, Insights and Forecast - by Consumption Analysis
- 5.3. Market Analysis, Insights and Forecast - by Import Market Analysis (Value & Volume)
- 5.4. Market Analysis, Insights and Forecast - by Export Market Analysis (Value & Volume)
- 5.5. Market Analysis, Insights and Forecast - by Price Trend Analysis
- 5.6. Market Analysis, Insights and Forecast - by Region
- 5.6.1. North America
- 5.6.2. Europe
- 5.6.3. Asia Pacific
- 5.6.4. South America
- 5.6.5. Middle East and Africa
- 5.1. Market Analysis, Insights and Forecast - by Production Analysis
- 6. North America Yams Market Analysis, Insights and Forecast, 2020-2032
- 6.1. Market Analysis, Insights and Forecast - by Production Analysis
- 6.2. Market Analysis, Insights and Forecast - by Consumption Analysis
- 6.3. Market Analysis, Insights and Forecast - by Import Market Analysis (Value & Volume)
- 6.4. Market Analysis, Insights and Forecast - by Export Market Analysis (Value & Volume)
- 6.5. Market Analysis, Insights and Forecast - by Price Trend Analysis
- 6.1. Market Analysis, Insights and Forecast - by Production Analysis
- 7. Europe Yams Market Analysis, Insights and Forecast, 2020-2032
- 7.1. Market Analysis, Insights and Forecast - by Production Analysis
- 7.2. Market Analysis, Insights and Forecast - by Consumption Analysis
- 7.3. Market Analysis, Insights and Forecast - by Import Market Analysis (Value & Volume)
- 7.4. Market Analysis, Insights and Forecast - by Export Market Analysis (Value & Volume)
- 7.5. Market Analysis, Insights and Forecast - by Price Trend Analysis
- 7.1. Market Analysis, Insights and Forecast - by Production Analysis
- 8. Asia Pacific Yams Market Analysis, Insights and Forecast, 2020-2032
- 8.1. Market Analysis, Insights and Forecast - by Production Analysis
- 8.2. Market Analysis, Insights and Forecast - by Consumption Analysis
- 8.3. Market Analysis, Insights and Forecast - by Import Market Analysis (Value & Volume)
- 8.4. Market Analysis, Insights and Forecast - by Export Market Analysis (Value & Volume)
- 8.5. Market Analysis, Insights and Forecast - by Price Trend Analysis
- 8.1. Market Analysis, Insights and Forecast - by Production Analysis
- 9. South America Yams Market Analysis, Insights and Forecast, 2020-2032
- 9.1. Market Analysis, Insights and Forecast - by Production Analysis
- 9.2. Market Analysis, Insights and Forecast - by Consumption Analysis
- 9.3. Market Analysis, Insights and Forecast - by Import Market Analysis (Value & Volume)
- 9.4. Market Analysis, Insights and Forecast - by Export Market Analysis (Value & Volume)
- 9.5. Market Analysis, Insights and Forecast - by Price Trend Analysis
- 9.1. Market Analysis, Insights and Forecast - by Production Analysis
- 10. Middle East and Africa Yams Market Analysis, Insights and Forecast, 2020-2032
- 10.1. Market Analysis, Insights and Forecast - by Production Analysis
- 10.2. Market Analysis, Insights and Forecast - by Consumption Analysis
- 10.3. Market Analysis, Insights and Forecast - by Import Market Analysis (Value & Volume)
- 10.4. Market Analysis, Insights and Forecast - by Export Market Analysis (Value & Volume)
- 10.5. Market Analysis, Insights and Forecast - by Price Trend Analysis
- 10.1. Market Analysis, Insights and Forecast - by Production Analysis
- 11. Competitive Analysis
- 11.1. Global Market Share Analysis 2025
- 11.2. Company Profiles
- 11.2.1 Agrico
- 11.2.1.1. Overview
- 11.2.1.2. Products
- 11.2.1.3. SWOT Analysis
- 11.2.1.4. Recent Developments
- 11.2.1.5. Financials (Based on Availability)
- 11.2.2 Bafo Farms
- 11.2.2.1. Overview
- 11.2.2.2. Products
- 11.2.2.3. SWOT Analysis
- 11.2.2.4. Recent Developments
- 11.2.2.5. Financials (Based on Availability)
- 11.2.3 Golden Agri-Resources
- 11.2.3.1. Overview
- 11.2.3.2. Products
- 11.2.3.3. SWOT Analysis
- 11.2.3.4. Recent Developments
- 11.2.3.5. Financials (Based on Availability)
- 11.2.4 Sunvi Group
- 11.2.4.1. Overview
- 11.2.4.2. Products
- 11.2.4.3. SWOT Analysis
- 11.2.4.4. Recent Developments
- 11.2.4.5. Financials (Based on Availability)
- 11.2.5 African Yam Farmers Association
- 11.2.5.1. Overview
- 11.2.5.2. Products
- 11.2.5.3. SWOT Analysis
- 11.2.5.4. Recent Developments
- 11.2.5.5. Financials (Based on Availability)
- 11.2.1 Agrico
List of Figures
- Figure 1: Global Yams Market Revenue Breakdown (Million, %) by Region 2025 & 2033
- Figure 2: Global Yams Market Volume Breakdown (Kiloton, %) by Region 2025 & 2033
- Figure 3: North America Yams Market Revenue (Million), by Production Analysis 2025 & 2033
- Figure 4: North America Yams Market Volume (Kiloton), by Production Analysis 2025 & 2033
- Figure 5: North America Yams Market Revenue Share (%), by Production Analysis 2025 & 2033
- Figure 6: North America Yams Market Volume Share (%), by Production Analysis 2025 & 2033
- Figure 7: North America Yams Market Revenue (Million), by Consumption Analysis 2025 & 2033
- Figure 8: North America Yams Market Volume (Kiloton), by Consumption Analysis 2025 & 2033
- Figure 9: North America Yams Market Revenue Share (%), by Consumption Analysis 2025 & 2033
- Figure 10: North America Yams Market Volume Share (%), by Consumption Analysis 2025 & 2033
- Figure 11: North America Yams Market Revenue (Million), by Import Market Analysis (Value & Volume) 2025 & 2033
- Figure 12: North America Yams Market Volume (Kiloton), by Import Market Analysis (Value & Volume) 2025 & 2033
- Figure 13: North America Yams Market Revenue Share (%), by Import Market Analysis (Value & Volume) 2025 & 2033
- Figure 14: North America Yams Market Volume Share (%), by Import Market Analysis (Value & Volume) 2025 & 2033
- Figure 15: North America Yams Market Revenue (Million), by Export Market Analysis (Value & Volume) 2025 & 2033
- Figure 16: North America Yams Market Volume (Kiloton), by Export Market Analysis (Value & Volume) 2025 & 2033
- Figure 17: North America Yams Market Revenue Share (%), by Export Market Analysis (Value & Volume) 2025 & 2033
- Figure 18: North America Yams Market Volume Share (%), by Export Market Analysis (Value & Volume) 2025 & 2033
- Figure 19: North America Yams Market Revenue (Million), by Price Trend Analysis 2025 & 2033
- Figure 20: North America Yams Market Volume (Kiloton), by Price Trend Analysis 2025 & 2033
- Figure 21: North America Yams Market Revenue Share (%), by Price Trend Analysis 2025 & 2033
- Figure 22: North America Yams Market Volume Share (%), by Price Trend Analysis 2025 & 2033
- Figure 23: North America Yams Market Revenue (Million), by Country 2025 & 2033
- Figure 24: North America Yams Market Volume (Kiloton), by Country 2025 & 2033
- Figure 25: North America Yams Market Revenue Share (%), by Country 2025 & 2033
- Figure 26: North America Yams Market Volume Share (%), by Country 2025 & 2033
- Figure 27: Europe Yams Market Revenue (Million), by Production Analysis 2025 & 2033
- Figure 28: Europe Yams Market Volume (Kiloton), by Production Analysis 2025 & 2033
- Figure 29: Europe Yams Market Revenue Share (%), by Production Analysis 2025 & 2033
- Figure 30: Europe Yams Market Volume Share (%), by Production Analysis 2025 & 2033
- Figure 31: Europe Yams Market Revenue (Million), by Consumption Analysis 2025 & 2033
- Figure 32: Europe Yams Market Volume (Kiloton), by Consumption Analysis 2025 & 2033
- Figure 33: Europe Yams Market Revenue Share (%), by Consumption Analysis 2025 & 2033
- Figure 34: Europe Yams Market Volume Share (%), by Consumption Analysis 2025 & 2033
- Figure 35: Europe Yams Market Revenue (Million), by Import Market Analysis (Value & Volume) 2025 & 2033
- Figure 36: Europe Yams Market Volume (Kiloton), by Import Market Analysis (Value & Volume) 2025 & 2033
- Figure 37: Europe Yams Market Revenue Share (%), by Import Market Analysis (Value & Volume) 2025 & 2033
- Figure 38: Europe Yams Market Volume Share (%), by Import Market Analysis (Value & Volume) 2025 & 2033
- Figure 39: Europe Yams Market Revenue (Million), by Export Market Analysis (Value & Volume) 2025 & 2033
- Figure 40: Europe Yams Market Volume (Kiloton), by Export Market Analysis (Value & Volume) 2025 & 2033
- Figure 41: Europe Yams Market Revenue Share (%), by Export Market Analysis (Value & Volume) 2025 & 2033
- Figure 42: Europe Yams Market Volume Share (%), by Export Market Analysis (Value & Volume) 2025 & 2033
- Figure 43: Europe Yams Market Revenue (Million), by Price Trend Analysis 2025 & 2033
- Figure 44: Europe Yams Market Volume (Kiloton), by Price Trend Analysis 2025 & 2033
- Figure 45: Europe Yams Market Revenue Share (%), by Price Trend Analysis 2025 & 2033
- Figure 46: Europe Yams Market Volume Share (%), by Price Trend Analysis 2025 & 2033
- Figure 47: Europe Yams Market Revenue (Million), by Country 2025 & 2033
- Figure 48: Europe Yams Market Volume (Kiloton), by Country 2025 & 2033
- Figure 49: Europe Yams Market Revenue Share (%), by Country 2025 & 2033
- Figure 50: Europe Yams Market Volume Share (%), by Country 2025 & 2033
- Figure 51: Asia Pacific Yams Market Revenue (Million), by Production Analysis 2025 & 2033
- Figure 52: Asia Pacific Yams Market Volume (Kiloton), by Production Analysis 2025 & 2033
- Figure 53: Asia Pacific Yams Market Revenue Share (%), by Production Analysis 2025 & 2033
- Figure 54: Asia Pacific Yams Market Volume Share (%), by Production Analysis 2025 & 2033
- Figure 55: Asia Pacific Yams Market Revenue (Million), by Consumption Analysis 2025 & 2033
- Figure 56: Asia Pacific Yams Market Volume (Kiloton), by Consumption Analysis 2025 & 2033
- Figure 57: Asia Pacific Yams Market Revenue Share (%), by Consumption Analysis 2025 & 2033
- Figure 58: Asia Pacific Yams Market Volume Share (%), by Consumption Analysis 2025 & 2033
- Figure 59: Asia Pacific Yams Market Revenue (Million), by Import Market Analysis (Value & Volume) 2025 & 2033
- Figure 60: Asia Pacific Yams Market Volume (Kiloton), by Import Market Analysis (Value & Volume) 2025 & 2033
- Figure 61: Asia Pacific Yams Market Revenue Share (%), by Import Market Analysis (Value & Volume) 2025 & 2033
- Figure 62: Asia Pacific Yams Market Volume Share (%), by Import Market Analysis (Value & Volume) 2025 & 2033
- Figure 63: Asia Pacific Yams Market Revenue (Million), by Export Market Analysis (Value & Volume) 2025 & 2033
- Figure 64: Asia Pacific Yams Market Volume (Kiloton), by Export Market Analysis (Value & Volume) 2025 & 2033
- Figure 65: Asia Pacific Yams Market Revenue Share (%), by Export Market Analysis (Value & Volume) 2025 & 2033
- Figure 66: Asia Pacific Yams Market Volume Share (%), by Export Market Analysis (Value & Volume) 2025 & 2033
- Figure 67: Asia Pacific Yams Market Revenue (Million), by Price Trend Analysis 2025 & 2033
- Figure 68: Asia Pacific Yams Market Volume (Kiloton), by Price Trend Analysis 2025 & 2033
- Figure 69: Asia Pacific Yams Market Revenue Share (%), by Price Trend Analysis 2025 & 2033
- Figure 70: Asia Pacific Yams Market Volume Share (%), by Price Trend Analysis 2025 & 2033
- Figure 71: Asia Pacific Yams Market Revenue (Million), by Country 2025 & 2033
- Figure 72: Asia Pacific Yams Market Volume (Kiloton), by Country 2025 & 2033
- Figure 73: Asia Pacific Yams Market Revenue Share (%), by Country 2025 & 2033
- Figure 74: Asia Pacific Yams Market Volume Share (%), by Country 2025 & 2033
- Figure 75: South America Yams Market Revenue (Million), by Production Analysis 2025 & 2033
- Figure 76: South America Yams Market Volume (Kiloton), by Production Analysis 2025 & 2033
- Figure 77: South America Yams Market Revenue Share (%), by Production Analysis 2025 & 2033
- Figure 78: South America Yams Market Volume Share (%), by Production Analysis 2025 & 2033
- Figure 79: South America Yams Market Revenue (Million), by Consumption Analysis 2025 & 2033
- Figure 80: South America Yams Market Volume (Kiloton), by Consumption Analysis 2025 & 2033
- Figure 81: South America Yams Market Revenue Share (%), by Consumption Analysis 2025 & 2033
- Figure 82: South America Yams Market Volume Share (%), by Consumption Analysis 2025 & 2033
- Figure 83: South America Yams Market Revenue (Million), by Import Market Analysis (Value & Volume) 2025 & 2033
- Figure 84: South America Yams Market Volume (Kiloton), by Import Market Analysis (Value & Volume) 2025 & 2033
- Figure 85: South America Yams Market Revenue Share (%), by Import Market Analysis (Value & Volume) 2025 & 2033
- Figure 86: South America Yams Market Volume Share (%), by Import Market Analysis (Value & Volume) 2025 & 2033
- Figure 87: South America Yams Market Revenue (Million), by Export Market Analysis (Value & Volume) 2025 & 2033
- Figure 88: South America Yams Market Volume (Kiloton), by Export Market Analysis (Value & Volume) 2025 & 2033
- Figure 89: South America Yams Market Revenue Share (%), by Export Market Analysis (Value & Volume) 2025 & 2033
- Figure 90: South America Yams Market Volume Share (%), by Export Market Analysis (Value & Volume) 2025 & 2033
- Figure 91: South America Yams Market Revenue (Million), by Price Trend Analysis 2025 & 2033
- Figure 92: South America Yams Market Volume (Kiloton), by Price Trend Analysis 2025 & 2033
- Figure 93: South America Yams Market Revenue Share (%), by Price Trend Analysis 2025 & 2033
- Figure 94: South America Yams Market Volume Share (%), by Price Trend Analysis 2025 & 2033
- Figure 95: South America Yams Market Revenue (Million), by Country 2025 & 2033
- Figure 96: South America Yams Market Volume (Kiloton), by Country 2025 & 2033
- Figure 97: South America Yams Market Revenue Share (%), by Country 2025 & 2033
- Figure 98: South America Yams Market Volume Share (%), by Country 2025 & 2033
- Figure 99: Middle East and Africa Yams Market Revenue (Million), by Production Analysis 2025 & 2033
- Figure 100: Middle East and Africa Yams Market Volume (Kiloton), by Production Analysis 2025 & 2033
- Figure 101: Middle East and Africa Yams Market Revenue Share (%), by Production Analysis 2025 & 2033
- Figure 102: Middle East and Africa Yams Market Volume Share (%), by Production Analysis 2025 & 2033
- Figure 103: Middle East and Africa Yams Market Revenue (Million), by Consumption Analysis 2025 & 2033
- Figure 104: Middle East and Africa Yams Market Volume (Kiloton), by Consumption Analysis 2025 & 2033
- Figure 105: Middle East and Africa Yams Market Revenue Share (%), by Consumption Analysis 2025 & 2033
- Figure 106: Middle East and Africa Yams Market Volume Share (%), by Consumption Analysis 2025 & 2033
- Figure 107: Middle East and Africa Yams Market Revenue (Million), by Import Market Analysis (Value & Volume) 2025 & 2033
- Figure 108: Middle East and Africa Yams Market Volume (Kiloton), by Import Market Analysis (Value & Volume) 2025 & 2033
- Figure 109: Middle East and Africa Yams Market Revenue Share (%), by Import Market Analysis (Value & Volume) 2025 & 2033
- Figure 110: Middle East and Africa Yams Market Volume Share (%), by Import Market Analysis (Value & Volume) 2025 & 2033
- Figure 111: Middle East and Africa Yams Market Revenue (Million), by Export Market Analysis (Value & Volume) 2025 & 2033
- Figure 112: Middle East and Africa Yams Market Volume (Kiloton), by Export Market Analysis (Value & Volume) 2025 & 2033
- Figure 113: Middle East and Africa Yams Market Revenue Share (%), by Export Market Analysis (Value & Volume) 2025 & 2033
- Figure 114: Middle East and Africa Yams Market Volume Share (%), by Export Market Analysis (Value & Volume) 2025 & 2033
- Figure 115: Middle East and Africa Yams Market Revenue (Million), by Price Trend Analysis 2025 & 2033
- Figure 116: Middle East and Africa Yams Market Volume (Kiloton), by Price Trend Analysis 2025 & 2033
- Figure 117: Middle East and Africa Yams Market Revenue Share (%), by Price Trend Analysis 2025 & 2033
- Figure 118: Middle East and Africa Yams Market Volume Share (%), by Price Trend Analysis 2025 & 2033
- Figure 119: Middle East and Africa Yams Market Revenue (Million), by Country 2025 & 2033
- Figure 120: Middle East and Africa Yams Market Volume (Kiloton), by Country 2025 & 2033
- Figure 121: Middle East and Africa Yams Market Revenue Share (%), by Country 2025 & 2033
- Figure 122: Middle East and Africa Yams Market Volume Share (%), by Country 2025 & 2033
List of Tables
- Table 1: Global Yams Market Revenue Million Forecast, by Production Analysis 2020 & 2033
- Table 2: Global Yams Market Volume Kiloton Forecast, by Production Analysis 2020 & 2033
- Table 3: Global Yams Market Revenue Million Forecast, by Consumption Analysis 2020 & 2033
- Table 4: Global Yams Market Volume Kiloton Forecast, by Consumption Analysis 2020 & 2033
- Table 5: Global Yams Market Revenue Million Forecast, by Import Market Analysis (Value & Volume) 2020 & 2033
- Table 6: Global Yams Market Volume Kiloton Forecast, by Import Market Analysis (Value & Volume) 2020 & 2033
- Table 7: Global Yams Market Revenue Million Forecast, by Export Market Analysis (Value & Volume) 2020 & 2033
- Table 8: Global Yams Market Volume Kiloton Forecast, by Export Market Analysis (Value & Volume) 2020 & 2033
- Table 9: Global Yams Market Revenue Million Forecast, by Price Trend Analysis 2020 & 2033
- Table 10: Global Yams Market Volume Kiloton Forecast, by Price Trend Analysis 2020 & 2033
- Table 11: Global Yams Market Revenue Million Forecast, by Region 2020 & 2033
- Table 12: Global Yams Market Volume Kiloton Forecast, by Region 2020 & 2033
- Table 13: Global Yams Market Revenue Million Forecast, by Production Analysis 2020 & 2033
- Table 14: Global Yams Market Volume Kiloton Forecast, by Production Analysis 2020 & 2033
- Table 15: Global Yams Market Revenue Million Forecast, by Consumption Analysis 2020 & 2033
- Table 16: Global Yams Market Volume Kiloton Forecast, by Consumption Analysis 2020 & 2033
- Table 17: Global Yams Market Revenue Million Forecast, by Import Market Analysis (Value & Volume) 2020 & 2033
- Table 18: Global Yams Market Volume Kiloton Forecast, by Import Market Analysis (Value & Volume) 2020 & 2033
- Table 19: Global Yams Market Revenue Million Forecast, by Export Market Analysis (Value & Volume) 2020 & 2033
- Table 20: Global Yams Market Volume Kiloton Forecast, by Export Market Analysis (Value & Volume) 2020 & 2033
- Table 21: Global Yams Market Revenue Million Forecast, by Price Trend Analysis 2020 & 2033
- Table 22: Global Yams Market Volume Kiloton Forecast, by Price Trend Analysis 2020 & 2033
- Table 23: Global Yams Market Revenue Million Forecast, by Country 2020 & 2033
- Table 24: Global Yams Market Volume Kiloton Forecast, by Country 2020 & 2033
- Table 25: United States Yams Market Revenue (Million) Forecast, by Application 2020 & 2033
- Table 26: United States Yams Market Volume (Kiloton) Forecast, by Application 2020 & 2033
- Table 27: Canada Yams Market Revenue (Million) Forecast, by Application 2020 & 2033
- Table 28: Canada Yams Market Volume (Kiloton) Forecast, by Application 2020 & 2033
- Table 29: Mexico Yams Market Revenue (Million) Forecast, by Application 2020 & 2033
- Table 30: Mexico Yams Market Volume (Kiloton) Forecast, by Application 2020 & 2033
- Table 31: Rest of North America Yams Market Revenue (Million) Forecast, by Application 2020 & 2033
- Table 32: Rest of North America Yams Market Volume (Kiloton) Forecast, by Application 2020 & 2033
- Table 33: Global Yams Market Revenue Million Forecast, by Production Analysis 2020 & 2033
- Table 34: Global Yams Market Volume Kiloton Forecast, by Production Analysis 2020 & 2033
- Table 35: Global Yams Market Revenue Million Forecast, by Consumption Analysis 2020 & 2033
- Table 36: Global Yams Market Volume Kiloton Forecast, by Consumption Analysis 2020 & 2033
- Table 37: Global Yams Market Revenue Million Forecast, by Import Market Analysis (Value & Volume) 2020 & 2033
- Table 38: Global Yams Market Volume Kiloton Forecast, by Import Market Analysis (Value & Volume) 2020 & 2033
- Table 39: Global Yams Market Revenue Million Forecast, by Export Market Analysis (Value & Volume) 2020 & 2033
- Table 40: Global Yams Market Volume Kiloton Forecast, by Export Market Analysis (Value & Volume) 2020 & 2033
- Table 41: Global Yams Market Revenue Million Forecast, by Price Trend Analysis 2020 & 2033
- Table 42: Global Yams Market Volume Kiloton Forecast, by Price Trend Analysis 2020 & 2033
- Table 43: Global Yams Market Revenue Million Forecast, by Country 2020 & 2033
- Table 44: Global Yams Market Volume Kiloton Forecast, by Country 2020 & 2033
- Table 45: Germany Yams Market Revenue (Million) Forecast, by Application 2020 & 2033
- Table 46: Germany Yams Market Volume (Kiloton) Forecast, by Application 2020 & 2033
- Table 47: United Kingdom Yams Market Revenue (Million) Forecast, by Application 2020 & 2033
- Table 48: United Kingdom Yams Market Volume (Kiloton) Forecast, by Application 2020 & 2033
- Table 49: France Yams Market Revenue (Million) Forecast, by Application 2020 & 2033
- Table 50: France Yams Market Volume (Kiloton) Forecast, by Application 2020 & 2033
- Table 51: Russia Yams Market Revenue (Million) Forecast, by Application 2020 & 2033
- Table 52: Russia Yams Market Volume (Kiloton) Forecast, by Application 2020 & 2033
- Table 53: Spain Yams Market Revenue (Million) Forecast, by Application 2020 & 2033
- Table 54: Spain Yams Market Volume (Kiloton) Forecast, by Application 2020 & 2033
- Table 55: Rest of Europe Yams Market Revenue (Million) Forecast, by Application 2020 & 2033
- Table 56: Rest of Europe Yams Market Volume (Kiloton) Forecast, by Application 2020 & 2033
- Table 57: Global Yams Market Revenue Million Forecast, by Production Analysis 2020 & 2033
- Table 58: Global Yams Market Volume Kiloton Forecast, by Production Analysis 2020 & 2033
- Table 59: Global Yams Market Revenue Million Forecast, by Consumption Analysis 2020 & 2033
- Table 60: Global Yams Market Volume Kiloton Forecast, by Consumption Analysis 2020 & 2033
- Table 61: Global Yams Market Revenue Million Forecast, by Import Market Analysis (Value & Volume) 2020 & 2033
- Table 62: Global Yams Market Volume Kiloton Forecast, by Import Market Analysis (Value & Volume) 2020 & 2033
- Table 63: Global Yams Market Revenue Million Forecast, by Export Market Analysis (Value & Volume) 2020 & 2033
- Table 64: Global Yams Market Volume Kiloton Forecast, by Export Market Analysis (Value & Volume) 2020 & 2033
- Table 65: Global Yams Market Revenue Million Forecast, by Price Trend Analysis 2020 & 2033
- Table 66: Global Yams Market Volume Kiloton Forecast, by Price Trend Analysis 2020 & 2033
- Table 67: Global Yams Market Revenue Million Forecast, by Country 2020 & 2033
- Table 68: Global Yams Market Volume Kiloton Forecast, by Country 2020 & 2033
- Table 69: India Yams Market Revenue (Million) Forecast, by Application 2020 & 2033
- Table 70: India Yams Market Volume (Kiloton) Forecast, by Application 2020 & 2033
- Table 71: China Yams Market Revenue (Million) Forecast, by Application 2020 & 2033
- Table 72: China Yams Market Volume (Kiloton) Forecast, by Application 2020 & 2033
- Table 73: Japan Yams Market Revenue (Million) Forecast, by Application 2020 & 2033
- Table 74: Japan Yams Market Volume (Kiloton) Forecast, by Application 2020 & 2033
- Table 75: Rest of Asia Pacific Yams Market Revenue (Million) Forecast, by Application 2020 & 2033
- Table 76: Rest of Asia Pacific Yams Market Volume (Kiloton) Forecast, by Application 2020 & 2033
- Table 77: Global Yams Market Revenue Million Forecast, by Production Analysis 2020 & 2033
- Table 78: Global Yams Market Volume Kiloton Forecast, by Production Analysis 2020 & 2033
- Table 79: Global Yams Market Revenue Million Forecast, by Consumption Analysis 2020 & 2033
- Table 80: Global Yams Market Volume Kiloton Forecast, by Consumption Analysis 2020 & 2033
- Table 81: Global Yams Market Revenue Million Forecast, by Import Market Analysis (Value & Volume) 2020 & 2033
- Table 82: Global Yams Market Volume Kiloton Forecast, by Import Market Analysis (Value & Volume) 2020 & 2033
- Table 83: Global Yams Market Revenue Million Forecast, by Export Market Analysis (Value & Volume) 2020 & 2033
- Table 84: Global Yams Market Volume Kiloton Forecast, by Export Market Analysis (Value & Volume) 2020 & 2033
- Table 85: Global Yams Market Revenue Million Forecast, by Price Trend Analysis 2020 & 2033
- Table 86: Global Yams Market Volume Kiloton Forecast, by Price Trend Analysis 2020 & 2033
- Table 87: Global Yams Market Revenue Million Forecast, by Country 2020 & 2033
- Table 88: Global Yams Market Volume Kiloton Forecast, by Country 2020 & 2033
- Table 89: Brazil Yams Market Revenue (Million) Forecast, by Application 2020 & 2033
- Table 90: Brazil Yams Market Volume (Kiloton) Forecast, by Application 2020 & 2033
- Table 91: Argentina Yams Market Revenue (Million) Forecast, by Application 2020 & 2033
- Table 92: Argentina Yams Market Volume (Kiloton) Forecast, by Application 2020 & 2033
- Table 93: Rest of South America Yams Market Revenue (Million) Forecast, by Application 2020 & 2033
- Table 94: Rest of South America Yams Market Volume (Kiloton) Forecast, by Application 2020 & 2033
- Table 95: Global Yams Market Revenue Million Forecast, by Production Analysis 2020 & 2033
- Table 96: Global Yams Market Volume Kiloton Forecast, by Production Analysis 2020 & 2033
- Table 97: Global Yams Market Revenue Million Forecast, by Consumption Analysis 2020 & 2033
- Table 98: Global Yams Market Volume Kiloton Forecast, by Consumption Analysis 2020 & 2033
- Table 99: Global Yams Market Revenue Million Forecast, by Import Market Analysis (Value & Volume) 2020 & 2033
- Table 100: Global Yams Market Volume Kiloton Forecast, by Import Market Analysis (Value & Volume) 2020 & 2033
- Table 101: Global Yams Market Revenue Million Forecast, by Export Market Analysis (Value & Volume) 2020 & 2033
- Table 102: Global Yams Market Volume Kiloton Forecast, by Export Market Analysis (Value & Volume) 2020 & 2033
- Table 103: Global Yams Market Revenue Million Forecast, by Price Trend Analysis 2020 & 2033
- Table 104: Global Yams Market Volume Kiloton Forecast, by Price Trend Analysis 2020 & 2033
- Table 105: Global Yams Market Revenue Million Forecast, by Country 2020 & 2033
- Table 106: Global Yams Market Volume Kiloton Forecast, by Country 2020 & 2033
- Table 107: Nigeria Yams Market Revenue (Million) Forecast, by Application 2020 & 2033
- Table 108: Nigeria Yams Market Volume (Kiloton) Forecast, by Application 2020 & 2033
- Table 109: Ghana Yams Market Revenue (Million) Forecast, by Application 2020 & 2033
- Table 110: Ghana Yams Market Volume (Kiloton) Forecast, by Application 2020 & 2033
- Table 111: Rest of Middle East and Africa Yams Market Revenue (Million) Forecast, by Application 2020 & 2033
- Table 112: Rest of Middle East and Africa Yams Market Volume (Kiloton) Forecast, by Application 2020 & 2033
Frequently Asked Questions
1. What is the projected Compound Annual Growth Rate (CAGR) of the Yams Market?
The projected CAGR is approximately 3.50%.
2. Which companies are prominent players in the Yams Market?
Key companies in the market include Agrico, Bafo Farms, Golden Agri-Resources, Sunvi Group, African Yam Farmers Association.
3. What are the main segments of the Yams Market?
The market segments include Production Analysis, Consumption Analysis, Import Market Analysis (Value & Volume), Export Market Analysis (Value & Volume), Price Trend Analysis.
4. Can you provide details about the market size?
The market size is estimated to be USD 15 Million as of 2022.
5. What are some drivers contributing to market growth?
Awareness About Health Benefits Associated With Pecan Consumption; Wide Application of Pecan.
6. What are the notable trends driving market growth?
Rising Health Benefits of Yams across the Globe.
7. Are there any restraints impacting market growth?
Volatility in the Prices; Adverse Weather Conditions Affecting Yield.
8. Can you provide examples of recent developments in the market?
August 2022: Fiji Yam Farmers Association (FYFA) association, an affiliate of the Fiji Crop and Livestock Council (FCLC), serves the needs of yam farmers and provides a channel of communication for sale and reproduction.
9. What pricing options are available for accessing the report?
Pricing options include single-user, multi-user, and enterprise licenses priced at USD 4750, USD 5250, and USD 8750 respectively.
10. Is the market size provided in terms of value or volume?
The market size is provided in terms of value, measured in Million and volume, measured in Kiloton.
11. Are there any specific market keywords associated with the report?
Yes, the market keyword associated with the report is "Yams Market," which aids in identifying and referencing the specific market segment covered.
12. How do I determine which pricing option suits my needs best?
The pricing options vary based on user requirements and access needs. Individual users may opt for single-user licenses, while businesses requiring broader access may choose multi-user or enterprise licenses for cost-effective access to the report.
13. Are there any additional resources or data provided in the Yams Market report?
While the report offers comprehensive insights, it's advisable to review the specific contents or supplementary materials provided to ascertain if additional resources or data are available.
14. How can I stay updated on further developments or reports in the Yams Market?
To stay informed about further developments, trends, and reports in the Yams Market, consider subscribing to industry newsletters, following relevant companies and organizations, or regularly checking reputable industry news sources and publications.
Methodology
Step 1 - Identification of Relevant Samples Size from Population Database


Step 2 - Approaches for Defining Global Market Size (Value, Volume* & Price*)

Note*: In applicable scenarios
Step 3 - Data Sources
Primary Research
- Web Analytics
- Survey Reports
- Research Institute
- Latest Research Reports
- Opinion Leaders
Secondary Research
- Annual Reports
- White Paper
- Latest Press Release
- Industry Association
- Paid Database
- Investor Presentations

Step 4 - Data Triangulation
Involves using different sources of information in order to increase the validity of a study
These sources are likely to be stakeholders in a program - participants, other researchers, program staff, other community members, and so on.
Then we put all data in single framework & apply various statistical tools to find out the dynamic on the market.
During the analysis stage, feedback from the stakeholder groups would be compared to determine areas of agreement as well as areas of divergence