

Key Insights
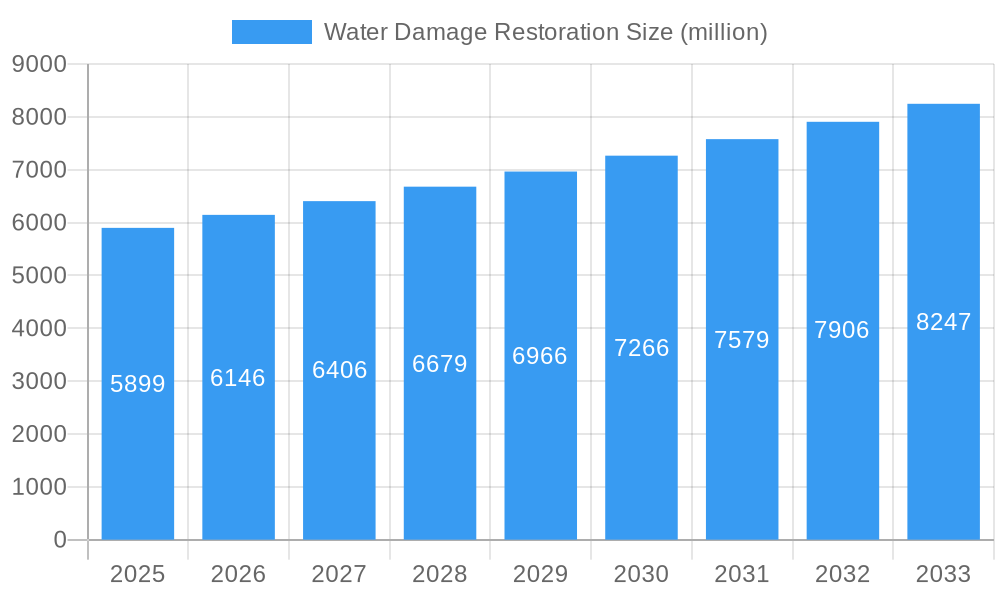
The water damage restoration market, currently valued at $5,899 million in 2025, is projected to experience steady growth, driven by increasing frequency of extreme weather events, aging infrastructure leading to more plumbing failures, and a rising awareness of the health risks associated with water damage. The compound annual growth rate (CAGR) of 4.1% from 2025 to 2033 indicates a significant market expansion. Key segments driving this growth include residential properties, which are particularly vulnerable to water damage from various sources, and commercial buildings, where extensive damage can lead to significant business disruption and financial losses. The healthcare sector represents a notable niche, emphasizing the strict hygiene and safety standards requiring specialized restoration services. Within the service types, sewage cleanup and flood cleanup dominate, reflecting the prevalent causes of water damage. Competition among established players like SERVPRO, Paul Davis, and BELFOR is intense, driving innovation and service quality improvements. Growth is expected across all regions, with North America and Europe maintaining significant market share due to higher infrastructure density and developed economies. However, emerging markets in Asia-Pacific are poised for substantial growth as urbanization and economic development increase. The market's trajectory is influenced by factors such as technological advancements in water damage detection and remediation techniques, rising insurance penetration, and increasing government regulations related to building safety and environmental protection.
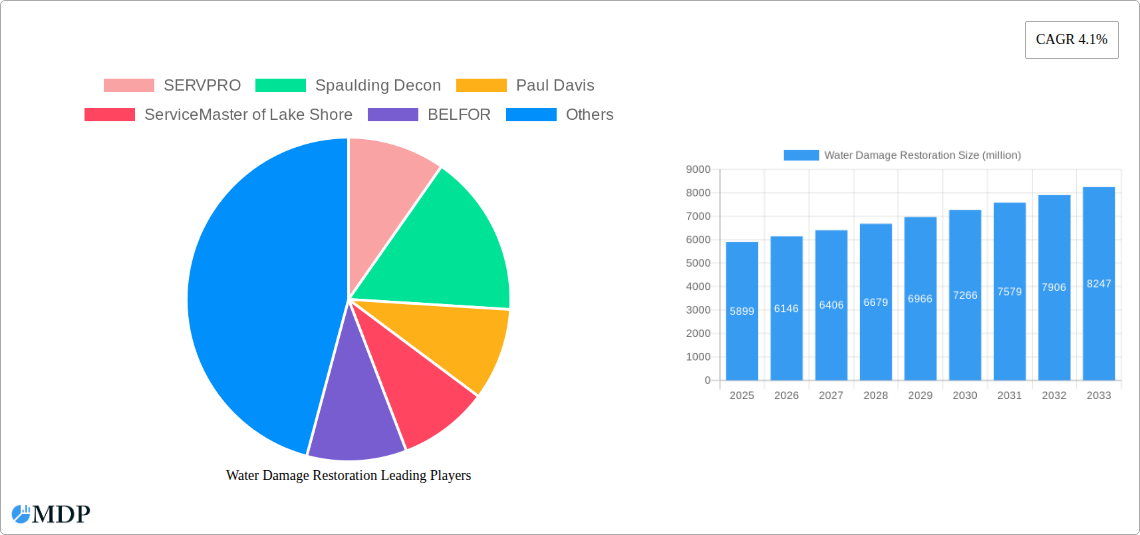
Water Damage Restoration Market Size (In Billion)
The competitive landscape is characterized by a mix of large, nationally recognized franchises and smaller, regional players. This dynamic fosters competition based on service quality, response times, and technological capabilities. The market is likely to see continued consolidation as larger companies acquire smaller firms to expand their geographic reach and service offerings. Furthermore, the increasing adoption of advanced technologies, such as thermal imaging and moisture meters, is enhancing efficiency and accuracy in damage assessment and restoration. The market’s future growth will be significantly impacted by climate change, with more frequent and severe weather events potentially driving demand for water damage restoration services. Investing in preventive measures and building resilience to water damage will be crucial for both homeowners and businesses in mitigating future losses. The continued development and adoption of eco-friendly restoration methods also represents a growing trend within the sector.
Water Damage Restoration Company Market Share
Water Damage Restoration Market Report: A $XX Million Industry Forecast (2019-2033)
This comprehensive report provides a detailed analysis of the global water damage restoration market, projecting a value of $XX million by 2033. The study covers the period 2019-2033, with a base year of 2025 and a forecast period of 2025-2033. It offers crucial insights for industry stakeholders, including leading players like SERVPRO, Spaulding Decon, Paul Davis, and others, to navigate the evolving market landscape and capitalize on emerging opportunities. The report meticulously analyzes market dynamics, trends, leading segments, and key players, presenting actionable data and projections to inform strategic decision-making. This in-depth analysis includes a breakdown by application (residential, commercial, healthcare, others) and type of service (sewage cleanup, flood cleanup, others).
Water Damage Restoration Market Dynamics & Concentration
The water damage restoration market exhibits a moderately concentrated structure, with a handful of large players holding significant market share. SERVPRO, Paul Davis, and ServiceMaster hold a combined xx% share, as of 2025, indicating high market maturity with established players. However, the market also presents opportunities for smaller, specialized firms to focus on niche applications or geographic locations. Innovation in drying technologies, advanced cleaning solutions, and data-driven restoration techniques are key drivers. Regulatory frameworks like building codes and insurance regulations influence market growth and practices. Substitutes like preventative measures (e.g., improved waterproofing) represent a competitive threat, but the unpredictability of water damage events ensures a sustained need for professional restoration. End-user trends toward faster recovery times and minimal disruption drive demand for efficient and technologically advanced services. M&A activity in the sector has been moderate, with xx deals recorded between 2019 and 2024, indicating a consolidating market focused on scale and expertise.
- Market Share (2025): SERVPRO (xx%), Paul Davis (xx%), ServiceMaster (xx%), Others (xx%)
- M&A Deal Count (2019-2024): xx
- Key Innovation Drivers: Advanced drying technologies, microbial remediation, data analytics.
- Regulatory Influences: Building codes, insurance claim procedures, environmental regulations.
Water Damage Restoration Industry Trends & Analysis
The water damage restoration market is experiencing steady growth, with a projected CAGR of xx% during the forecast period (2025-2033). Increasing frequency and intensity of extreme weather events are major drivers. Rising urbanization and population density lead to a higher concentration of properties at risk from water damage. Technological advancements in equipment, such as high-powered drying systems and advanced sensors, significantly improve efficiency and reduce restoration time. Consumer preferences increasingly focus on quick turnaround times, minimal disruption, and environmentally friendly practices. Competitive dynamics are characterized by price competition, service differentiation through specialized offerings (e.g., mold remediation), and strategic partnerships with insurance companies. Market penetration of advanced technologies, like thermal imaging cameras, is gradually increasing, enhancing service accuracy and efficiency.
Leading Markets & Segments in Water Damage Restoration
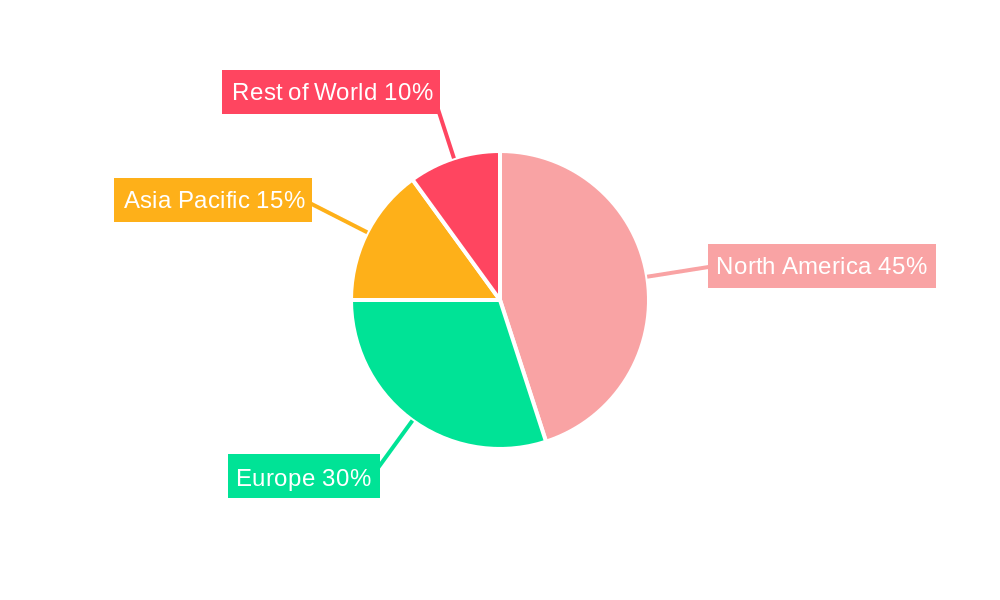
The North American market holds a significant share of the global water damage restoration market, driven by a high prevalence of extreme weather events and a well-established insurance infrastructure. Within the application segments, residential properties account for a larger share ($xx million in 2025) due to the sheer number of residential buildings susceptible to water damage. The commercial buildings segment is also substantial ($xx million in 2025), driven by business interruption costs and stricter regulatory compliance. Healthcare facilities require specialized cleaning and restoration methods, making it a significant, albeit smaller, niche ($xx million in 2025). Similarly, sewage cleanup dominates the type segment ($xx million in 2025) due to the frequent occurrence of sewage backups and the need for extensive remediation.
- Key Drivers – North America: High frequency of extreme weather events, robust insurance sector, strong construction activity.
- Key Drivers – Residential Properties: High volume of residential properties, homeowner insurance coverage.
- Key Drivers – Commercial Buildings: Business interruption costs, stringent regulatory requirements.
- Key Drivers – Sewage Cleanup: Frequent sewage backups, need for specialized remediation.
Water Damage Restoration Product Developments
Recent product innovations focus on improving efficiency, reducing environmental impact, and enhancing restoration quality. New drying technologies, such as desiccant dehumidifiers and air movers, are more efficient and energy-saving. Bio-remediation techniques using microbial solutions are gaining traction for mold and odor removal, offering environmentally friendly alternatives. Advanced moisture detection tools, including thermal imaging cameras and moisture meters, ensure accurate assessment and facilitate more precise restoration efforts. These advancements enhance the speed and effectiveness of water damage restoration, leading to improved customer satisfaction and reduced overall costs.
Key Drivers of Water Damage Restoration Growth
Several factors propel the growth of the water damage restoration market. Technological advancements leading to improved efficiency and effectiveness in restoration methods are paramount. The increasing frequency and severity of natural disasters, exacerbated by climate change, fuel demand for restoration services. Government regulations and building codes aimed at preventing and mitigating water damage further contribute to market expansion. The expanding construction sector and rising urbanization also create more opportunities for water damage restoration businesses.
Challenges in the Water Damage Restoration Market
The industry faces challenges including fluctuating demand due to the unpredictable nature of water damage events, leading to uneven workloads and operational complexities. Regulatory hurdles and compliance requirements can be substantial, impacting operating costs. Supply chain disruptions, particularly for specialized restoration equipment and materials, can affect profitability. Intense competition among established players and emerging firms puts pressure on pricing and necessitates continuous innovation to maintain competitiveness. These factors together can impact the overall market growth and profitability of individual firms. The total impact of these challenges is estimated at a reduction of market growth by xx% per annum.
Emerging Opportunities in Water Damage Restoration
Significant opportunities exist for growth in the water damage restoration sector. Technological breakthroughs in areas such as AI-powered damage assessment and robotic cleaning systems promise to revolutionize the industry, improving efficiency and precision. Strategic partnerships with insurance providers and real estate companies will open up new market segments. Expansion into underserved regions and markets with high growth potential also provides ample avenues for expansion.
Leading Players in the Water Damage Restoration Sector
- SERVPRO
- Spaulding Decon
- Paul Davis
- ServiceMaster of Lake Shore
- BELFOR
- BioteamAZ
- Brooks Remediation
- Cotton Global Disaster Solutions
- ServiceMaster Restore
- SI Restoration
- New Life Restoration
- Elite Restoration
- ThriveStar Restoration
- Virginia Restoration Services
- DAI Restore
- Rainbow Restoration
- ATI Restoration
- Premier Restoration & Construction
- First Onsite
- Paul Davis Restoration
- Blackmon Mooring & BMS CAT
- Restoration Management Company
Key Milestones in Water Damage Restoration Industry
- 2020: Increased adoption of contactless technologies due to the COVID-19 pandemic.
- 2021: Significant investment in AI-powered damage assessment tools.
- 2022: Launch of several environmentally friendly restoration products.
- 2023: Growing partnerships between restoration companies and insurance providers.
- 2024: Several major M&A activities consolidating market share.
Strategic Outlook for Water Damage Restoration Market
The water damage restoration market is poised for continued growth, driven by technological advancements, evolving consumer preferences, and the increasing frequency of extreme weather events. Strategic opportunities lie in leveraging technology to enhance service delivery, fostering strategic partnerships to expand market reach, and focusing on sustainable and environmentally conscious restoration practices. The market's long-term potential is considerable, with significant room for expansion and innovation in various segments.
Water Damage Restoration Segmentation
-
1. Application
- 1.1. Residential Properties
- 1.2. Commercial Buildings
- 1.3. Healthcare Facilities
- 1.4. Others
-
2. Type
- 2.1. Sewage Cleanup
- 2.2. Flood Cleanup
- 2.3. Others
Water Damage Restoration Segmentation By Geography
-
1. North America
- 1.1. United States
- 1.2. Canada
- 1.3. Mexico
-
2. South America
- 2.1. Brazil
- 2.2. Argentina
- 2.3. Rest of South America
-
3. Europe
- 3.1. United Kingdom
- 3.2. Germany
- 3.3. France
- 3.4. Italy
- 3.5. Spain
- 3.6. Russia
- 3.7. Benelux
- 3.8. Nordics
- 3.9. Rest of Europe
-
4. Middle East & Africa
- 4.1. Turkey
- 4.2. Israel
- 4.3. GCC
- 4.4. North Africa
- 4.5. South Africa
- 4.6. Rest of Middle East & Africa
-
5. Asia Pacific
- 5.1. China
- 5.2. India
- 5.3. Japan
- 5.4. South Korea
- 5.5. ASEAN
- 5.6. Oceania
- 5.7. Rest of Asia Pacific
Water Damage Restoration Regional Market Share
Geographic Coverage of Water Damage Restoration
Water Damage Restoration REPORT HIGHLIGHTS
| Aspects | Details |
|---|---|
| Study Period | 2020-2034 |
| Base Year | 2025 |
| Estimated Year | 2026 |
| Forecast Period | 2026-2034 |
| Historical Period | 2020-2025 |
| Growth Rate | CAGR of 4.1% from 2020-2034 |
| Segmentation |
|
Table of Contents
- 1. Introduction
- 1.1. Research Scope
- 1.2. Market Segmentation
- 1.3. Research Methodology
- 1.4. Definitions and Assumptions
- 2. Executive Summary
- 2.1. Introduction
- 3. Market Dynamics
- 3.1. Introduction
- 3.2. Market Drivers
- 3.3. Market Restrains
- 3.4. Market Trends
- 4. Market Factor Analysis
- 4.1. Porters Five Forces
- 4.2. Supply/Value Chain
- 4.3. PESTEL analysis
- 4.4. Market Entropy
- 4.5. Patent/Trademark Analysis
- 5. Global Water Damage Restoration Analysis, Insights and Forecast, 2020-2032
- 5.1. Market Analysis, Insights and Forecast - by Application
- 5.1.1. Residential Properties
- 5.1.2. Commercial Buildings
- 5.1.3. Healthcare Facilities
- 5.1.4. Others
- 5.2. Market Analysis, Insights and Forecast - by Type
- 5.2.1. Sewage Cleanup
- 5.2.2. Flood Cleanup
- 5.2.3. Others
- 5.3. Market Analysis, Insights and Forecast - by Region
- 5.3.1. North America
- 5.3.2. South America
- 5.3.3. Europe
- 5.3.4. Middle East & Africa
- 5.3.5. Asia Pacific
- 5.1. Market Analysis, Insights and Forecast - by Application
- 6. North America Water Damage Restoration Analysis, Insights and Forecast, 2020-2032
- 6.1. Market Analysis, Insights and Forecast - by Application
- 6.1.1. Residential Properties
- 6.1.2. Commercial Buildings
- 6.1.3. Healthcare Facilities
- 6.1.4. Others
- 6.2. Market Analysis, Insights and Forecast - by Type
- 6.2.1. Sewage Cleanup
- 6.2.2. Flood Cleanup
- 6.2.3. Others
- 6.1. Market Analysis, Insights and Forecast - by Application
- 7. South America Water Damage Restoration Analysis, Insights and Forecast, 2020-2032
- 7.1. Market Analysis, Insights and Forecast - by Application
- 7.1.1. Residential Properties
- 7.1.2. Commercial Buildings
- 7.1.3. Healthcare Facilities
- 7.1.4. Others
- 7.2. Market Analysis, Insights and Forecast - by Type
- 7.2.1. Sewage Cleanup
- 7.2.2. Flood Cleanup
- 7.2.3. Others
- 7.1. Market Analysis, Insights and Forecast - by Application
- 8. Europe Water Damage Restoration Analysis, Insights and Forecast, 2020-2032
- 8.1. Market Analysis, Insights and Forecast - by Application
- 8.1.1. Residential Properties
- 8.1.2. Commercial Buildings
- 8.1.3. Healthcare Facilities
- 8.1.4. Others
- 8.2. Market Analysis, Insights and Forecast - by Type
- 8.2.1. Sewage Cleanup
- 8.2.2. Flood Cleanup
- 8.2.3. Others
- 8.1. Market Analysis, Insights and Forecast - by Application
- 9. Middle East & Africa Water Damage Restoration Analysis, Insights and Forecast, 2020-2032
- 9.1. Market Analysis, Insights and Forecast - by Application
- 9.1.1. Residential Properties
- 9.1.2. Commercial Buildings
- 9.1.3. Healthcare Facilities
- 9.1.4. Others
- 9.2. Market Analysis, Insights and Forecast - by Type
- 9.2.1. Sewage Cleanup
- 9.2.2. Flood Cleanup
- 9.2.3. Others
- 9.1. Market Analysis, Insights and Forecast - by Application
- 10. Asia Pacific Water Damage Restoration Analysis, Insights and Forecast, 2020-2032
- 10.1. Market Analysis, Insights and Forecast - by Application
- 10.1.1. Residential Properties
- 10.1.2. Commercial Buildings
- 10.1.3. Healthcare Facilities
- 10.1.4. Others
- 10.2. Market Analysis, Insights and Forecast - by Type
- 10.2.1. Sewage Cleanup
- 10.2.2. Flood Cleanup
- 10.2.3. Others
- 10.1. Market Analysis, Insights and Forecast - by Application
- 11. Competitive Analysis
- 11.1. Global Market Share Analysis 2025
- 11.2. Company Profiles
- 11.2.1 SERVPRO
- 11.2.1.1. Overview
- 11.2.1.2. Products
- 11.2.1.3. SWOT Analysis
- 11.2.1.4. Recent Developments
- 11.2.1.5. Financials (Based on Availability)
- 11.2.2 Spaulding Decon
- 11.2.2.1. Overview
- 11.2.2.2. Products
- 11.2.2.3. SWOT Analysis
- 11.2.2.4. Recent Developments
- 11.2.2.5. Financials (Based on Availability)
- 11.2.3 Paul Davis
- 11.2.3.1. Overview
- 11.2.3.2. Products
- 11.2.3.3. SWOT Analysis
- 11.2.3.4. Recent Developments
- 11.2.3.5. Financials (Based on Availability)
- 11.2.4 ServiceMaster of Lake Shore
- 11.2.4.1. Overview
- 11.2.4.2. Products
- 11.2.4.3. SWOT Analysis
- 11.2.4.4. Recent Developments
- 11.2.4.5. Financials (Based on Availability)
- 11.2.5 BELFOR
- 11.2.5.1. Overview
- 11.2.5.2. Products
- 11.2.5.3. SWOT Analysis
- 11.2.5.4. Recent Developments
- 11.2.5.5. Financials (Based on Availability)
- 11.2.6 BioteamAZ
- 11.2.6.1. Overview
- 11.2.6.2. Products
- 11.2.6.3. SWOT Analysis
- 11.2.6.4. Recent Developments
- 11.2.6.5. Financials (Based on Availability)
- 11.2.7 Brooks Remediation
- 11.2.7.1. Overview
- 11.2.7.2. Products
- 11.2.7.3. SWOT Analysis
- 11.2.7.4. Recent Developments
- 11.2.7.5. Financials (Based on Availability)
- 11.2.8 Cotton Global Disaster Solutions
- 11.2.8.1. Overview
- 11.2.8.2. Products
- 11.2.8.3. SWOT Analysis
- 11.2.8.4. Recent Developments
- 11.2.8.5. Financials (Based on Availability)
- 11.2.9 ServiceMaster Restore
- 11.2.9.1. Overview
- 11.2.9.2. Products
- 11.2.9.3. SWOT Analysis
- 11.2.9.4. Recent Developments
- 11.2.9.5. Financials (Based on Availability)
- 11.2.10 SI Restoration
- 11.2.10.1. Overview
- 11.2.10.2. Products
- 11.2.10.3. SWOT Analysis
- 11.2.10.4. Recent Developments
- 11.2.10.5. Financials (Based on Availability)
- 11.2.11 New Life Restoration
- 11.2.11.1. Overview
- 11.2.11.2. Products
- 11.2.11.3. SWOT Analysis
- 11.2.11.4. Recent Developments
- 11.2.11.5. Financials (Based on Availability)
- 11.2.12 Elite Restoration
- 11.2.12.1. Overview
- 11.2.12.2. Products
- 11.2.12.3. SWOT Analysis
- 11.2.12.4. Recent Developments
- 11.2.12.5. Financials (Based on Availability)
- 11.2.13 ThriveStar Restoration
- 11.2.13.1. Overview
- 11.2.13.2. Products
- 11.2.13.3. SWOT Analysis
- 11.2.13.4. Recent Developments
- 11.2.13.5. Financials (Based on Availability)
- 11.2.14 Virginia Restoration Services
- 11.2.14.1. Overview
- 11.2.14.2. Products
- 11.2.14.3. SWOT Analysis
- 11.2.14.4. Recent Developments
- 11.2.14.5. Financials (Based on Availability)
- 11.2.15 DAI Restore
- 11.2.15.1. Overview
- 11.2.15.2. Products
- 11.2.15.3. SWOT Analysis
- 11.2.15.4. Recent Developments
- 11.2.15.5. Financials (Based on Availability)
- 11.2.16 Rainbow Restoration
- 11.2.16.1. Overview
- 11.2.16.2. Products
- 11.2.16.3. SWOT Analysis
- 11.2.16.4. Recent Developments
- 11.2.16.5. Financials (Based on Availability)
- 11.2.17 ATI Restoration
- 11.2.17.1. Overview
- 11.2.17.2. Products
- 11.2.17.3. SWOT Analysis
- 11.2.17.4. Recent Developments
- 11.2.17.5. Financials (Based on Availability)
- 11.2.18 Premier Restoration & Construction
- 11.2.18.1. Overview
- 11.2.18.2. Products
- 11.2.18.3. SWOT Analysis
- 11.2.18.4. Recent Developments
- 11.2.18.5. Financials (Based on Availability)
- 11.2.19 First Onsite
- 11.2.19.1. Overview
- 11.2.19.2. Products
- 11.2.19.3. SWOT Analysis
- 11.2.19.4. Recent Developments
- 11.2.19.5. Financials (Based on Availability)
- 11.2.20 Paul Davis Restoration
- 11.2.20.1. Overview
- 11.2.20.2. Products
- 11.2.20.3. SWOT Analysis
- 11.2.20.4. Recent Developments
- 11.2.20.5. Financials (Based on Availability)
- 11.2.21 Blackmon Mooring & BMS CAT
- 11.2.21.1. Overview
- 11.2.21.2. Products
- 11.2.21.3. SWOT Analysis
- 11.2.21.4. Recent Developments
- 11.2.21.5. Financials (Based on Availability)
- 11.2.22 Restoration Management Company
- 11.2.22.1. Overview
- 11.2.22.2. Products
- 11.2.22.3. SWOT Analysis
- 11.2.22.4. Recent Developments
- 11.2.22.5. Financials (Based on Availability)
- 11.2.1 SERVPRO
List of Figures
- Figure 1: Global Water Damage Restoration Revenue Breakdown (million, %) by Region 2025 & 2033
- Figure 2: North America Water Damage Restoration Revenue (million), by Application 2025 & 2033
- Figure 3: North America Water Damage Restoration Revenue Share (%), by Application 2025 & 2033
- Figure 4: North America Water Damage Restoration Revenue (million), by Type 2025 & 2033
- Figure 5: North America Water Damage Restoration Revenue Share (%), by Type 2025 & 2033
- Figure 6: North America Water Damage Restoration Revenue (million), by Country 2025 & 2033
- Figure 7: North America Water Damage Restoration Revenue Share (%), by Country 2025 & 2033
- Figure 8: South America Water Damage Restoration Revenue (million), by Application 2025 & 2033
- Figure 9: South America Water Damage Restoration Revenue Share (%), by Application 2025 & 2033
- Figure 10: South America Water Damage Restoration Revenue (million), by Type 2025 & 2033
- Figure 11: South America Water Damage Restoration Revenue Share (%), by Type 2025 & 2033
- Figure 12: South America Water Damage Restoration Revenue (million), by Country 2025 & 2033
- Figure 13: South America Water Damage Restoration Revenue Share (%), by Country 2025 & 2033
- Figure 14: Europe Water Damage Restoration Revenue (million), by Application 2025 & 2033
- Figure 15: Europe Water Damage Restoration Revenue Share (%), by Application 2025 & 2033
- Figure 16: Europe Water Damage Restoration Revenue (million), by Type 2025 & 2033
- Figure 17: Europe Water Damage Restoration Revenue Share (%), by Type 2025 & 2033
- Figure 18: Europe Water Damage Restoration Revenue (million), by Country 2025 & 2033
- Figure 19: Europe Water Damage Restoration Revenue Share (%), by Country 2025 & 2033
- Figure 20: Middle East & Africa Water Damage Restoration Revenue (million), by Application 2025 & 2033
- Figure 21: Middle East & Africa Water Damage Restoration Revenue Share (%), by Application 2025 & 2033
- Figure 22: Middle East & Africa Water Damage Restoration Revenue (million), by Type 2025 & 2033
- Figure 23: Middle East & Africa Water Damage Restoration Revenue Share (%), by Type 2025 & 2033
- Figure 24: Middle East & Africa Water Damage Restoration Revenue (million), by Country 2025 & 2033
- Figure 25: Middle East & Africa Water Damage Restoration Revenue Share (%), by Country 2025 & 2033
- Figure 26: Asia Pacific Water Damage Restoration Revenue (million), by Application 2025 & 2033
- Figure 27: Asia Pacific Water Damage Restoration Revenue Share (%), by Application 2025 & 2033
- Figure 28: Asia Pacific Water Damage Restoration Revenue (million), by Type 2025 & 2033
- Figure 29: Asia Pacific Water Damage Restoration Revenue Share (%), by Type 2025 & 2033
- Figure 30: Asia Pacific Water Damage Restoration Revenue (million), by Country 2025 & 2033
- Figure 31: Asia Pacific Water Damage Restoration Revenue Share (%), by Country 2025 & 2033
List of Tables
- Table 1: Global Water Damage Restoration Revenue million Forecast, by Application 2020 & 2033
- Table 2: Global Water Damage Restoration Revenue million Forecast, by Type 2020 & 2033
- Table 3: Global Water Damage Restoration Revenue million Forecast, by Region 2020 & 2033
- Table 4: Global Water Damage Restoration Revenue million Forecast, by Application 2020 & 2033
- Table 5: Global Water Damage Restoration Revenue million Forecast, by Type 2020 & 2033
- Table 6: Global Water Damage Restoration Revenue million Forecast, by Country 2020 & 2033
- Table 7: United States Water Damage Restoration Revenue (million) Forecast, by Application 2020 & 2033
- Table 8: Canada Water Damage Restoration Revenue (million) Forecast, by Application 2020 & 2033
- Table 9: Mexico Water Damage Restoration Revenue (million) Forecast, by Application 2020 & 2033
- Table 10: Global Water Damage Restoration Revenue million Forecast, by Application 2020 & 2033
- Table 11: Global Water Damage Restoration Revenue million Forecast, by Type 2020 & 2033
- Table 12: Global Water Damage Restoration Revenue million Forecast, by Country 2020 & 2033
- Table 13: Brazil Water Damage Restoration Revenue (million) Forecast, by Application 2020 & 2033
- Table 14: Argentina Water Damage Restoration Revenue (million) Forecast, by Application 2020 & 2033
- Table 15: Rest of South America Water Damage Restoration Revenue (million) Forecast, by Application 2020 & 2033
- Table 16: Global Water Damage Restoration Revenue million Forecast, by Application 2020 & 2033
- Table 17: Global Water Damage Restoration Revenue million Forecast, by Type 2020 & 2033
- Table 18: Global Water Damage Restoration Revenue million Forecast, by Country 2020 & 2033
- Table 19: United Kingdom Water Damage Restoration Revenue (million) Forecast, by Application 2020 & 2033
- Table 20: Germany Water Damage Restoration Revenue (million) Forecast, by Application 2020 & 2033
- Table 21: France Water Damage Restoration Revenue (million) Forecast, by Application 2020 & 2033
- Table 22: Italy Water Damage Restoration Revenue (million) Forecast, by Application 2020 & 2033
- Table 23: Spain Water Damage Restoration Revenue (million) Forecast, by Application 2020 & 2033
- Table 24: Russia Water Damage Restoration Revenue (million) Forecast, by Application 2020 & 2033
- Table 25: Benelux Water Damage Restoration Revenue (million) Forecast, by Application 2020 & 2033
- Table 26: Nordics Water Damage Restoration Revenue (million) Forecast, by Application 2020 & 2033
- Table 27: Rest of Europe Water Damage Restoration Revenue (million) Forecast, by Application 2020 & 2033
- Table 28: Global Water Damage Restoration Revenue million Forecast, by Application 2020 & 2033
- Table 29: Global Water Damage Restoration Revenue million Forecast, by Type 2020 & 2033
- Table 30: Global Water Damage Restoration Revenue million Forecast, by Country 2020 & 2033
- Table 31: Turkey Water Damage Restoration Revenue (million) Forecast, by Application 2020 & 2033
- Table 32: Israel Water Damage Restoration Revenue (million) Forecast, by Application 2020 & 2033
- Table 33: GCC Water Damage Restoration Revenue (million) Forecast, by Application 2020 & 2033
- Table 34: North Africa Water Damage Restoration Revenue (million) Forecast, by Application 2020 & 2033
- Table 35: South Africa Water Damage Restoration Revenue (million) Forecast, by Application 2020 & 2033
- Table 36: Rest of Middle East & Africa Water Damage Restoration Revenue (million) Forecast, by Application 2020 & 2033
- Table 37: Global Water Damage Restoration Revenue million Forecast, by Application 2020 & 2033
- Table 38: Global Water Damage Restoration Revenue million Forecast, by Type 2020 & 2033
- Table 39: Global Water Damage Restoration Revenue million Forecast, by Country 2020 & 2033
- Table 40: China Water Damage Restoration Revenue (million) Forecast, by Application 2020 & 2033
- Table 41: India Water Damage Restoration Revenue (million) Forecast, by Application 2020 & 2033
- Table 42: Japan Water Damage Restoration Revenue (million) Forecast, by Application 2020 & 2033
- Table 43: South Korea Water Damage Restoration Revenue (million) Forecast, by Application 2020 & 2033
- Table 44: ASEAN Water Damage Restoration Revenue (million) Forecast, by Application 2020 & 2033
- Table 45: Oceania Water Damage Restoration Revenue (million) Forecast, by Application 2020 & 2033
- Table 46: Rest of Asia Pacific Water Damage Restoration Revenue (million) Forecast, by Application 2020 & 2033
Frequently Asked Questions
1. What is the projected Compound Annual Growth Rate (CAGR) of the Water Damage Restoration?
The projected CAGR is approximately 4.1%.
2. Which companies are prominent players in the Water Damage Restoration?
Key companies in the market include SERVPRO, Spaulding Decon, Paul Davis, ServiceMaster of Lake Shore, BELFOR, BioteamAZ, Brooks Remediation, Cotton Global Disaster Solutions, ServiceMaster Restore, SI Restoration, New Life Restoration, Elite Restoration, ThriveStar Restoration, Virginia Restoration Services, DAI Restore, Rainbow Restoration, ATI Restoration, Premier Restoration & Construction, First Onsite, Paul Davis Restoration, Blackmon Mooring & BMS CAT, Restoration Management Company.
3. What are the main segments of the Water Damage Restoration?
The market segments include Application, Type.
4. Can you provide details about the market size?
The market size is estimated to be USD 5899 million as of 2022.
5. What are some drivers contributing to market growth?
N/A
6. What are the notable trends driving market growth?
N/A
7. Are there any restraints impacting market growth?
N/A
8. Can you provide examples of recent developments in the market?
N/A
9. What pricing options are available for accessing the report?
Pricing options include single-user, multi-user, and enterprise licenses priced at USD 2900.00, USD 4350.00, and USD 5800.00 respectively.
10. Is the market size provided in terms of value or volume?
The market size is provided in terms of value, measured in million.
11. Are there any specific market keywords associated with the report?
Yes, the market keyword associated with the report is "Water Damage Restoration," which aids in identifying and referencing the specific market segment covered.
12. How do I determine which pricing option suits my needs best?
The pricing options vary based on user requirements and access needs. Individual users may opt for single-user licenses, while businesses requiring broader access may choose multi-user or enterprise licenses for cost-effective access to the report.
13. Are there any additional resources or data provided in the Water Damage Restoration report?
While the report offers comprehensive insights, it's advisable to review the specific contents or supplementary materials provided to ascertain if additional resources or data are available.
14. How can I stay updated on further developments or reports in the Water Damage Restoration?
To stay informed about further developments, trends, and reports in the Water Damage Restoration, consider subscribing to industry newsletters, following relevant companies and organizations, or regularly checking reputable industry news sources and publications.
Methodology
Step 1 - Identification of Relevant Samples Size from Population Database


Step 2 - Approaches for Defining Global Market Size (Value, Volume* & Price*)

Note*: In applicable scenarios
Step 3 - Data Sources
Primary Research
- Web Analytics
- Survey Reports
- Research Institute
- Latest Research Reports
- Opinion Leaders
Secondary Research
- Annual Reports
- White Paper
- Latest Press Release
- Industry Association
- Paid Database
- Investor Presentations

Step 4 - Data Triangulation
Involves using different sources of information in order to increase the validity of a study
These sources are likely to be stakeholders in a program - participants, other researchers, program staff, other community members, and so on.
Then we put all data in single framework & apply various statistical tools to find out the dynamic on the market.
During the analysis stage, feedback from the stakeholder groups would be compared to determine areas of agreement as well as areas of divergence