

Key Insights
The global Vessel Traffic Management Service (VTMS) market is poised for significant expansion, projected to reach $1496.3 million in 2025 and grow at a robust Compound Annual Growth Rate (CAGR) of 5.9% through 2033. This growth is driven by an increasing emphasis on maritime safety, security, and efficiency, fueled by rising global trade volumes and the consequential increase in vessel traffic. Key applications within this market include the critical Petroleum and Natural Gas sector, where the safe and efficient movement of tankers is paramount, as well as vital areas like Fish Farms, Marine Protected Areas, and Ports, all of which benefit from enhanced surveillance and management capabilities. The market’s expansion is further propelled by technological advancements in radar, AIS, and communication systems, enabling more sophisticated monitoring and control of maritime operations. Furthermore, stringent regulations and international maritime conventions mandating improved vessel traffic management are acting as significant catalysts for market adoption.
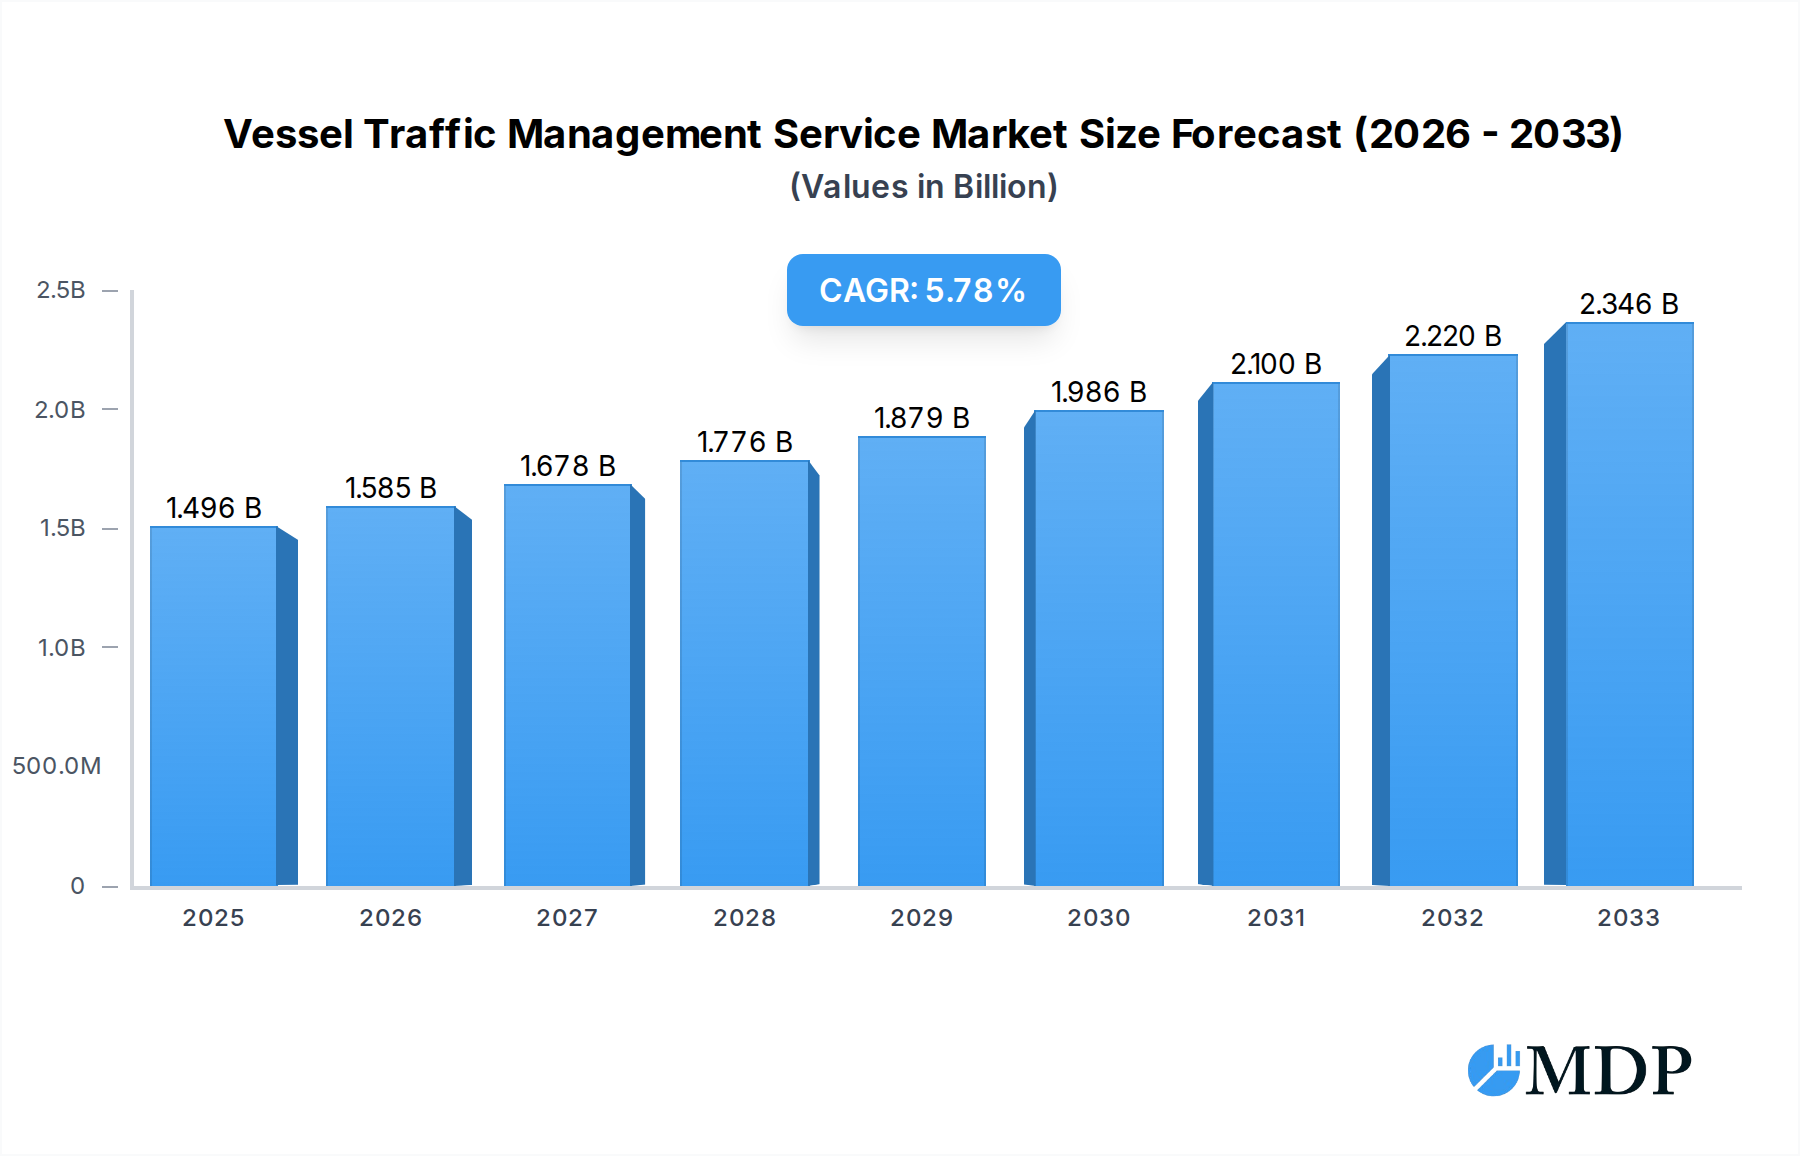
Vessel Traffic Management Service Market Size (In Billion)
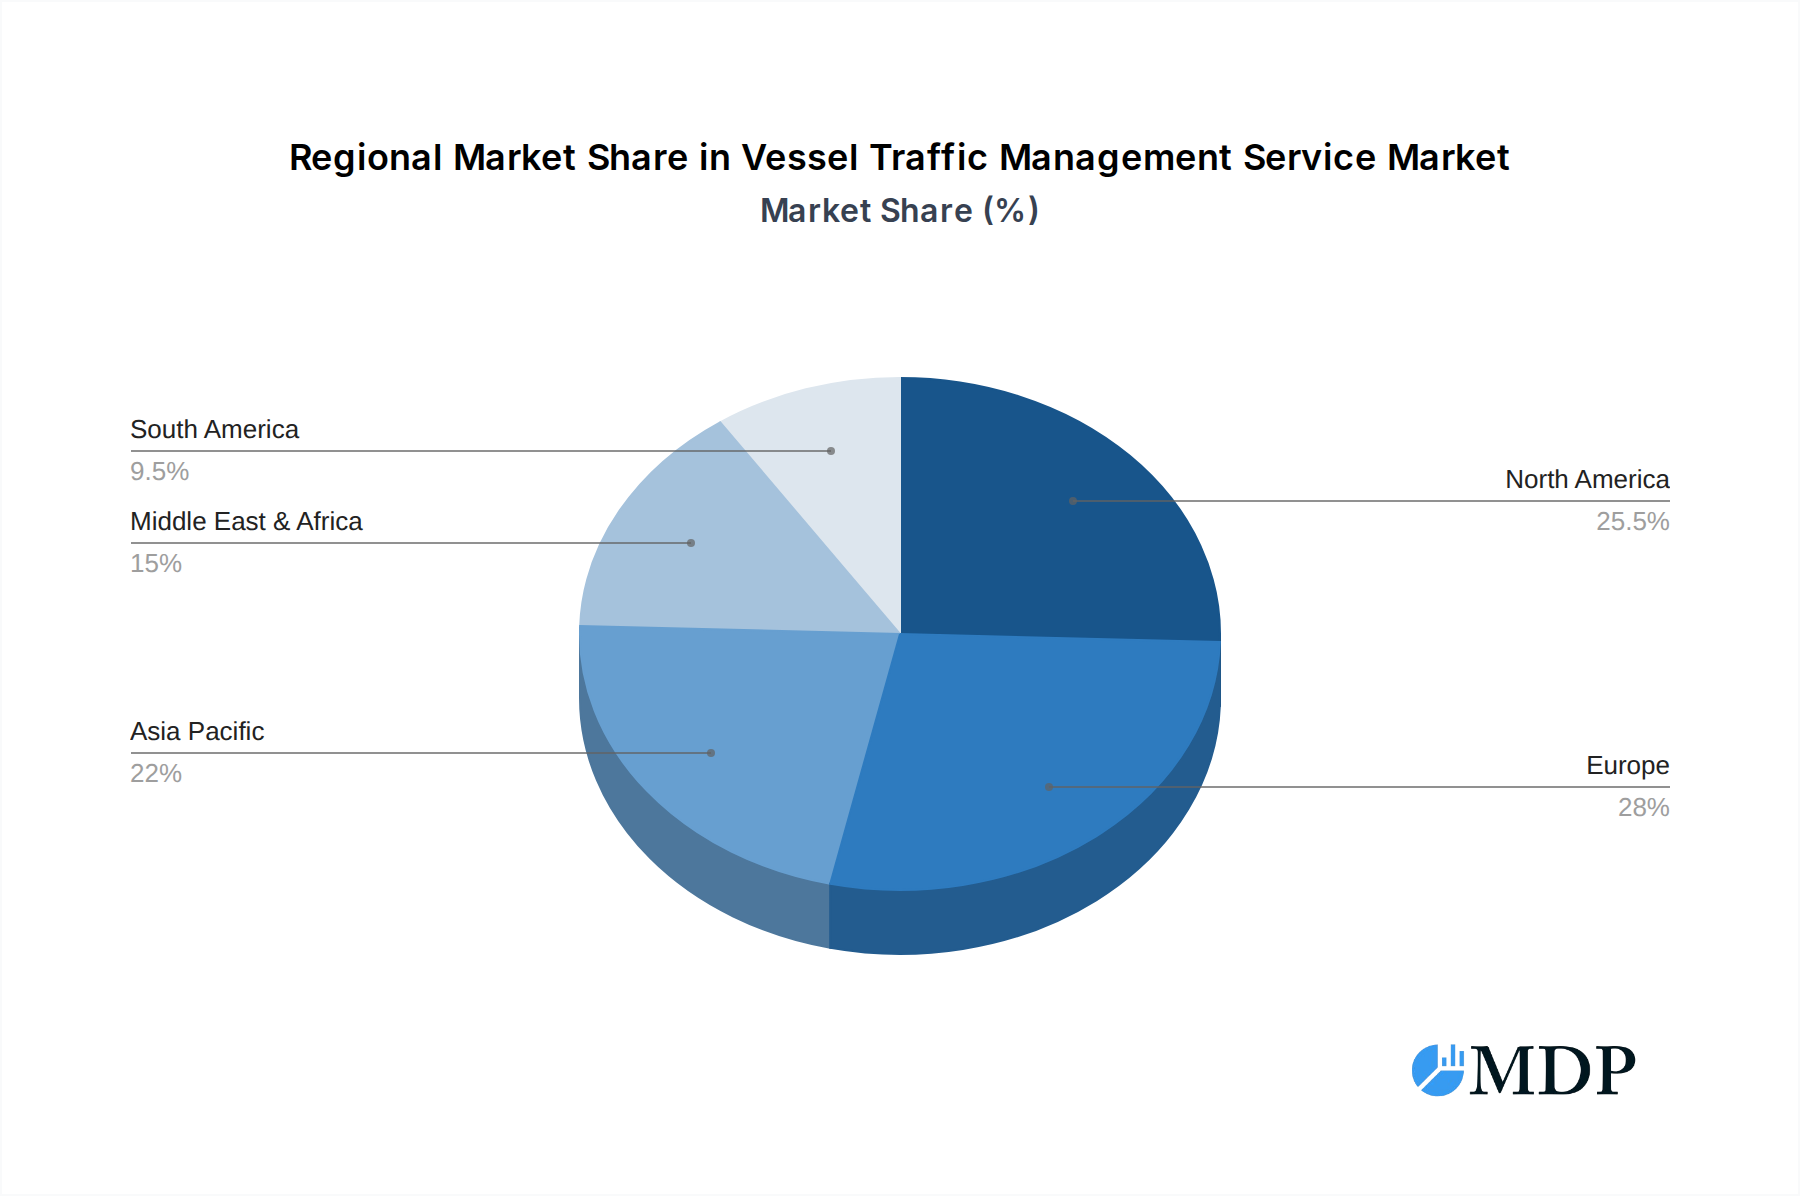
The VTMS market is segmented into Equipment Services and Technical Services, reflecting the comprehensive support required for these complex systems. Leading companies such as Tokyo Keiki, Thales Group, and Saab are at the forefront, offering innovative solutions that address the evolving needs of maritime authorities and operators. Geographically, North America and Europe currently represent substantial markets due to their developed maritime infrastructure and strict regulatory frameworks. However, the Asia Pacific region is anticipated to witness the fastest growth, driven by rapid economic development, expanding port facilities, and increasing investments in maritime surveillance and safety in countries like China and India. Emerging trends like the integration of AI and machine learning for predictive analytics and autonomous vessel navigation are set to redefine the VTMS landscape, offering enhanced operational efficiency and risk mitigation. The market’s trajectory is indicative of a strong and sustained demand for advanced maritime management solutions.

Vessel Traffic Management Service Company Market Share
Vessel Traffic Management Service Market Report Description
This comprehensive Vessel Traffic Management Service (VTMS) market report provides an in-depth analysis of the global VTMS industry from 2019 to 2033, with a base year of 2025 and a forecast period extending to 2033. The report offers critical insights into market dynamics, industry trends, leading markets, product developments, growth drivers, challenges, emerging opportunities, key players, and strategic outlooks. Leveraging high-traffic keywords such as "maritime safety," "port security," "ship tracking," "maritime surveillance," "AIS technology," and "VTS systems," this report is optimized for maximum search visibility among industry stakeholders, including port authorities, maritime operators, technology providers, and government agencies. Discover market size projections, technological advancements, and competitive landscapes shaping the future of vessel traffic management.
Vessel Traffic Management Service Market Dynamics & Concentration
The global Vessel Traffic Management Service (VTMS) market exhibits a moderately concentrated landscape, with key players like Thales Group, Saab, and Kongsberg Gruppen holding significant market shares. Innovation drivers are primarily fueled by advancements in radar technology, Automatic Identification System (AIS) integration, and the increasing demand for integrated maritime surveillance solutions. Regulatory frameworks, such as those mandated by the International Maritime Organization (IMO) and national maritime administrations, play a crucial role in shaping market growth and adoption rates. Product substitutes, while limited in core VTMS functionalities, can include enhanced manual monitoring or fragmented digital solutions. End-user trends reveal a growing preference for AI-powered analytics, predictive maintenance for VTMS equipment, and cloud-based solutions for enhanced data accessibility and collaboration. Mergers and acquisitions (M&A) activities have been observed, with an estimated 15-20 M&A deals recorded during the historical period, aimed at consolidating market presence and expanding technological capabilities. The market size is projected to reach an estimated 15,000 million by the forecast year.
Vessel Traffic Management Service Industry Trends & Analysis
The Vessel Traffic Management Service (VTMS) industry is experiencing robust growth, driven by escalating maritime traffic, the imperative for enhanced maritime safety and security, and stringent governmental regulations. The estimated market size in 2025 stands at 10,000 million, projected to ascend to 15,000 million by 2033, exhibiting a Compound Annual Growth Rate (CAGR) of approximately 5.2%. Technological disruptions are central to this expansion, with the integration of Artificial Intelligence (AI) and Machine Learning (ML) revolutionizing data analysis for predictive capabilities, anomaly detection, and route optimization. The widespread adoption of advanced sensor technologies, including high-resolution radar, electro-optical/infrared (EO/IR) systems, and satellite-based surveillance, is enhancing the accuracy and scope of maritime monitoring. Consumer preferences are leaning towards sophisticated, integrated VTMS solutions that offer end-to-end visibility, real-time data processing, and seamless communication capabilities. Competitive dynamics are intensifying, with established players continuously investing in research and development to offer next-generation VTMS solutions. Market penetration for advanced VTMS technologies is expected to rise significantly, particularly in regions with high maritime activity and stringent safety regulations. The focus is shifting from basic ship tracking to comprehensive maritime domain awareness, encompassing environmental monitoring, search and rescue operations, and anti-piracy measures. The ongoing digitalization of maritime operations and the increasing complexity of global supply chains further underscore the critical role of effective VTMS in ensuring smooth and secure maritime operations.
Leading Markets & Segments in Vessel Traffic Management Service
The Port segment of the Vessel Traffic Management Service (VTMS) market is currently the dominant force, driven by the critical need for efficient and secure operations within major global shipping hubs. Countries like Singapore, Rotterdam, Shanghai, and Los Angeles are at the forefront of VTMS adoption, investing heavily in advanced systems to manage their high vessel throughput. Economic policies promoting trade facilitation and infrastructure development in these port regions directly fuel the demand for sophisticated VTMS solutions. The Type: Technical Service segment is also experiencing significant growth, as port authorities and maritime operators increasingly seek specialized expertise for the installation, maintenance, and upgrading of complex VTMS systems.
Dominance of the Port Segment:
- Key Drivers: High vessel traffic density, need for collision avoidance, enhanced port security, efficient berth management, and compliance with international maritime regulations.
- Economic Impact: Efficient port operations managed by VTMS contribute billions to global trade, necessitating reliable and advanced traffic management. For instance, the Port of Singapore handles over 100,000 vessel calls annually, requiring a robust VTMS.
- Infrastructure Investment: Significant investments in smart port technologies, including advanced radar, AIS integration, and communication networks, are directly benefiting the VTMS market within this segment.
Growth in Technical Services:
- Key Drivers: Complexity of modern VTMS equipment, need for specialized expertise, ongoing software updates and system integration, and the lifecycle management of VTMS infrastructure.
- Market Value: The technical services segment is estimated to account for approximately 30-40% of the overall VTMS market value, with projected revenues in the millions for major service providers.
- Technological Advancements: The rapid evolution of VTMS technology necessitates continuous training and support, driving demand for skilled technical service providers.
The Petroleum and Natural Gas application segment also represents a substantial market, with VTMS crucial for the safe navigation of tankers and offshore support vessels in sensitive environments. Marine Protected Areas are also seeing increased adoption of VTMS for monitoring and enforcing regulations, safeguarding delicate ecosystems.
Vessel Traffic Management Service Product Developments
Recent product developments in the Vessel Traffic Management Service (VTMS) sector are characterized by enhanced integration, AI-driven analytics, and improved sensor fusion. Companies are focusing on creating modular and scalable VTMS solutions that can be tailored to specific port or coastal region needs. Innovations include advanced radar systems with better target discrimination in adverse weather conditions, sophisticated AIS data processing for enhanced vessel tracking, and the incorporation of predictive analytics to anticipate potential hazards. The competitive advantage lies in offering comprehensive situational awareness, real-time threat assessment, and seamless data sharing across different maritime stakeholders.
Key Drivers of Vessel Traffic Management Service Growth
The Vessel Traffic Management Service (VTMS) market is propelled by several key drivers. Technological advancements, such as the refinement of AI algorithms for predictive analytics and the development of more accurate radar and sensor technologies, are enhancing VTMS capabilities. Stringent regulatory frameworks enacted by international bodies like the IMO, mandating improved maritime safety and security, are a significant growth catalyst. Furthermore, the increasing volume of global maritime trade and the associated rise in vessel traffic necessitate more sophisticated management systems. The growing awareness of environmental protection and the need to monitor vessel activity in sensitive marine areas also contribute to market expansion.
Challenges in the Vessel Traffic Management Service Market
The Vessel Traffic Management Service (VTMS) market faces several challenges. High initial investment costs for sophisticated VTMS infrastructure can be a barrier, particularly for smaller ports or developing nations. Regulatory hurdles and the complexity of cross-border data sharing can slow down the implementation and integration of global VTMS solutions. Cybersecurity threats are a growing concern, requiring robust protective measures for critical maritime infrastructure. Supply chain issues impacting the availability of specialized electronic components can also lead to project delays and increased costs. Competitive pressures from established players and emerging technologies also present ongoing challenges for market participants.
Emerging Opportunities in Vessel Traffic Management Service
Emerging opportunities in the Vessel Traffic Management Service (VTMS) market are largely driven by technological breakthroughs and strategic market expansion. The integration of IoT devices and the development of smart ports offer immense potential for enhanced data collection and analysis. Strategic partnerships between VTMS providers and satellite technology companies are creating new avenues for comprehensive maritime surveillance. Furthermore, the growing demand for VTMS solutions in emerging economies and for specialized applications such as offshore wind farm management presents significant growth avenues. The increasing focus on sustainability and environmental monitoring within maritime operations also opens doors for innovative VTMS applications.
Leading Players in the Vessel Traffic Management Service Sector
- Tokyo Keiki
- Thales Group
- Transas
- Saab
- Kongsberg Gruppen
- L3 Technologies
- Kelvin Hughes
- Leonardo
- Rolta India
- Indra Sistemas
- Signalis
- Frequentis
- Terma
- Vissim
- Wärtsilä
Key Milestones in Vessel Traffic Management Service Industry
- 2019: Launch of advanced AI-powered predictive analytics tools for collision avoidance by major VTMS providers.
- 2020: Increased adoption of cloud-based VTMS solutions for enhanced data accessibility and collaboration.
- 2021: Significant investments in maritime surveillance technologies for enhanced port security and environmental monitoring.
- 2022: Introduction of integrated VTMS platforms combining radar, AIS, and satellite data for comprehensive maritime domain awareness.
- 2023: Growing demand for VTMS solutions in emerging markets and for offshore infrastructure protection.
- 2024: Focus on cybersecurity enhancements for critical VTMS infrastructure amidst rising threats.
Strategic Outlook for Vessel Traffic Management Service Market
The strategic outlook for the Vessel Traffic Management Service (VTMS) market is exceptionally positive, driven by continuous technological innovation and the escalating global demand for maritime safety and efficiency. Growth accelerators include the pervasive integration of AI and machine learning for predictive analysis, the expansion of smart port initiatives, and the increasing adoption of advanced sensor fusion technologies. Strategic opportunities lie in catering to the growing needs of emerging economies, developing specialized VTMS solutions for offshore renewable energy infrastructure, and fostering collaborations to enhance global maritime situational awareness. The market is poised for sustained expansion as maritime authorities and operators prioritize robust, intelligent, and integrated vessel traffic management systems.
Vessel Traffic Management Service Segmentation
-
1. Application
- 1.1. Petroleum and Natural Gas
- 1.2. Fish Farm
- 1.3. Marine Protected Area
- 1.4. Port
-
2. Type
- 2.1. Equipment Service
- 2.2. Technical Service
Vessel Traffic Management Service Segmentation By Geography
-
1. North America
- 1.1. United States
- 1.2. Canada
- 1.3. Mexico
-
2. South America
- 2.1. Brazil
- 2.2. Argentina
- 2.3. Rest of South America
-
3. Europe
- 3.1. United Kingdom
- 3.2. Germany
- 3.3. France
- 3.4. Italy
- 3.5. Spain
- 3.6. Russia
- 3.7. Benelux
- 3.8. Nordics
- 3.9. Rest of Europe
-
4. Middle East & Africa
- 4.1. Turkey
- 4.2. Israel
- 4.3. GCC
- 4.4. North Africa
- 4.5. South Africa
- 4.6. Rest of Middle East & Africa
-
5. Asia Pacific
- 5.1. China
- 5.2. India
- 5.3. Japan
- 5.4. South Korea
- 5.5. ASEAN
- 5.6. Oceania
- 5.7. Rest of Asia Pacific
Vessel Traffic Management Service Regional Market Share
Geographic Coverage of Vessel Traffic Management Service
Vessel Traffic Management Service REPORT HIGHLIGHTS
| Aspects | Details |
|---|---|
| Study Period | 2020-2034 |
| Base Year | 2025 |
| Estimated Year | 2026 |
| Forecast Period | 2026-2034 |
| Historical Period | 2020-2025 |
| Growth Rate | CAGR of 5.9% from 2020-2034 |
| Segmentation |
|
Table of Contents
- 1. Introduction
- 1.1. Research Scope
- 1.2. Market Segmentation
- 1.3. Research Methodology
- 1.4. Definitions and Assumptions
- 2. Executive Summary
- 2.1. Introduction
- 3. Market Dynamics
- 3.1. Introduction
- 3.2. Market Drivers
- 3.3. Market Restrains
- 3.4. Market Trends
- 4. Market Factor Analysis
- 4.1. Porters Five Forces
- 4.2. Supply/Value Chain
- 4.3. PESTEL analysis
- 4.4. Market Entropy
- 4.5. Patent/Trademark Analysis
- 5. Global Vessel Traffic Management Service Analysis, Insights and Forecast, 2020-2032
- 5.1. Market Analysis, Insights and Forecast - by Application
- 5.1.1. Petroleum and Natural Gas
- 5.1.2. Fish Farm
- 5.1.3. Marine Protected Area
- 5.1.4. Port
- 5.2. Market Analysis, Insights and Forecast - by Type
- 5.2.1. Equipment Service
- 5.2.2. Technical Service
- 5.3. Market Analysis, Insights and Forecast - by Region
- 5.3.1. North America
- 5.3.2. South America
- 5.3.3. Europe
- 5.3.4. Middle East & Africa
- 5.3.5. Asia Pacific
- 5.1. Market Analysis, Insights and Forecast - by Application
- 6. North America Vessel Traffic Management Service Analysis, Insights and Forecast, 2020-2032
- 6.1. Market Analysis, Insights and Forecast - by Application
- 6.1.1. Petroleum and Natural Gas
- 6.1.2. Fish Farm
- 6.1.3. Marine Protected Area
- 6.1.4. Port
- 6.2. Market Analysis, Insights and Forecast - by Type
- 6.2.1. Equipment Service
- 6.2.2. Technical Service
- 6.1. Market Analysis, Insights and Forecast - by Application
- 7. South America Vessel Traffic Management Service Analysis, Insights and Forecast, 2020-2032
- 7.1. Market Analysis, Insights and Forecast - by Application
- 7.1.1. Petroleum and Natural Gas
- 7.1.2. Fish Farm
- 7.1.3. Marine Protected Area
- 7.1.4. Port
- 7.2. Market Analysis, Insights and Forecast - by Type
- 7.2.1. Equipment Service
- 7.2.2. Technical Service
- 7.1. Market Analysis, Insights and Forecast - by Application
- 8. Europe Vessel Traffic Management Service Analysis, Insights and Forecast, 2020-2032
- 8.1. Market Analysis, Insights and Forecast - by Application
- 8.1.1. Petroleum and Natural Gas
- 8.1.2. Fish Farm
- 8.1.3. Marine Protected Area
- 8.1.4. Port
- 8.2. Market Analysis, Insights and Forecast - by Type
- 8.2.1. Equipment Service
- 8.2.2. Technical Service
- 8.1. Market Analysis, Insights and Forecast - by Application
- 9. Middle East & Africa Vessel Traffic Management Service Analysis, Insights and Forecast, 2020-2032
- 9.1. Market Analysis, Insights and Forecast - by Application
- 9.1.1. Petroleum and Natural Gas
- 9.1.2. Fish Farm
- 9.1.3. Marine Protected Area
- 9.1.4. Port
- 9.2. Market Analysis, Insights and Forecast - by Type
- 9.2.1. Equipment Service
- 9.2.2. Technical Service
- 9.1. Market Analysis, Insights and Forecast - by Application
- 10. Asia Pacific Vessel Traffic Management Service Analysis, Insights and Forecast, 2020-2032
- 10.1. Market Analysis, Insights and Forecast - by Application
- 10.1.1. Petroleum and Natural Gas
- 10.1.2. Fish Farm
- 10.1.3. Marine Protected Area
- 10.1.4. Port
- 10.2. Market Analysis, Insights and Forecast - by Type
- 10.2.1. Equipment Service
- 10.2.2. Technical Service
- 10.1. Market Analysis, Insights and Forecast - by Application
- 11. Competitive Analysis
- 11.1. Global Market Share Analysis 2025
- 11.2. Company Profiles
- 11.2.1 Tokyo Keiki
- 11.2.1.1. Overview
- 11.2.1.2. Products
- 11.2.1.3. SWOT Analysis
- 11.2.1.4. Recent Developments
- 11.2.1.5. Financials (Based on Availability)
- 11.2.2 Thales Group
- 11.2.2.1. Overview
- 11.2.2.2. Products
- 11.2.2.3. SWOT Analysis
- 11.2.2.4. Recent Developments
- 11.2.2.5. Financials (Based on Availability)
- 11.2.3 Transas
- 11.2.3.1. Overview
- 11.2.3.2. Products
- 11.2.3.3. SWOT Analysis
- 11.2.3.4. Recent Developments
- 11.2.3.5. Financials (Based on Availability)
- 11.2.4 Saab
- 11.2.4.1. Overview
- 11.2.4.2. Products
- 11.2.4.3. SWOT Analysis
- 11.2.4.4. Recent Developments
- 11.2.4.5. Financials (Based on Availability)
- 11.2.5 Kongsberg Gruppen
- 11.2.5.1. Overview
- 11.2.5.2. Products
- 11.2.5.3. SWOT Analysis
- 11.2.5.4. Recent Developments
- 11.2.5.5. Financials (Based on Availability)
- 11.2.6 L3 Technologies
- 11.2.6.1. Overview
- 11.2.6.2. Products
- 11.2.6.3. SWOT Analysis
- 11.2.6.4. Recent Developments
- 11.2.6.5. Financials (Based on Availability)
- 11.2.7 Kelvin Hughes
- 11.2.7.1. Overview
- 11.2.7.2. Products
- 11.2.7.3. SWOT Analysis
- 11.2.7.4. Recent Developments
- 11.2.7.5. Financials (Based on Availability)
- 11.2.8 Leonardo
- 11.2.8.1. Overview
- 11.2.8.2. Products
- 11.2.8.3. SWOT Analysis
- 11.2.8.4. Recent Developments
- 11.2.8.5. Financials (Based on Availability)
- 11.2.9 Rolta India
- 11.2.9.1. Overview
- 11.2.9.2. Products
- 11.2.9.3. SWOT Analysis
- 11.2.9.4. Recent Developments
- 11.2.9.5. Financials (Based on Availability)
- 11.2.10 Indra Sistemas
- 11.2.10.1. Overview
- 11.2.10.2. Products
- 11.2.10.3. SWOT Analysis
- 11.2.10.4. Recent Developments
- 11.2.10.5. Financials (Based on Availability)
- 11.2.11 Signalis
- 11.2.11.1. Overview
- 11.2.11.2. Products
- 11.2.11.3. SWOT Analysis
- 11.2.11.4. Recent Developments
- 11.2.11.5. Financials (Based on Availability)
- 11.2.12 Frequentis
- 11.2.12.1. Overview
- 11.2.12.2. Products
- 11.2.12.3. SWOT Analysis
- 11.2.12.4. Recent Developments
- 11.2.12.5. Financials (Based on Availability)
- 11.2.13 Terma
- 11.2.13.1. Overview
- 11.2.13.2. Products
- 11.2.13.3. SWOT Analysis
- 11.2.13.4. Recent Developments
- 11.2.13.5. Financials (Based on Availability)
- 11.2.14 Vissim
- 11.2.14.1. Overview
- 11.2.14.2. Products
- 11.2.14.3. SWOT Analysis
- 11.2.14.4. Recent Developments
- 11.2.14.5. Financials (Based on Availability)
- 11.2.15 Wärtsilä
- 11.2.15.1. Overview
- 11.2.15.2. Products
- 11.2.15.3. SWOT Analysis
- 11.2.15.4. Recent Developments
- 11.2.15.5. Financials (Based on Availability)
- 11.2.1 Tokyo Keiki
List of Figures
- Figure 1: Global Vessel Traffic Management Service Revenue Breakdown (undefined, %) by Region 2025 & 2033
- Figure 2: North America Vessel Traffic Management Service Revenue (undefined), by Application 2025 & 2033
- Figure 3: North America Vessel Traffic Management Service Revenue Share (%), by Application 2025 & 2033
- Figure 4: North America Vessel Traffic Management Service Revenue (undefined), by Type 2025 & 2033
- Figure 5: North America Vessel Traffic Management Service Revenue Share (%), by Type 2025 & 2033
- Figure 6: North America Vessel Traffic Management Service Revenue (undefined), by Country 2025 & 2033
- Figure 7: North America Vessel Traffic Management Service Revenue Share (%), by Country 2025 & 2033
- Figure 8: South America Vessel Traffic Management Service Revenue (undefined), by Application 2025 & 2033
- Figure 9: South America Vessel Traffic Management Service Revenue Share (%), by Application 2025 & 2033
- Figure 10: South America Vessel Traffic Management Service Revenue (undefined), by Type 2025 & 2033
- Figure 11: South America Vessel Traffic Management Service Revenue Share (%), by Type 2025 & 2033
- Figure 12: South America Vessel Traffic Management Service Revenue (undefined), by Country 2025 & 2033
- Figure 13: South America Vessel Traffic Management Service Revenue Share (%), by Country 2025 & 2033
- Figure 14: Europe Vessel Traffic Management Service Revenue (undefined), by Application 2025 & 2033
- Figure 15: Europe Vessel Traffic Management Service Revenue Share (%), by Application 2025 & 2033
- Figure 16: Europe Vessel Traffic Management Service Revenue (undefined), by Type 2025 & 2033
- Figure 17: Europe Vessel Traffic Management Service Revenue Share (%), by Type 2025 & 2033
- Figure 18: Europe Vessel Traffic Management Service Revenue (undefined), by Country 2025 & 2033
- Figure 19: Europe Vessel Traffic Management Service Revenue Share (%), by Country 2025 & 2033
- Figure 20: Middle East & Africa Vessel Traffic Management Service Revenue (undefined), by Application 2025 & 2033
- Figure 21: Middle East & Africa Vessel Traffic Management Service Revenue Share (%), by Application 2025 & 2033
- Figure 22: Middle East & Africa Vessel Traffic Management Service Revenue (undefined), by Type 2025 & 2033
- Figure 23: Middle East & Africa Vessel Traffic Management Service Revenue Share (%), by Type 2025 & 2033
- Figure 24: Middle East & Africa Vessel Traffic Management Service Revenue (undefined), by Country 2025 & 2033
- Figure 25: Middle East & Africa Vessel Traffic Management Service Revenue Share (%), by Country 2025 & 2033
- Figure 26: Asia Pacific Vessel Traffic Management Service Revenue (undefined), by Application 2025 & 2033
- Figure 27: Asia Pacific Vessel Traffic Management Service Revenue Share (%), by Application 2025 & 2033
- Figure 28: Asia Pacific Vessel Traffic Management Service Revenue (undefined), by Type 2025 & 2033
- Figure 29: Asia Pacific Vessel Traffic Management Service Revenue Share (%), by Type 2025 & 2033
- Figure 30: Asia Pacific Vessel Traffic Management Service Revenue (undefined), by Country 2025 & 2033
- Figure 31: Asia Pacific Vessel Traffic Management Service Revenue Share (%), by Country 2025 & 2033
List of Tables
- Table 1: Global Vessel Traffic Management Service Revenue undefined Forecast, by Application 2020 & 2033
- Table 2: Global Vessel Traffic Management Service Revenue undefined Forecast, by Type 2020 & 2033
- Table 3: Global Vessel Traffic Management Service Revenue undefined Forecast, by Region 2020 & 2033
- Table 4: Global Vessel Traffic Management Service Revenue undefined Forecast, by Application 2020 & 2033
- Table 5: Global Vessel Traffic Management Service Revenue undefined Forecast, by Type 2020 & 2033
- Table 6: Global Vessel Traffic Management Service Revenue undefined Forecast, by Country 2020 & 2033
- Table 7: United States Vessel Traffic Management Service Revenue (undefined) Forecast, by Application 2020 & 2033
- Table 8: Canada Vessel Traffic Management Service Revenue (undefined) Forecast, by Application 2020 & 2033
- Table 9: Mexico Vessel Traffic Management Service Revenue (undefined) Forecast, by Application 2020 & 2033
- Table 10: Global Vessel Traffic Management Service Revenue undefined Forecast, by Application 2020 & 2033
- Table 11: Global Vessel Traffic Management Service Revenue undefined Forecast, by Type 2020 & 2033
- Table 12: Global Vessel Traffic Management Service Revenue undefined Forecast, by Country 2020 & 2033
- Table 13: Brazil Vessel Traffic Management Service Revenue (undefined) Forecast, by Application 2020 & 2033
- Table 14: Argentina Vessel Traffic Management Service Revenue (undefined) Forecast, by Application 2020 & 2033
- Table 15: Rest of South America Vessel Traffic Management Service Revenue (undefined) Forecast, by Application 2020 & 2033
- Table 16: Global Vessel Traffic Management Service Revenue undefined Forecast, by Application 2020 & 2033
- Table 17: Global Vessel Traffic Management Service Revenue undefined Forecast, by Type 2020 & 2033
- Table 18: Global Vessel Traffic Management Service Revenue undefined Forecast, by Country 2020 & 2033
- Table 19: United Kingdom Vessel Traffic Management Service Revenue (undefined) Forecast, by Application 2020 & 2033
- Table 20: Germany Vessel Traffic Management Service Revenue (undefined) Forecast, by Application 2020 & 2033
- Table 21: France Vessel Traffic Management Service Revenue (undefined) Forecast, by Application 2020 & 2033
- Table 22: Italy Vessel Traffic Management Service Revenue (undefined) Forecast, by Application 2020 & 2033
- Table 23: Spain Vessel Traffic Management Service Revenue (undefined) Forecast, by Application 2020 & 2033
- Table 24: Russia Vessel Traffic Management Service Revenue (undefined) Forecast, by Application 2020 & 2033
- Table 25: Benelux Vessel Traffic Management Service Revenue (undefined) Forecast, by Application 2020 & 2033
- Table 26: Nordics Vessel Traffic Management Service Revenue (undefined) Forecast, by Application 2020 & 2033
- Table 27: Rest of Europe Vessel Traffic Management Service Revenue (undefined) Forecast, by Application 2020 & 2033
- Table 28: Global Vessel Traffic Management Service Revenue undefined Forecast, by Application 2020 & 2033
- Table 29: Global Vessel Traffic Management Service Revenue undefined Forecast, by Type 2020 & 2033
- Table 30: Global Vessel Traffic Management Service Revenue undefined Forecast, by Country 2020 & 2033
- Table 31: Turkey Vessel Traffic Management Service Revenue (undefined) Forecast, by Application 2020 & 2033
- Table 32: Israel Vessel Traffic Management Service Revenue (undefined) Forecast, by Application 2020 & 2033
- Table 33: GCC Vessel Traffic Management Service Revenue (undefined) Forecast, by Application 2020 & 2033
- Table 34: North Africa Vessel Traffic Management Service Revenue (undefined) Forecast, by Application 2020 & 2033
- Table 35: South Africa Vessel Traffic Management Service Revenue (undefined) Forecast, by Application 2020 & 2033
- Table 36: Rest of Middle East & Africa Vessel Traffic Management Service Revenue (undefined) Forecast, by Application 2020 & 2033
- Table 37: Global Vessel Traffic Management Service Revenue undefined Forecast, by Application 2020 & 2033
- Table 38: Global Vessel Traffic Management Service Revenue undefined Forecast, by Type 2020 & 2033
- Table 39: Global Vessel Traffic Management Service Revenue undefined Forecast, by Country 2020 & 2033
- Table 40: China Vessel Traffic Management Service Revenue (undefined) Forecast, by Application 2020 & 2033
- Table 41: India Vessel Traffic Management Service Revenue (undefined) Forecast, by Application 2020 & 2033
- Table 42: Japan Vessel Traffic Management Service Revenue (undefined) Forecast, by Application 2020 & 2033
- Table 43: South Korea Vessel Traffic Management Service Revenue (undefined) Forecast, by Application 2020 & 2033
- Table 44: ASEAN Vessel Traffic Management Service Revenue (undefined) Forecast, by Application 2020 & 2033
- Table 45: Oceania Vessel Traffic Management Service Revenue (undefined) Forecast, by Application 2020 & 2033
- Table 46: Rest of Asia Pacific Vessel Traffic Management Service Revenue (undefined) Forecast, by Application 2020 & 2033
Frequently Asked Questions
1. What is the projected Compound Annual Growth Rate (CAGR) of the Vessel Traffic Management Service?
The projected CAGR is approximately 5.9%.
2. Which companies are prominent players in the Vessel Traffic Management Service?
Key companies in the market include Tokyo Keiki, Thales Group, Transas, Saab, Kongsberg Gruppen, L3 Technologies, Kelvin Hughes, Leonardo, Rolta India, Indra Sistemas, Signalis, Frequentis, Terma, Vissim, Wärtsilä.
3. What are the main segments of the Vessel Traffic Management Service?
The market segments include Application, Type.
4. Can you provide details about the market size?
The market size is estimated to be USD XXX N/A as of 2022.
5. What are some drivers contributing to market growth?
N/A
6. What are the notable trends driving market growth?
N/A
7. Are there any restraints impacting market growth?
N/A
8. Can you provide examples of recent developments in the market?
N/A
9. What pricing options are available for accessing the report?
Pricing options include single-user, multi-user, and enterprise licenses priced at USD 2900.00, USD 4350.00, and USD 5800.00 respectively.
10. Is the market size provided in terms of value or volume?
The market size is provided in terms of value, measured in N/A.
11. Are there any specific market keywords associated with the report?
Yes, the market keyword associated with the report is "Vessel Traffic Management Service," which aids in identifying and referencing the specific market segment covered.
12. How do I determine which pricing option suits my needs best?
The pricing options vary based on user requirements and access needs. Individual users may opt for single-user licenses, while businesses requiring broader access may choose multi-user or enterprise licenses for cost-effective access to the report.
13. Are there any additional resources or data provided in the Vessel Traffic Management Service report?
While the report offers comprehensive insights, it's advisable to review the specific contents or supplementary materials provided to ascertain if additional resources or data are available.
14. How can I stay updated on further developments or reports in the Vessel Traffic Management Service?
To stay informed about further developments, trends, and reports in the Vessel Traffic Management Service, consider subscribing to industry newsletters, following relevant companies and organizations, or regularly checking reputable industry news sources and publications.
Methodology
Step 1 - Identification of Relevant Samples Size from Population Database


Step 2 - Approaches for Defining Global Market Size (Value, Volume* & Price*)

Note*: In applicable scenarios
Step 3 - Data Sources
Primary Research
- Web Analytics
- Survey Reports
- Research Institute
- Latest Research Reports
- Opinion Leaders
Secondary Research
- Annual Reports
- White Paper
- Latest Press Release
- Industry Association
- Paid Database
- Investor Presentations

Step 4 - Data Triangulation
Involves using different sources of information in order to increase the validity of a study
These sources are likely to be stakeholders in a program - participants, other researchers, program staff, other community members, and so on.
Then we put all data in single framework & apply various statistical tools to find out the dynamic on the market.
During the analysis stage, feedback from the stakeholder groups would be compared to determine areas of agreement as well as areas of divergence