

Key Insights
The global surgical C-arm table market is experiencing robust growth, driven by the increasing prevalence of minimally invasive surgeries, technological advancements in imaging capabilities, and a rising demand for improved patient outcomes. The market is segmented by application (hospital, clinic, others) and type (removable, integrated), with hospitals currently dominating the application segment due to their higher surgical volumes and investment capacity. Removable C-arm tables are expected to maintain a larger market share due to their flexibility and adaptability to various surgical procedures and settings. Technological advancements, such as enhanced image clarity, reduced radiation exposure, and integration with advanced surgical navigation systems, are key drivers pushing market expansion. Furthermore, the growing adoption of robotic surgery and the increasing preference for advanced imaging techniques in complex surgical procedures are fueling market demand. Geographic expansion, particularly in emerging economies with improving healthcare infrastructure, also contributes to market growth. However, the high cost of C-arm tables and the need for specialized training to operate them are potential restraints. We project a steady CAGR of approximately 7% over the forecast period (2025-2033), resulting in substantial market expansion.
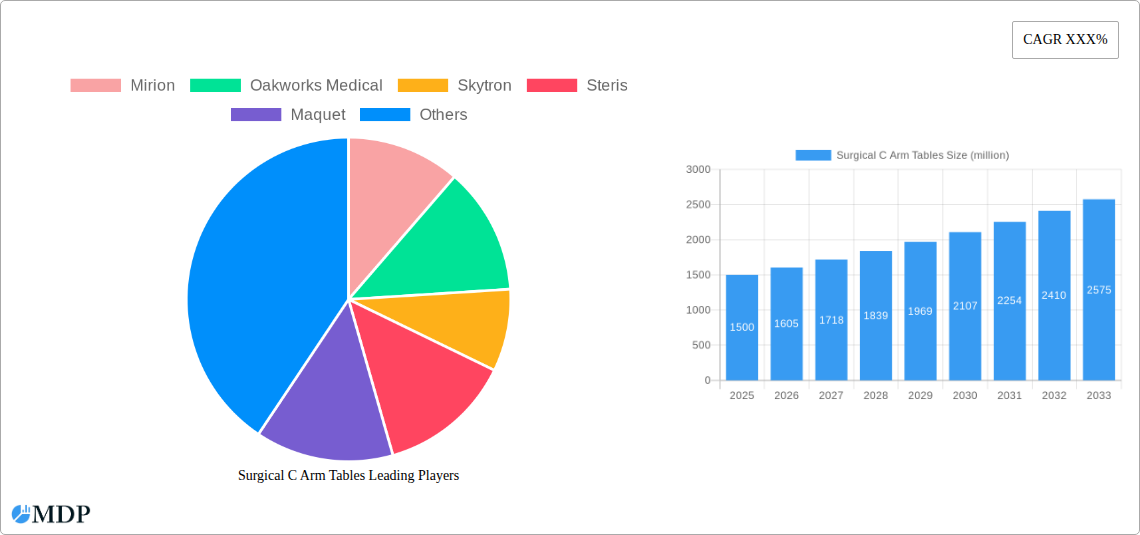
Surgical C Arm Tables Market Size (In Billion)
Competition in the surgical C-arm table market is intense, with a mix of established players like Stryker, Maquet, and Steris and smaller, specialized manufacturers. These companies are focusing on product innovation, strategic partnerships, and geographic expansion to gain a competitive edge. The market is expected to witness increased consolidation as companies seek to expand their product portfolio and market reach. Future growth will be significantly influenced by the continued adoption of minimally invasive surgical techniques, technological improvements in imaging technology, and regulatory approvals of new products. Factors such as economic conditions and healthcare spending trends in various regions will also play a vital role in shaping the market trajectory in the coming years. The increasing focus on patient safety and reduced radiation exposure will continue to drive demand for advanced features and improved ergonomics in C-arm tables.

Surgical C Arm Tables Company Market Share
Surgical C-Arm Tables Market Report: A Comprehensive Analysis (2019-2033)
This comprehensive report provides an in-depth analysis of the global surgical C-arm tables market, projecting a market value exceeding $XX million by 2033. The report covers the period from 2019 to 2033, with 2025 serving as the base and estimated year. This detailed study offers actionable insights for industry stakeholders, including manufacturers, distributors, and investors, to navigate the evolving market landscape. We explore key trends, competitive dynamics, and growth opportunities, providing a clear roadmap for success in this dynamic sector.
Surgical C Arm Tables Market Dynamics & Concentration
The global surgical C-arm tables market is characterized by a moderately concentrated competitive landscape, with key players such as Stryker, Maquet, and Steris holding significant market share. The market's concentration ratio (CR5) is estimated at xx%, indicating a moderate level of concentration. Innovation drives market growth, with ongoing developments in imaging technology, ergonomics, and integration with other surgical systems fueling demand. Stringent regulatory frameworks, particularly concerning medical device safety and efficacy, influence market dynamics. Substitutes, such as alternative imaging modalities, present competitive pressure. End-user trends, including a preference for minimally invasive procedures and improved patient outcomes, significantly influence market growth. M&A activity within the sector, while not exceptionally high (estimated xx deals between 2019-2024), has contributed to market consolidation and the introduction of new technologies. Market share fluctuations are anticipated with the introduction of new technologies and changing regulatory landscapes.
- Market Concentration: CR5 estimated at xx% in 2025.
- Innovation Drivers: Advancements in imaging technology, improved ergonomics, and system integration.
- Regulatory Frameworks: Stringent safety and efficacy standards governing medical device approvals.
- Product Substitutes: Alternative imaging modalities (e.g., ultrasound) pose competitive challenges.
- End-User Trends: Growing preference for minimally invasive surgeries, influencing demand.
- M&A Activity: Estimated xx merger and acquisition deals between 2019 and 2024.
Surgical C Arm Tables Industry Trends & Analysis
The surgical C-arm tables market is experiencing robust growth, projected to achieve a compound annual growth rate (CAGR) of xx% during the forecast period (2025-2033). This growth is fueled by several key factors: the increasing prevalence of minimally invasive surgical procedures globally, the rising demand for advanced imaging technologies in operating rooms, and technological advancements leading to more compact, versatile, and user-friendly C-arm tables. Market penetration of integrated C-arm tables is expected to increase significantly, driven by the advantages they offer in terms of workflow efficiency and improved surgical precision. Competitive dynamics are characterized by intense competition among established players and the emergence of innovative entrants. This competitiveness drives technological advancements and results in a wider range of product offerings catering to diverse clinical needs. Market growth is also influenced by government initiatives aimed at improving healthcare infrastructure, as well as the rising adoption of digital health technologies. The market penetration is estimated to reach xx% by 2033.
Leading Markets & Segments in Surgical C Arm Tables
The hospital segment dominates the application market, accounting for an estimated xx% of the total market share in 2025. The high volume of surgical procedures performed in hospitals drives this dominance. Within the type segment, integrated C-arm tables hold a larger market share than removable ones due to their enhanced functionalities and seamless integration into the operating room setup.
- Dominant Region/Country: North America is projected to hold the largest market share in 2025, driven by factors including advanced healthcare infrastructure, high adoption rates of minimally invasive surgeries, and substantial investments in medical technology.
- Key Drivers for Hospital Segment: High volume of surgical procedures, increasing demand for advanced imaging technology.
- Key Drivers for Integrated Type Segment: Enhanced functionality, improved workflow efficiency, and superior image quality.
- Key Drivers for North America: Well-established healthcare infrastructure, high adoption of minimally invasive procedures, and robust investments in medical technology.
Surgical C Arm Tables Product Developments
Recent product innovations focus on enhancing image quality, improving ergonomics, and integrating advanced features such as robotic assistance and 3D imaging capabilities. These advancements enhance surgical precision, reduce procedure time, and improve patient outcomes. Manufacturers are emphasizing compact designs, improved mobility, and seamless integration with existing surgical workflows to cater to the evolving needs of healthcare providers. Competitive advantages are primarily achieved through superior image quality, enhanced usability, advanced features, and robust after-sales service.
Key Drivers of Surgical C Arm Tables Growth
Technological advancements in imaging technology (e.g., improved image clarity and resolution), increased adoption of minimally invasive surgery techniques, and the expanding global healthcare infrastructure are key growth drivers. Furthermore, favorable regulatory environments in several key markets and rising healthcare expenditure are stimulating market expansion. The growing demand for improved surgical precision and efficiency is also fueling the growth of this market.
Challenges in the Surgical C Arm Tables Market
High initial investment costs, stringent regulatory requirements for medical device approval, and potential supply chain disruptions due to global events pose challenges to market growth. The intense competition from established players and the emergence of new market entrants also adds pressure on profit margins. These factors can potentially constrain market expansion if not effectively managed. The overall impact of these challenges is estimated to reduce the market growth by approximately xx% over the forecast period.
Emerging Opportunities in Surgical C Arm Tables
Emerging opportunities lie in the integration of AI and machine learning in image analysis, the development of wireless and portable C-arm tables, and expansion into emerging markets with growing healthcare infrastructure. Strategic partnerships between manufacturers and healthcare providers will also drive innovation and market penetration. Further advancements in imaging technology, such as 3D imaging capabilities and improved image quality, are expected to contribute to sustained market growth in the coming years.
Key Milestones in Surgical C Arm Tables Industry
- 2020: Stryker launches a new line of integrated C-arm tables with enhanced imaging capabilities.
- 2022: A significant merger between two major players results in a larger market share for the combined entity.
- 2023: New regulatory standards for medical device safety are implemented, impacting product development and market access.
- 2024: A leading manufacturer introduces a wireless C-arm table, improving surgical workflow efficiency.
Strategic Outlook for Surgical C Arm Tables Market
The surgical C-arm tables market is poised for continued growth, driven by technological advancements, increasing demand for minimally invasive procedures, and expanding healthcare infrastructure. Strategic partnerships, focused investments in R&D, and expansion into emerging markets present significant opportunities for growth. Manufacturers focusing on product innovation, improved ergonomics, and seamless integration with existing surgical workflows are well-positioned to capture a greater market share and drive significant revenue generation in the coming years.
Surgical C Arm Tables Segmentation
-
1. Application
- 1.1. Hospital
- 1.2. Clinic
- 1.3. Others
-
2. Type
- 2.1. Removable
- 2.2. Integrated
Surgical C Arm Tables Segmentation By Geography
-
1. North America
- 1.1. United States
- 1.2. Canada
- 1.3. Mexico
-
2. South America
- 2.1. Brazil
- 2.2. Argentina
- 2.3. Rest of South America
-
3. Europe
- 3.1. United Kingdom
- 3.2. Germany
- 3.3. France
- 3.4. Italy
- 3.5. Spain
- 3.6. Russia
- 3.7. Benelux
- 3.8. Nordics
- 3.9. Rest of Europe
-
4. Middle East & Africa
- 4.1. Turkey
- 4.2. Israel
- 4.3. GCC
- 4.4. North Africa
- 4.5. South Africa
- 4.6. Rest of Middle East & Africa
-
5. Asia Pacific
- 5.1. China
- 5.2. India
- 5.3. Japan
- 5.4. South Korea
- 5.5. ASEAN
- 5.6. Oceania
- 5.7. Rest of Asia Pacific
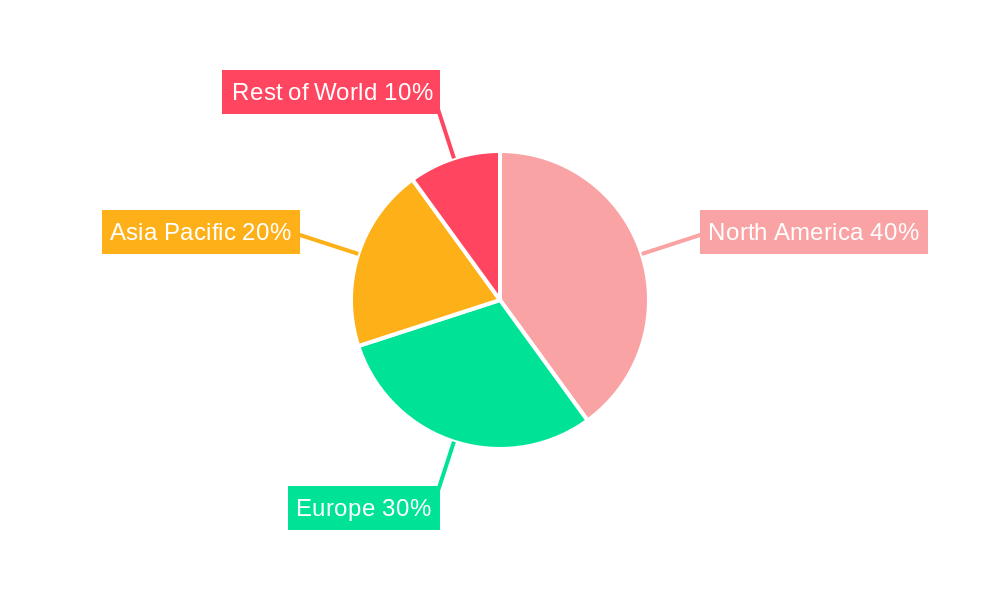
Surgical C Arm Tables Regional Market Share
Geographic Coverage of Surgical C Arm Tables
Surgical C Arm Tables REPORT HIGHLIGHTS
| Aspects | Details |
|---|---|
| Study Period | 2020-2034 |
| Base Year | 2025 |
| Estimated Year | 2026 |
| Forecast Period | 2026-2034 |
| Historical Period | 2020-2025 |
| Growth Rate | CAGR of XXX% from 2020-2034 |
| Segmentation |
|
Table of Contents
- 1. Introduction
- 1.1. Research Scope
- 1.2. Market Segmentation
- 1.3. Research Methodology
- 1.4. Definitions and Assumptions
- 2. Executive Summary
- 2.1. Introduction
- 3. Market Dynamics
- 3.1. Introduction
- 3.2. Market Drivers
- 3.3. Market Restrains
- 3.4. Market Trends
- 4. Market Factor Analysis
- 4.1. Porters Five Forces
- 4.2. Supply/Value Chain
- 4.3. PESTEL analysis
- 4.4. Market Entropy
- 4.5. Patent/Trademark Analysis
- 5. Global Surgical C Arm Tables Analysis, Insights and Forecast, 2020-2032
- 5.1. Market Analysis, Insights and Forecast - by Application
- 5.1.1. Hospital
- 5.1.2. Clinic
- 5.1.3. Others
- 5.2. Market Analysis, Insights and Forecast - by Type
- 5.2.1. Removable
- 5.2.2. Integrated
- 5.3. Market Analysis, Insights and Forecast - by Region
- 5.3.1. North America
- 5.3.2. South America
- 5.3.3. Europe
- 5.3.4. Middle East & Africa
- 5.3.5. Asia Pacific
- 5.1. Market Analysis, Insights and Forecast - by Application
- 6. North America Surgical C Arm Tables Analysis, Insights and Forecast, 2020-2032
- 6.1. Market Analysis, Insights and Forecast - by Application
- 6.1.1. Hospital
- 6.1.2. Clinic
- 6.1.3. Others
- 6.2. Market Analysis, Insights and Forecast - by Type
- 6.2.1. Removable
- 6.2.2. Integrated
- 6.1. Market Analysis, Insights and Forecast - by Application
- 7. South America Surgical C Arm Tables Analysis, Insights and Forecast, 2020-2032
- 7.1. Market Analysis, Insights and Forecast - by Application
- 7.1.1. Hospital
- 7.1.2. Clinic
- 7.1.3. Others
- 7.2. Market Analysis, Insights and Forecast - by Type
- 7.2.1. Removable
- 7.2.2. Integrated
- 7.1. Market Analysis, Insights and Forecast - by Application
- 8. Europe Surgical C Arm Tables Analysis, Insights and Forecast, 2020-2032
- 8.1. Market Analysis, Insights and Forecast - by Application
- 8.1.1. Hospital
- 8.1.2. Clinic
- 8.1.3. Others
- 8.2. Market Analysis, Insights and Forecast - by Type
- 8.2.1. Removable
- 8.2.2. Integrated
- 8.1. Market Analysis, Insights and Forecast - by Application
- 9. Middle East & Africa Surgical C Arm Tables Analysis, Insights and Forecast, 2020-2032
- 9.1. Market Analysis, Insights and Forecast - by Application
- 9.1.1. Hospital
- 9.1.2. Clinic
- 9.1.3. Others
- 9.2. Market Analysis, Insights and Forecast - by Type
- 9.2.1. Removable
- 9.2.2. Integrated
- 9.1. Market Analysis, Insights and Forecast - by Application
- 10. Asia Pacific Surgical C Arm Tables Analysis, Insights and Forecast, 2020-2032
- 10.1. Market Analysis, Insights and Forecast - by Application
- 10.1.1. Hospital
- 10.1.2. Clinic
- 10.1.3. Others
- 10.2. Market Analysis, Insights and Forecast - by Type
- 10.2.1. Removable
- 10.2.2. Integrated
- 10.1. Market Analysis, Insights and Forecast - by Application
- 11. Competitive Analysis
- 11.1. Global Market Share Analysis 2025
- 11.2. Company Profiles
- 11.2.1 Mirion
- 11.2.1.1. Overview
- 11.2.1.2. Products
- 11.2.1.3. SWOT Analysis
- 11.2.1.4. Recent Developments
- 11.2.1.5. Financials (Based on Availability)
- 11.2.2 Oakworks Medical
- 11.2.2.1. Overview
- 11.2.2.2. Products
- 11.2.2.3. SWOT Analysis
- 11.2.2.4. Recent Developments
- 11.2.2.5. Financials (Based on Availability)
- 11.2.3 Skytron
- 11.2.3.1. Overview
- 11.2.3.2. Products
- 11.2.3.3. SWOT Analysis
- 11.2.3.4. Recent Developments
- 11.2.3.5. Financials (Based on Availability)
- 11.2.4 Steris
- 11.2.4.1. Overview
- 11.2.4.2. Products
- 11.2.4.3. SWOT Analysis
- 11.2.4.4. Recent Developments
- 11.2.4.5. Financials (Based on Availability)
- 11.2.5 Maquet
- 11.2.5.1. Overview
- 11.2.5.2. Products
- 11.2.5.3. SWOT Analysis
- 11.2.5.4. Recent Developments
- 11.2.5.5. Financials (Based on Availability)
- 11.2.6 Stryker
- 11.2.6.1. Overview
- 11.2.6.2. Products
- 11.2.6.3. SWOT Analysis
- 11.2.6.4. Recent Developments
- 11.2.6.5. Financials (Based on Availability)
- 11.2.7 Arcoma-IMIX
- 11.2.7.1. Overview
- 11.2.7.2. Products
- 11.2.7.3. SWOT Analysis
- 11.2.7.4. Recent Developments
- 11.2.7.5. Financials (Based on Availability)
- 11.2.8 Stille
- 11.2.8.1. Overview
- 11.2.8.2. Products
- 11.2.8.3. SWOT Analysis
- 11.2.8.4. Recent Developments
- 11.2.8.5. Financials (Based on Availability)
- 11.2.9 AADCO Medical
- 11.2.9.1. Overview
- 11.2.9.2. Products
- 11.2.9.3. SWOT Analysis
- 11.2.9.4. Recent Developments
- 11.2.9.5. Financials (Based on Availability)
- 11.2.10 Avante Health Solutions
- 11.2.10.1. Overview
- 11.2.10.2. Products
- 11.2.10.3. SWOT Analysis
- 11.2.10.4. Recent Developments
- 11.2.10.5. Financials (Based on Availability)
- 11.2.11 General Medical Merate
- 11.2.11.1. Overview
- 11.2.11.2. Products
- 11.2.11.3. SWOT Analysis
- 11.2.11.4. Recent Developments
- 11.2.11.5. Financials (Based on Availability)
- 11.2.12 Infinium
- 11.2.12.1. Overview
- 11.2.12.2. Products
- 11.2.12.3. SWOT Analysis
- 11.2.12.4. Recent Developments
- 11.2.12.5. Financials (Based on Availability)
- 11.2.13 Magnatek Enterprises
- 11.2.13.1. Overview
- 11.2.13.2. Products
- 11.2.13.3. SWOT Analysis
- 11.2.13.4. Recent Developments
- 11.2.13.5. Financials (Based on Availability)
- 11.2.14 Mizuho OSI
- 11.2.14.1. Overview
- 11.2.14.2. Products
- 11.2.14.3. SWOT Analysis
- 11.2.14.4. Recent Developments
- 11.2.14.5. Financials (Based on Availability)
- 11.2.15 Surgical Tables Inc.
- 11.2.15.1. Overview
- 11.2.15.2. Products
- 11.2.15.3. SWOT Analysis
- 11.2.15.4. Recent Developments
- 11.2.15.5. Financials (Based on Availability)
- 11.2.1 Mirion
List of Figures
- Figure 1: Global Surgical C Arm Tables Revenue Breakdown (million, %) by Region 2025 & 2033
- Figure 2: Global Surgical C Arm Tables Volume Breakdown (K, %) by Region 2025 & 2033
- Figure 3: North America Surgical C Arm Tables Revenue (million), by Application 2025 & 2033
- Figure 4: North America Surgical C Arm Tables Volume (K), by Application 2025 & 2033
- Figure 5: North America Surgical C Arm Tables Revenue Share (%), by Application 2025 & 2033
- Figure 6: North America Surgical C Arm Tables Volume Share (%), by Application 2025 & 2033
- Figure 7: North America Surgical C Arm Tables Revenue (million), by Type 2025 & 2033
- Figure 8: North America Surgical C Arm Tables Volume (K), by Type 2025 & 2033
- Figure 9: North America Surgical C Arm Tables Revenue Share (%), by Type 2025 & 2033
- Figure 10: North America Surgical C Arm Tables Volume Share (%), by Type 2025 & 2033
- Figure 11: North America Surgical C Arm Tables Revenue (million), by Country 2025 & 2033
- Figure 12: North America Surgical C Arm Tables Volume (K), by Country 2025 & 2033
- Figure 13: North America Surgical C Arm Tables Revenue Share (%), by Country 2025 & 2033
- Figure 14: North America Surgical C Arm Tables Volume Share (%), by Country 2025 & 2033
- Figure 15: South America Surgical C Arm Tables Revenue (million), by Application 2025 & 2033
- Figure 16: South America Surgical C Arm Tables Volume (K), by Application 2025 & 2033
- Figure 17: South America Surgical C Arm Tables Revenue Share (%), by Application 2025 & 2033
- Figure 18: South America Surgical C Arm Tables Volume Share (%), by Application 2025 & 2033
- Figure 19: South America Surgical C Arm Tables Revenue (million), by Type 2025 & 2033
- Figure 20: South America Surgical C Arm Tables Volume (K), by Type 2025 & 2033
- Figure 21: South America Surgical C Arm Tables Revenue Share (%), by Type 2025 & 2033
- Figure 22: South America Surgical C Arm Tables Volume Share (%), by Type 2025 & 2033
- Figure 23: South America Surgical C Arm Tables Revenue (million), by Country 2025 & 2033
- Figure 24: South America Surgical C Arm Tables Volume (K), by Country 2025 & 2033
- Figure 25: South America Surgical C Arm Tables Revenue Share (%), by Country 2025 & 2033
- Figure 26: South America Surgical C Arm Tables Volume Share (%), by Country 2025 & 2033
- Figure 27: Europe Surgical C Arm Tables Revenue (million), by Application 2025 & 2033
- Figure 28: Europe Surgical C Arm Tables Volume (K), by Application 2025 & 2033
- Figure 29: Europe Surgical C Arm Tables Revenue Share (%), by Application 2025 & 2033
- Figure 30: Europe Surgical C Arm Tables Volume Share (%), by Application 2025 & 2033
- Figure 31: Europe Surgical C Arm Tables Revenue (million), by Type 2025 & 2033
- Figure 32: Europe Surgical C Arm Tables Volume (K), by Type 2025 & 2033
- Figure 33: Europe Surgical C Arm Tables Revenue Share (%), by Type 2025 & 2033
- Figure 34: Europe Surgical C Arm Tables Volume Share (%), by Type 2025 & 2033
- Figure 35: Europe Surgical C Arm Tables Revenue (million), by Country 2025 & 2033
- Figure 36: Europe Surgical C Arm Tables Volume (K), by Country 2025 & 2033
- Figure 37: Europe Surgical C Arm Tables Revenue Share (%), by Country 2025 & 2033
- Figure 38: Europe Surgical C Arm Tables Volume Share (%), by Country 2025 & 2033
- Figure 39: Middle East & Africa Surgical C Arm Tables Revenue (million), by Application 2025 & 2033
- Figure 40: Middle East & Africa Surgical C Arm Tables Volume (K), by Application 2025 & 2033
- Figure 41: Middle East & Africa Surgical C Arm Tables Revenue Share (%), by Application 2025 & 2033
- Figure 42: Middle East & Africa Surgical C Arm Tables Volume Share (%), by Application 2025 & 2033
- Figure 43: Middle East & Africa Surgical C Arm Tables Revenue (million), by Type 2025 & 2033
- Figure 44: Middle East & Africa Surgical C Arm Tables Volume (K), by Type 2025 & 2033
- Figure 45: Middle East & Africa Surgical C Arm Tables Revenue Share (%), by Type 2025 & 2033
- Figure 46: Middle East & Africa Surgical C Arm Tables Volume Share (%), by Type 2025 & 2033
- Figure 47: Middle East & Africa Surgical C Arm Tables Revenue (million), by Country 2025 & 2033
- Figure 48: Middle East & Africa Surgical C Arm Tables Volume (K), by Country 2025 & 2033
- Figure 49: Middle East & Africa Surgical C Arm Tables Revenue Share (%), by Country 2025 & 2033
- Figure 50: Middle East & Africa Surgical C Arm Tables Volume Share (%), by Country 2025 & 2033
- Figure 51: Asia Pacific Surgical C Arm Tables Revenue (million), by Application 2025 & 2033
- Figure 52: Asia Pacific Surgical C Arm Tables Volume (K), by Application 2025 & 2033
- Figure 53: Asia Pacific Surgical C Arm Tables Revenue Share (%), by Application 2025 & 2033
- Figure 54: Asia Pacific Surgical C Arm Tables Volume Share (%), by Application 2025 & 2033
- Figure 55: Asia Pacific Surgical C Arm Tables Revenue (million), by Type 2025 & 2033
- Figure 56: Asia Pacific Surgical C Arm Tables Volume (K), by Type 2025 & 2033
- Figure 57: Asia Pacific Surgical C Arm Tables Revenue Share (%), by Type 2025 & 2033
- Figure 58: Asia Pacific Surgical C Arm Tables Volume Share (%), by Type 2025 & 2033
- Figure 59: Asia Pacific Surgical C Arm Tables Revenue (million), by Country 2025 & 2033
- Figure 60: Asia Pacific Surgical C Arm Tables Volume (K), by Country 2025 & 2033
- Figure 61: Asia Pacific Surgical C Arm Tables Revenue Share (%), by Country 2025 & 2033
- Figure 62: Asia Pacific Surgical C Arm Tables Volume Share (%), by Country 2025 & 2033
List of Tables
- Table 1: Global Surgical C Arm Tables Revenue million Forecast, by Application 2020 & 2033
- Table 2: Global Surgical C Arm Tables Volume K Forecast, by Application 2020 & 2033
- Table 3: Global Surgical C Arm Tables Revenue million Forecast, by Type 2020 & 2033
- Table 4: Global Surgical C Arm Tables Volume K Forecast, by Type 2020 & 2033
- Table 5: Global Surgical C Arm Tables Revenue million Forecast, by Region 2020 & 2033
- Table 6: Global Surgical C Arm Tables Volume K Forecast, by Region 2020 & 2033
- Table 7: Global Surgical C Arm Tables Revenue million Forecast, by Application 2020 & 2033
- Table 8: Global Surgical C Arm Tables Volume K Forecast, by Application 2020 & 2033
- Table 9: Global Surgical C Arm Tables Revenue million Forecast, by Type 2020 & 2033
- Table 10: Global Surgical C Arm Tables Volume K Forecast, by Type 2020 & 2033
- Table 11: Global Surgical C Arm Tables Revenue million Forecast, by Country 2020 & 2033
- Table 12: Global Surgical C Arm Tables Volume K Forecast, by Country 2020 & 2033
- Table 13: United States Surgical C Arm Tables Revenue (million) Forecast, by Application 2020 & 2033
- Table 14: United States Surgical C Arm Tables Volume (K) Forecast, by Application 2020 & 2033
- Table 15: Canada Surgical C Arm Tables Revenue (million) Forecast, by Application 2020 & 2033
- Table 16: Canada Surgical C Arm Tables Volume (K) Forecast, by Application 2020 & 2033
- Table 17: Mexico Surgical C Arm Tables Revenue (million) Forecast, by Application 2020 & 2033
- Table 18: Mexico Surgical C Arm Tables Volume (K) Forecast, by Application 2020 & 2033
- Table 19: Global Surgical C Arm Tables Revenue million Forecast, by Application 2020 & 2033
- Table 20: Global Surgical C Arm Tables Volume K Forecast, by Application 2020 & 2033
- Table 21: Global Surgical C Arm Tables Revenue million Forecast, by Type 2020 & 2033
- Table 22: Global Surgical C Arm Tables Volume K Forecast, by Type 2020 & 2033
- Table 23: Global Surgical C Arm Tables Revenue million Forecast, by Country 2020 & 2033
- Table 24: Global Surgical C Arm Tables Volume K Forecast, by Country 2020 & 2033
- Table 25: Brazil Surgical C Arm Tables Revenue (million) Forecast, by Application 2020 & 2033
- Table 26: Brazil Surgical C Arm Tables Volume (K) Forecast, by Application 2020 & 2033
- Table 27: Argentina Surgical C Arm Tables Revenue (million) Forecast, by Application 2020 & 2033
- Table 28: Argentina Surgical C Arm Tables Volume (K) Forecast, by Application 2020 & 2033
- Table 29: Rest of South America Surgical C Arm Tables Revenue (million) Forecast, by Application 2020 & 2033
- Table 30: Rest of South America Surgical C Arm Tables Volume (K) Forecast, by Application 2020 & 2033
- Table 31: Global Surgical C Arm Tables Revenue million Forecast, by Application 2020 & 2033
- Table 32: Global Surgical C Arm Tables Volume K Forecast, by Application 2020 & 2033
- Table 33: Global Surgical C Arm Tables Revenue million Forecast, by Type 2020 & 2033
- Table 34: Global Surgical C Arm Tables Volume K Forecast, by Type 2020 & 2033
- Table 35: Global Surgical C Arm Tables Revenue million Forecast, by Country 2020 & 2033
- Table 36: Global Surgical C Arm Tables Volume K Forecast, by Country 2020 & 2033
- Table 37: United Kingdom Surgical C Arm Tables Revenue (million) Forecast, by Application 2020 & 2033
- Table 38: United Kingdom Surgical C Arm Tables Volume (K) Forecast, by Application 2020 & 2033
- Table 39: Germany Surgical C Arm Tables Revenue (million) Forecast, by Application 2020 & 2033
- Table 40: Germany Surgical C Arm Tables Volume (K) Forecast, by Application 2020 & 2033
- Table 41: France Surgical C Arm Tables Revenue (million) Forecast, by Application 2020 & 2033
- Table 42: France Surgical C Arm Tables Volume (K) Forecast, by Application 2020 & 2033
- Table 43: Italy Surgical C Arm Tables Revenue (million) Forecast, by Application 2020 & 2033
- Table 44: Italy Surgical C Arm Tables Volume (K) Forecast, by Application 2020 & 2033
- Table 45: Spain Surgical C Arm Tables Revenue (million) Forecast, by Application 2020 & 2033
- Table 46: Spain Surgical C Arm Tables Volume (K) Forecast, by Application 2020 & 2033
- Table 47: Russia Surgical C Arm Tables Revenue (million) Forecast, by Application 2020 & 2033
- Table 48: Russia Surgical C Arm Tables Volume (K) Forecast, by Application 2020 & 2033
- Table 49: Benelux Surgical C Arm Tables Revenue (million) Forecast, by Application 2020 & 2033
- Table 50: Benelux Surgical C Arm Tables Volume (K) Forecast, by Application 2020 & 2033
- Table 51: Nordics Surgical C Arm Tables Revenue (million) Forecast, by Application 2020 & 2033
- Table 52: Nordics Surgical C Arm Tables Volume (K) Forecast, by Application 2020 & 2033
- Table 53: Rest of Europe Surgical C Arm Tables Revenue (million) Forecast, by Application 2020 & 2033
- Table 54: Rest of Europe Surgical C Arm Tables Volume (K) Forecast, by Application 2020 & 2033
- Table 55: Global Surgical C Arm Tables Revenue million Forecast, by Application 2020 & 2033
- Table 56: Global Surgical C Arm Tables Volume K Forecast, by Application 2020 & 2033
- Table 57: Global Surgical C Arm Tables Revenue million Forecast, by Type 2020 & 2033
- Table 58: Global Surgical C Arm Tables Volume K Forecast, by Type 2020 & 2033
- Table 59: Global Surgical C Arm Tables Revenue million Forecast, by Country 2020 & 2033
- Table 60: Global Surgical C Arm Tables Volume K Forecast, by Country 2020 & 2033
- Table 61: Turkey Surgical C Arm Tables Revenue (million) Forecast, by Application 2020 & 2033
- Table 62: Turkey Surgical C Arm Tables Volume (K) Forecast, by Application 2020 & 2033
- Table 63: Israel Surgical C Arm Tables Revenue (million) Forecast, by Application 2020 & 2033
- Table 64: Israel Surgical C Arm Tables Volume (K) Forecast, by Application 2020 & 2033
- Table 65: GCC Surgical C Arm Tables Revenue (million) Forecast, by Application 2020 & 2033
- Table 66: GCC Surgical C Arm Tables Volume (K) Forecast, by Application 2020 & 2033
- Table 67: North Africa Surgical C Arm Tables Revenue (million) Forecast, by Application 2020 & 2033
- Table 68: North Africa Surgical C Arm Tables Volume (K) Forecast, by Application 2020 & 2033
- Table 69: South Africa Surgical C Arm Tables Revenue (million) Forecast, by Application 2020 & 2033
- Table 70: South Africa Surgical C Arm Tables Volume (K) Forecast, by Application 2020 & 2033
- Table 71: Rest of Middle East & Africa Surgical C Arm Tables Revenue (million) Forecast, by Application 2020 & 2033
- Table 72: Rest of Middle East & Africa Surgical C Arm Tables Volume (K) Forecast, by Application 2020 & 2033
- Table 73: Global Surgical C Arm Tables Revenue million Forecast, by Application 2020 & 2033
- Table 74: Global Surgical C Arm Tables Volume K Forecast, by Application 2020 & 2033
- Table 75: Global Surgical C Arm Tables Revenue million Forecast, by Type 2020 & 2033
- Table 76: Global Surgical C Arm Tables Volume K Forecast, by Type 2020 & 2033
- Table 77: Global Surgical C Arm Tables Revenue million Forecast, by Country 2020 & 2033
- Table 78: Global Surgical C Arm Tables Volume K Forecast, by Country 2020 & 2033
- Table 79: China Surgical C Arm Tables Revenue (million) Forecast, by Application 2020 & 2033
- Table 80: China Surgical C Arm Tables Volume (K) Forecast, by Application 2020 & 2033
- Table 81: India Surgical C Arm Tables Revenue (million) Forecast, by Application 2020 & 2033
- Table 82: India Surgical C Arm Tables Volume (K) Forecast, by Application 2020 & 2033
- Table 83: Japan Surgical C Arm Tables Revenue (million) Forecast, by Application 2020 & 2033
- Table 84: Japan Surgical C Arm Tables Volume (K) Forecast, by Application 2020 & 2033
- Table 85: South Korea Surgical C Arm Tables Revenue (million) Forecast, by Application 2020 & 2033
- Table 86: South Korea Surgical C Arm Tables Volume (K) Forecast, by Application 2020 & 2033
- Table 87: ASEAN Surgical C Arm Tables Revenue (million) Forecast, by Application 2020 & 2033
- Table 88: ASEAN Surgical C Arm Tables Volume (K) Forecast, by Application 2020 & 2033
- Table 89: Oceania Surgical C Arm Tables Revenue (million) Forecast, by Application 2020 & 2033
- Table 90: Oceania Surgical C Arm Tables Volume (K) Forecast, by Application 2020 & 2033
- Table 91: Rest of Asia Pacific Surgical C Arm Tables Revenue (million) Forecast, by Application 2020 & 2033
- Table 92: Rest of Asia Pacific Surgical C Arm Tables Volume (K) Forecast, by Application 2020 & 2033
Frequently Asked Questions
1. What is the projected Compound Annual Growth Rate (CAGR) of the Surgical C Arm Tables?
The projected CAGR is approximately XXX%.
2. Which companies are prominent players in the Surgical C Arm Tables?
Key companies in the market include Mirion, Oakworks Medical, Skytron, Steris, Maquet, Stryker, Arcoma-IMIX, Stille, AADCO Medical, Avante Health Solutions, General Medical Merate, Infinium, Magnatek Enterprises, Mizuho OSI, Surgical Tables Inc..
3. What are the main segments of the Surgical C Arm Tables?
The market segments include Application, Type.
4. Can you provide details about the market size?
The market size is estimated to be USD XXX million as of 2022.
5. What are some drivers contributing to market growth?
N/A
6. What are the notable trends driving market growth?
N/A
7. Are there any restraints impacting market growth?
N/A
8. Can you provide examples of recent developments in the market?
N/A
9. What pricing options are available for accessing the report?
Pricing options include single-user, multi-user, and enterprise licenses priced at USD 3950.00, USD 5925.00, and USD 7900.00 respectively.
10. Is the market size provided in terms of value or volume?
The market size is provided in terms of value, measured in million and volume, measured in K.
11. Are there any specific market keywords associated with the report?
Yes, the market keyword associated with the report is "Surgical C Arm Tables," which aids in identifying and referencing the specific market segment covered.
12. How do I determine which pricing option suits my needs best?
The pricing options vary based on user requirements and access needs. Individual users may opt for single-user licenses, while businesses requiring broader access may choose multi-user or enterprise licenses for cost-effective access to the report.
13. Are there any additional resources or data provided in the Surgical C Arm Tables report?
While the report offers comprehensive insights, it's advisable to review the specific contents or supplementary materials provided to ascertain if additional resources or data are available.
14. How can I stay updated on further developments or reports in the Surgical C Arm Tables?
To stay informed about further developments, trends, and reports in the Surgical C Arm Tables, consider subscribing to industry newsletters, following relevant companies and organizations, or regularly checking reputable industry news sources and publications.
Methodology
Step 1 - Identification of Relevant Samples Size from Population Database


Step 2 - Approaches for Defining Global Market Size (Value, Volume* & Price*)

Note*: In applicable scenarios
Step 3 - Data Sources
Primary Research
- Web Analytics
- Survey Reports
- Research Institute
- Latest Research Reports
- Opinion Leaders
Secondary Research
- Annual Reports
- White Paper
- Latest Press Release
- Industry Association
- Paid Database
- Investor Presentations

Step 4 - Data Triangulation
Involves using different sources of information in order to increase the validity of a study
These sources are likely to be stakeholders in a program - participants, other researchers, program staff, other community members, and so on.
Then we put all data in single framework & apply various statistical tools to find out the dynamic on the market.
During the analysis stage, feedback from the stakeholder groups would be compared to determine areas of agreement as well as areas of divergence