

Key Insights
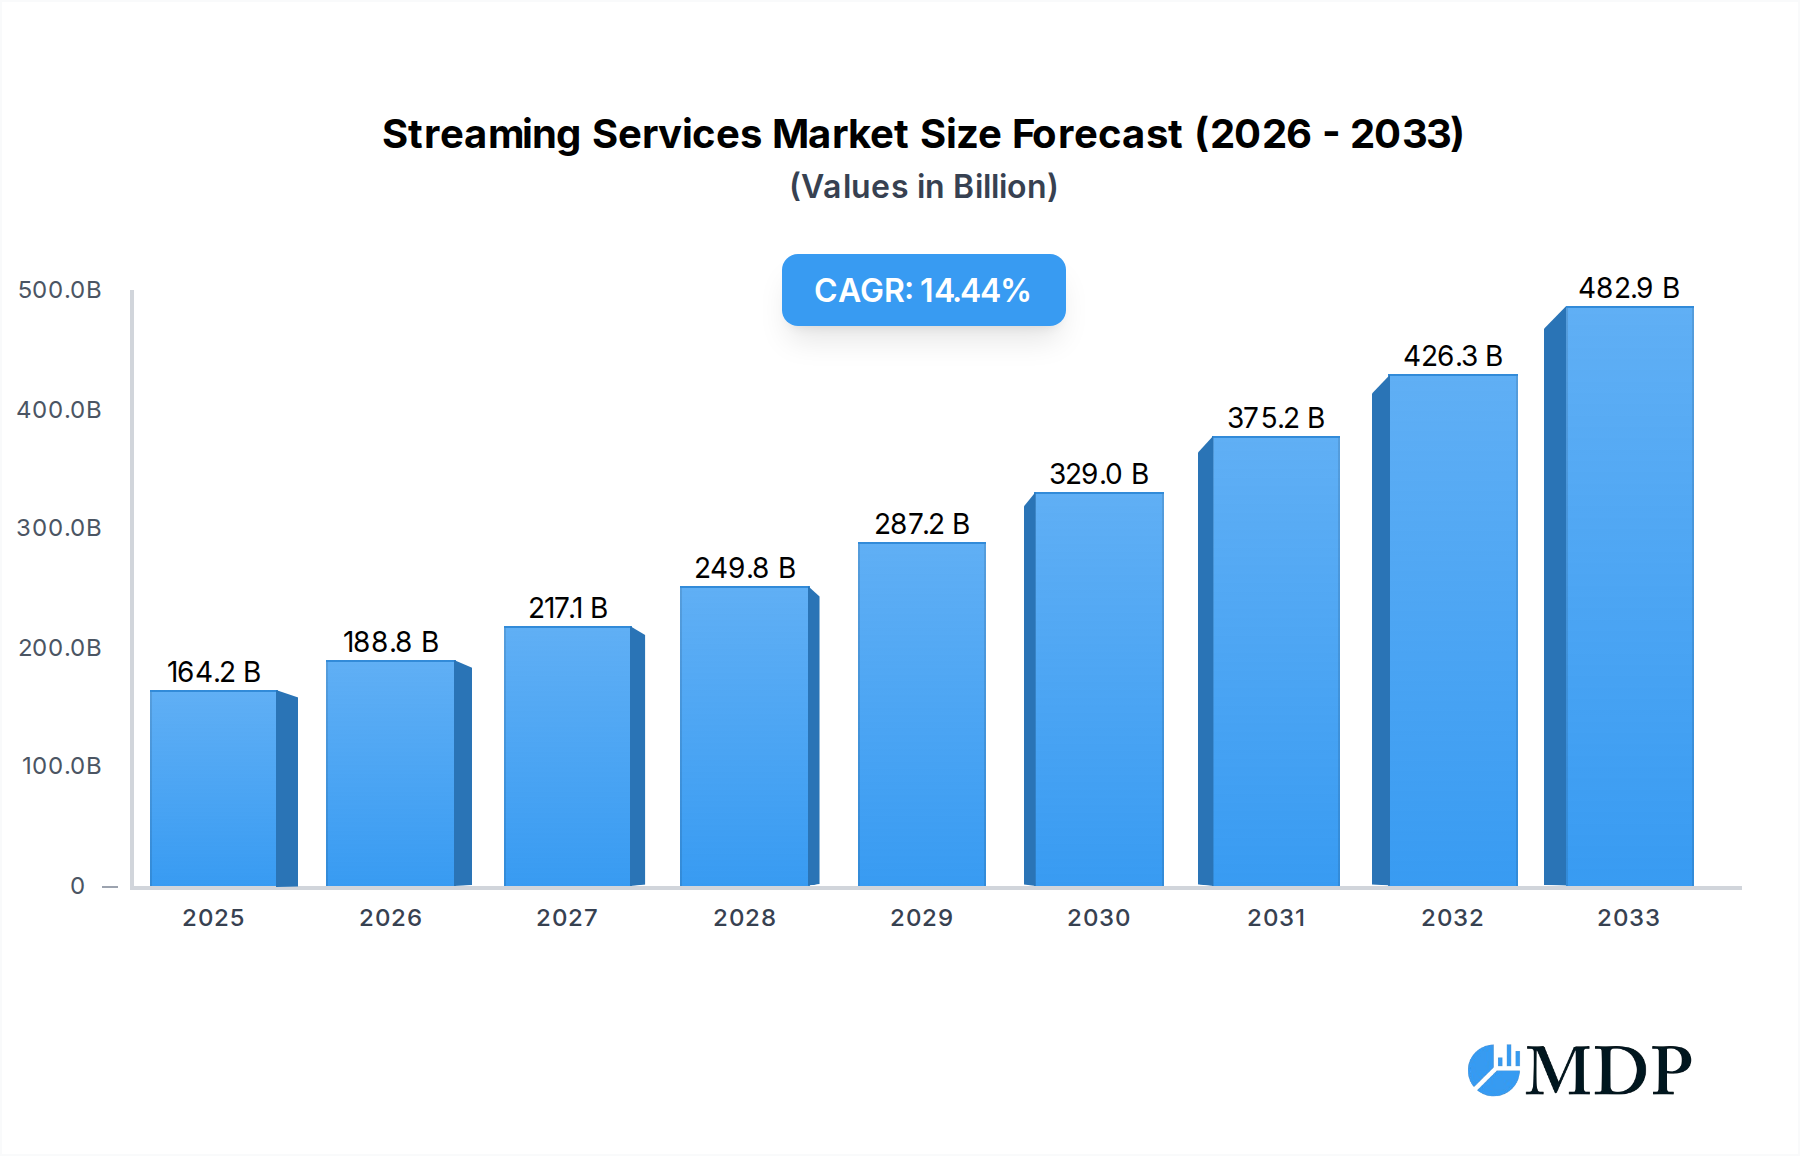
The global Streaming Services market is poised for significant expansion, with a projected market size of $164,176.19 million in 2025, demonstrating robust growth. This surge is propelled by a 15% CAGR, indicating a dynamic and rapidly evolving industry landscape. The primary drivers fueling this growth include the increasing proliferation of high-speed internet, the ever-growing demand for on-demand content, and the convenience offered by subscription-based models. The market is segmented by application, catering to diverse age demographics, from those below 20 years old to individuals over 40. Furthermore, the pricing structure for subscription fees is a critical factor, with a clear bifurcation of services priced below $10/month, between $10-$20/month, and $20-$30/month, reflecting a broad spectrum of consumer affordability and service offerings. Leading companies such as Netflix, Hulu, and Amazon Instant Video are at the forefront, continuously innovating to capture market share.

Streaming Services Market Size (In Billion)
The streaming services industry is characterized by key trends that are shaping its future. The rise of exclusive original content has become a significant differentiator, with platforms investing heavily in producing compelling series and films to attract and retain subscribers. The expansion into emerging markets, particularly in the Asia Pacific region, is a major growth avenue, driven by a burgeoning middle class and increasing digital adoption. However, the market also faces certain restraints, including intensifying competition, content licensing challenges, and the potential for subscription fatigue among consumers. The market's regional distribution is diverse, with North America and Europe currently holding substantial shares, while the Asia Pacific region is expected to witness the most rapid growth in the coming years. The ongoing evolution of content delivery, including the integration of live streaming and interactive features, further underscores the industry's innovative spirit and its commitment to meeting evolving consumer preferences.
Streaming Services Company Market Share
Unlocking the Future of Entertainment: A Comprehensive Report on the Global Streaming Services Market (2019–2033)
This in-depth report provides a panoramic view of the dynamic streaming services market, analyzing trends, innovations, and growth trajectories from 2019 to 2033. With a base year of 2025 and a forecast period extending to 2033, this study offers critical insights for stakeholders navigating the rapidly evolving digital entertainment landscape. Discover key market drivers, competitive strategies, and emerging opportunities within the SVOD, AVOD, and TVOD segments.
Streaming Services Market Dynamics & Concentration
The global streaming services market exhibits a dynamic and evolving concentration, driven by continuous innovation and strategic M&A activities. As of our estimated year 2025, the market is characterized by a mix of established giants and emerging disruptors, with Netflix leading in subscriber numbers and Amazon Instant Video demonstrating strong integration with its e-commerce ecosystem. The competitive landscape is intensifying, fueled by a surge in original content production, a key innovation driver. Regulatory frameworks, while evolving, continue to shape market access and content distribution, with a particular focus on data privacy and local content quotas in various regions. Product substitutes, including traditional broadcast television and physical media, are increasingly being supplanted by the convenience and breadth of offerings from streaming platforms. End-user trends highlight a growing demand for personalized content experiences and on-demand viewing, pushing platforms to invest heavily in AI-driven recommendation engines. M&A activities remain a significant factor, with numerous strategic acquisitions aimed at consolidating market share and acquiring valuable intellectual property. For instance, the historical period 2019–2024 saw an estimated 200+ M&A deals, with a total transaction value exceeding $50 million million. Market share figures for 2025 indicate Netflix holding approximately 30%, Amazon Instant Video 25%, and a combined share of over 15% for platforms like Hulu and YouTube TV.
Streaming Services Industry Trends & Analysis
The streaming services industry is on a robust growth trajectory, projected to witness significant expansion driven by a confluence of factors including increasing internet penetration, the proliferation of smart devices, and a persistent shift in consumer viewing habits. Our analysis, covering the study period 2019–2033, identifies a Compound Annual Growth Rate (CAGR) of approximately 15% for the global market. This growth is predominantly fueled by the insatiable appetite for on-demand entertainment and the increasing affordability of subscription plans. Technological disruptions, such as the advancements in 4K streaming, HDR, and immersive audio technologies, are not only enhancing the viewing experience but also creating new monetization opportunities for service providers. Furthermore, the integration of Artificial Intelligence (AI) for content recommendation and personalized user experiences is becoming a standard, driving higher user engagement and retention rates. Consumer preferences are continuously evolving, with a growing demand for niche content, live streaming events, and interactive viewing features. The competitive dynamics are fierce, with established players like Netflix and Amazon Instant Video constantly innovating to retain subscribers, while new entrants, particularly in regional markets, are leveraging localized content and competitive pricing strategies to gain traction. The market penetration for subscription-based video-on-demand (SVOD) services is expected to reach over 70% by 2030. The rise of ad-supported video-on-demand (AVOD) models, offering free content supported by advertising, is also a significant trend, particularly for younger demographics and price-sensitive consumers. The investment in original programming continues to be a cornerstone of market strategy, with companies allocating billions of dollars annually to secure exclusive content that drives subscriber acquisition and loyalty. The accessibility across multiple devices, from smartphones and tablets to smart TVs and gaming consoles, further solidifies the dominance of streaming services.
Leading Markets & Segments in Streaming Services
The global streaming services market's dominance is clearly established within specific regions and demographic segments, reflecting diverse consumer behaviors and market penetration.
Dominant Regions and Countries: North America, particularly the United States, continues to be the largest market for streaming services, driven by high disposable incomes, extensive broadband infrastructure, and a deeply ingrained culture of on-demand entertainment. Countries within Western Europe, such as the UK, Germany, and France, also represent significant markets due to similar economic conditions and increasing adoption rates. Emerging markets in Asia, notably China and India, are witnessing exponential growth due to a burgeoning middle class and a rapidly expanding internet user base. The penetration of services like IQIYI and Youku in China, and the growing presence of global players in India, are key indicators of this regional shift.
Application Segments:
- Age Between 20-40: This demographic represents the largest and most engaged segment, characterized by high digital literacy, early adoption of new technologies, and a significant demand for diverse content. They are the primary drivers of SVOD subscriptions and are highly influenced by social media trends and original content releases.
- Age Below 20: This segment, while smaller in terms of spending power, is crucial for future growth. They are heavy users of ad-supported content and free streaming platforms like Crackle and Funny or Die, and are increasingly influencing family subscription decisions.
- Age Higher than 40: This segment is experiencing rapid growth as more individuals adopt streaming services for convenience and a wider content selection, particularly for legacy content and specialized channels like Acorn TV and HBO Now.
Type Segments (Subscription Fee):
- Subscription Fee Lower Than $10/month: This segment is vital for capturing price-sensitive consumers and fostering broader market penetration. Platforms offering bundled deals or ad-supported tiers within this price range are highly competitive. This segment is particularly attractive to younger demographics and those in emerging economies.
- Subscription Fee Between $10-$20/month: This is the most substantial segment, encompassing the core offering of many leading streaming services like Netflix and Hulu. It represents the sweet spot for consumers seeking a balance between content variety and affordability.
- Subscription Fee Between $20-$30/month: This segment caters to premium offerings, including bundles of services or platforms providing exclusive, high-demand content like live sports (e.g., FuboTV Premier) or premium network content (e.g., CBS All Access).
Key drivers for the dominance in these segments include favorable economic policies that support digital infrastructure development, increasing disposable incomes, the widespread availability of affordable internet access, and the growing content libraries that cater to diverse tastes across different age groups and price sensitivities.
Streaming Services Product Developments
Product innovation in the streaming services sector is characterized by a relentless focus on enhancing user experience and expanding content accessibility. Companies are actively developing advanced recommendation algorithms powered by AI to provide highly personalized content suggestions, thereby increasing engagement. The integration of interactive features, such as live polls during broadcasts and shoppable content, is emerging as a key differentiator. Furthermore, the push towards higher quality streaming, including 4K Ultra HD and Dolby Atmos sound, is becoming a standard expectation. Competitive advantages are being built on exclusive original content, a diverse library of licensed titles, and seamless cross-platform availability, ensuring users can access their favorite shows and movies on any device. The development of robust parental control features and multi-user profiles further solidifies market fit for family-oriented households.
Key Drivers of Streaming Services Growth
The growth of the streaming services market is propelled by a multifaceted interplay of technological, economic, and regulatory factors.
- Technological Advancements: The widespread availability of high-speed internet, coupled with the proliferation of smart devices and 5G technology, has made seamless streaming accessible to a larger population. Innovations in video compression and delivery have also improved streaming quality, enhancing the user experience.
- Economic Factors: Increasing disposable incomes in key markets and the affordability of subscription models compared to traditional cable packages contribute significantly to growth. The emergence of ad-supported tiers also caters to a broader economic spectrum.
- Regulatory Environment: Favorable regulations promoting digital content distribution and evolving intellectual property laws, while sometimes posing challenges, generally support the expansion of the streaming ecosystem.
Challenges in the Streaming Services Market
Despite its robust growth, the streaming services market faces significant challenges that can restrain its expansion.
- Intense Competition and Market Saturation: The sheer number of streaming services leads to subscriber fatigue and increased customer acquisition costs, with estimated churn rates hovering around 15-20% annually.
- Content Licensing and Production Costs: The escalating costs of acquiring and producing exclusive original content, estimated to exceed $100 billion million globally per year, place considerable financial strain on many platforms.
- Regulatory Hurdles: Evolving regulations concerning data privacy, content moderation, and local content quotas in different regions can create compliance complexities and limit market access.
- Piracy and Copyright Infringement: The persistent issue of content piracy continues to erode revenue streams, with estimated global losses in the billions of dollars annually.
Emerging Opportunities in Streaming Services
The streaming services market is ripe with emerging opportunities that promise to fuel long-term growth and innovation. Technological breakthroughs in areas like augmented reality (AR) and virtual reality (VR) present avenues for more immersive viewing experiences, potentially creating new content formats and monetization models. Strategic partnerships between streaming platforms and telecommunications companies or content creators can unlock new distribution channels and co-branded content opportunities. Market expansion into underserved regions, particularly in Africa and Southeast Asia, offers substantial untapped subscriber potential, driven by increasing internet access and growing digital adoption. The development of gamified streaming experiences and the integration of social viewing features are also gaining traction, catering to younger, more interactive audiences.
Leading Players in the Streaming Services Sector
- Netflix
- Hulu
- Amazon Instant Video
- Playstation Vue
- Sling Orange
- Crackle
- Funny or Die
- Twitch
- Vevo
- HBO Now
- YouTube TV
- IQIYI
- Youku
- Acorn TV
- CBS All Access
- DirectTV Now
- FuboTV Premier
Key Milestones in Streaming Services Industry
- 2019: Launch of Disney+ and Apple TV+, significantly intensifying competition in the SVOD market.
- 2020: Rapid subscriber growth for most streaming services globally due to increased at-home entertainment consumption during the pandemic.
- 2021: Increased focus on live sports streaming rights by major platforms like Amazon Prime Video and YouTube TV.
- 2022: Significant investment in AVOD (Advertising-based Video On Demand) models by established SVOD players to diversify revenue streams.
- 2023: Growing consolidation within the industry, with mergers and acquisitions aimed at optimizing content libraries and subscriber bases.
- 2024: Continued exploration of interactive and gamified content experiences to boost user engagement.
Strategic Outlook for Streaming Services Market
The strategic outlook for the streaming services market is one of sustained and dynamic growth, driven by innovation and expanding global reach. Key growth accelerators include the continued adoption of AVOD models, the integration of emerging technologies like AR/VR for enhanced viewer immersion, and strategic expansion into untapped emerging markets. Further consolidation through mergers and acquisitions is anticipated as companies seek to optimize content portfolios and achieve economies of scale. The focus will remain on delivering personalized content experiences, leveraging AI and data analytics to understand and cater to evolving consumer preferences. The increasing demand for live content, particularly sports and news, presents a significant opportunity for platforms to differentiate themselves and secure long-term subscriber loyalty.
Streaming Services Segmentation
-
1. Application
- 1.1. Age below 20
- 1.2. Age Between 20-40
- 1.3. Age Higher than 40
-
2. Type
- 2.1. Subscription fee lower than $10/month
- 2.2. Subscription fee between $10-$20/month
- 2.3. Subscription fee between $20-$30/month
Streaming Services Segmentation By Geography
-
1. North America
- 1.1. United States
- 1.2. Canada
- 1.3. Mexico
-
2. South America
- 2.1. Brazil
- 2.2. Argentina
- 2.3. Rest of South America
-
3. Europe
- 3.1. United Kingdom
- 3.2. Germany
- 3.3. France
- 3.4. Italy
- 3.5. Spain
- 3.6. Russia
- 3.7. Benelux
- 3.8. Nordics
- 3.9. Rest of Europe
-
4. Middle East & Africa
- 4.1. Turkey
- 4.2. Israel
- 4.3. GCC
- 4.4. North Africa
- 4.5. South Africa
- 4.6. Rest of Middle East & Africa
-
5. Asia Pacific
- 5.1. China
- 5.2. India
- 5.3. Japan
- 5.4. South Korea
- 5.5. ASEAN
- 5.6. Oceania
- 5.7. Rest of Asia Pacific
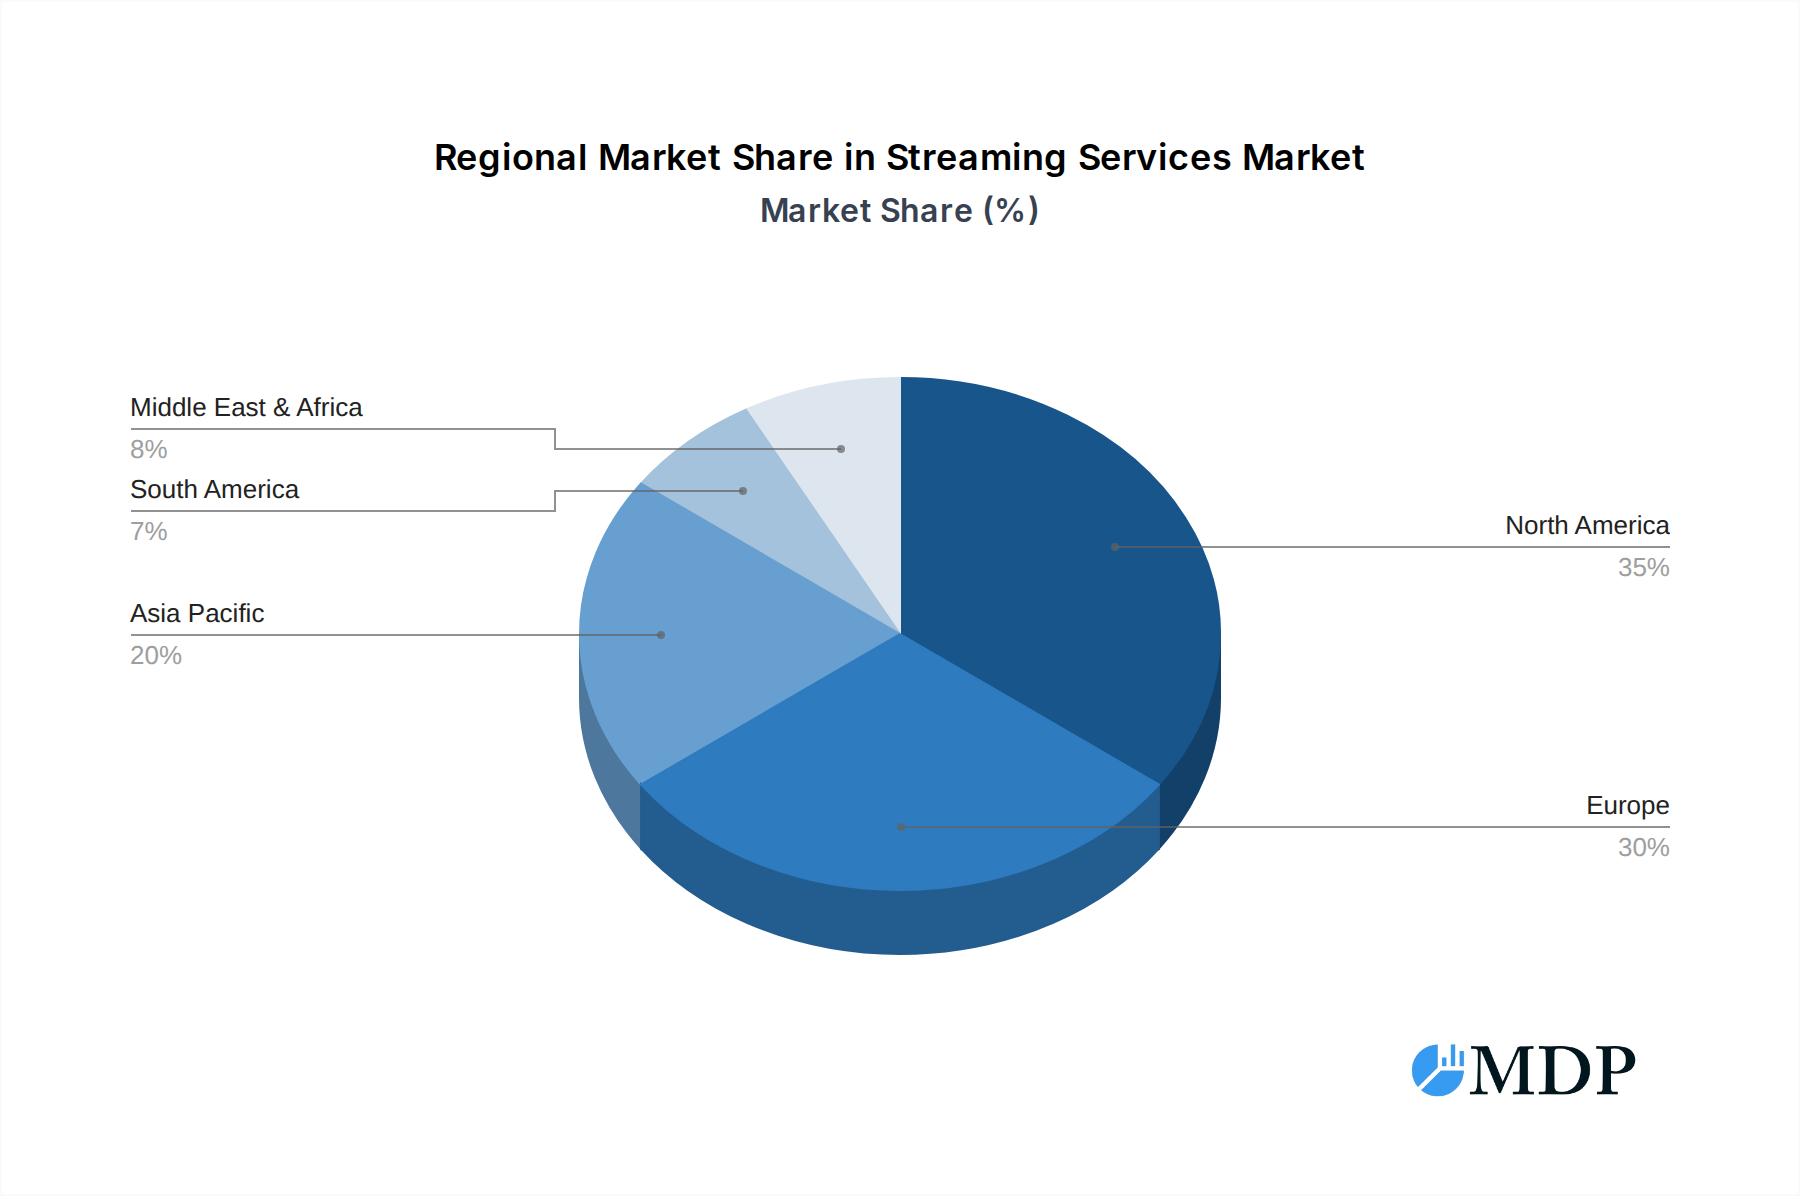
Streaming Services Regional Market Share
Geographic Coverage of Streaming Services
Streaming Services REPORT HIGHLIGHTS
| Aspects | Details |
|---|---|
| Study Period | 2020-2034 |
| Base Year | 2025 |
| Estimated Year | 2026 |
| Forecast Period | 2026-2034 |
| Historical Period | 2020-2025 |
| Growth Rate | CAGR of 15% from 2020-2034 |
| Segmentation |
|
Table of Contents
- 1. Introduction
- 1.1. Research Scope
- 1.2. Market Segmentation
- 1.3. Research Methodology
- 1.4. Definitions and Assumptions
- 2. Executive Summary
- 2.1. Introduction
- 3. Market Dynamics
- 3.1. Introduction
- 3.2. Market Drivers
- 3.3. Market Restrains
- 3.4. Market Trends
- 4. Market Factor Analysis
- 4.1. Porters Five Forces
- 4.2. Supply/Value Chain
- 4.3. PESTEL analysis
- 4.4. Market Entropy
- 4.5. Patent/Trademark Analysis
- 5. Global Streaming Services Analysis, Insights and Forecast, 2020-2032
- 5.1. Market Analysis, Insights and Forecast - by Application
- 5.1.1. Age below 20
- 5.1.2. Age Between 20-40
- 5.1.3. Age Higher than 40
- 5.2. Market Analysis, Insights and Forecast - by Type
- 5.2.1. Subscription fee lower than $10/month
- 5.2.2. Subscription fee between $10-$20/month
- 5.2.3. Subscription fee between $20-$30/month
- 5.3. Market Analysis, Insights and Forecast - by Region
- 5.3.1. North America
- 5.3.2. South America
- 5.3.3. Europe
- 5.3.4. Middle East & Africa
- 5.3.5. Asia Pacific
- 5.1. Market Analysis, Insights and Forecast - by Application
- 6. North America Streaming Services Analysis, Insights and Forecast, 2020-2032
- 6.1. Market Analysis, Insights and Forecast - by Application
- 6.1.1. Age below 20
- 6.1.2. Age Between 20-40
- 6.1.3. Age Higher than 40
- 6.2. Market Analysis, Insights and Forecast - by Type
- 6.2.1. Subscription fee lower than $10/month
- 6.2.2. Subscription fee between $10-$20/month
- 6.2.3. Subscription fee between $20-$30/month
- 6.1. Market Analysis, Insights and Forecast - by Application
- 7. South America Streaming Services Analysis, Insights and Forecast, 2020-2032
- 7.1. Market Analysis, Insights and Forecast - by Application
- 7.1.1. Age below 20
- 7.1.2. Age Between 20-40
- 7.1.3. Age Higher than 40
- 7.2. Market Analysis, Insights and Forecast - by Type
- 7.2.1. Subscription fee lower than $10/month
- 7.2.2. Subscription fee between $10-$20/month
- 7.2.3. Subscription fee between $20-$30/month
- 7.1. Market Analysis, Insights and Forecast - by Application
- 8. Europe Streaming Services Analysis, Insights and Forecast, 2020-2032
- 8.1. Market Analysis, Insights and Forecast - by Application
- 8.1.1. Age below 20
- 8.1.2. Age Between 20-40
- 8.1.3. Age Higher than 40
- 8.2. Market Analysis, Insights and Forecast - by Type
- 8.2.1. Subscription fee lower than $10/month
- 8.2.2. Subscription fee between $10-$20/month
- 8.2.3. Subscription fee between $20-$30/month
- 8.1. Market Analysis, Insights and Forecast - by Application
- 9. Middle East & Africa Streaming Services Analysis, Insights and Forecast, 2020-2032
- 9.1. Market Analysis, Insights and Forecast - by Application
- 9.1.1. Age below 20
- 9.1.2. Age Between 20-40
- 9.1.3. Age Higher than 40
- 9.2. Market Analysis, Insights and Forecast - by Type
- 9.2.1. Subscription fee lower than $10/month
- 9.2.2. Subscription fee between $10-$20/month
- 9.2.3. Subscription fee between $20-$30/month
- 9.1. Market Analysis, Insights and Forecast - by Application
- 10. Asia Pacific Streaming Services Analysis, Insights and Forecast, 2020-2032
- 10.1. Market Analysis, Insights and Forecast - by Application
- 10.1.1. Age below 20
- 10.1.2. Age Between 20-40
- 10.1.3. Age Higher than 40
- 10.2. Market Analysis, Insights and Forecast - by Type
- 10.2.1. Subscription fee lower than $10/month
- 10.2.2. Subscription fee between $10-$20/month
- 10.2.3. Subscription fee between $20-$30/month
- 10.1. Market Analysis, Insights and Forecast - by Application
- 11. Competitive Analysis
- 11.1. Global Market Share Analysis 2025
- 11.2. Company Profiles
- 11.2.1 Netflix
- 11.2.1.1. Overview
- 11.2.1.2. Products
- 11.2.1.3. SWOT Analysis
- 11.2.1.4. Recent Developments
- 11.2.1.5. Financials (Based on Availability)
- 11.2.2 Hulu
- 11.2.2.1. Overview
- 11.2.2.2. Products
- 11.2.2.3. SWOT Analysis
- 11.2.2.4. Recent Developments
- 11.2.2.5. Financials (Based on Availability)
- 11.2.3 Amazon Instant Video
- 11.2.3.1. Overview
- 11.2.3.2. Products
- 11.2.3.3. SWOT Analysis
- 11.2.3.4. Recent Developments
- 11.2.3.5. Financials (Based on Availability)
- 11.2.4 Playstation Vue
- 11.2.4.1. Overview
- 11.2.4.2. Products
- 11.2.4.3. SWOT Analysis
- 11.2.4.4. Recent Developments
- 11.2.4.5. Financials (Based on Availability)
- 11.2.5 Sling Orange
- 11.2.5.1. Overview
- 11.2.5.2. Products
- 11.2.5.3. SWOT Analysis
- 11.2.5.4. Recent Developments
- 11.2.5.5. Financials (Based on Availability)
- 11.2.6 Crackle
- 11.2.6.1. Overview
- 11.2.6.2. Products
- 11.2.6.3. SWOT Analysis
- 11.2.6.4. Recent Developments
- 11.2.6.5. Financials (Based on Availability)
- 11.2.7 Funny or Die
- 11.2.7.1. Overview
- 11.2.7.2. Products
- 11.2.7.3. SWOT Analysis
- 11.2.7.4. Recent Developments
- 11.2.7.5. Financials (Based on Availability)
- 11.2.8 Twitch
- 11.2.8.1. Overview
- 11.2.8.2. Products
- 11.2.8.3. SWOT Analysis
- 11.2.8.4. Recent Developments
- 11.2.8.5. Financials (Based on Availability)
- 11.2.9 Vevo
- 11.2.9.1. Overview
- 11.2.9.2. Products
- 11.2.9.3. SWOT Analysis
- 11.2.9.4. Recent Developments
- 11.2.9.5. Financials (Based on Availability)
- 11.2.10 HBO Now
- 11.2.10.1. Overview
- 11.2.10.2. Products
- 11.2.10.3. SWOT Analysis
- 11.2.10.4. Recent Developments
- 11.2.10.5. Financials (Based on Availability)
- 11.2.11 YouTube TV
- 11.2.11.1. Overview
- 11.2.11.2. Products
- 11.2.11.3. SWOT Analysis
- 11.2.11.4. Recent Developments
- 11.2.11.5. Financials (Based on Availability)
- 11.2.12 IQIYI
- 11.2.12.1. Overview
- 11.2.12.2. Products
- 11.2.12.3. SWOT Analysis
- 11.2.12.4. Recent Developments
- 11.2.12.5. Financials (Based on Availability)
- 11.2.13 Youku
- 11.2.13.1. Overview
- 11.2.13.2. Products
- 11.2.13.3. SWOT Analysis
- 11.2.13.4. Recent Developments
- 11.2.13.5. Financials (Based on Availability)
- 11.2.14 Acorn TV
- 11.2.14.1. Overview
- 11.2.14.2. Products
- 11.2.14.3. SWOT Analysis
- 11.2.14.4. Recent Developments
- 11.2.14.5. Financials (Based on Availability)
- 11.2.15 CBS All Access
- 11.2.15.1. Overview
- 11.2.15.2. Products
- 11.2.15.3. SWOT Analysis
- 11.2.15.4. Recent Developments
- 11.2.15.5. Financials (Based on Availability)
- 11.2.16 DirectTV Now
- 11.2.16.1. Overview
- 11.2.16.2. Products
- 11.2.16.3. SWOT Analysis
- 11.2.16.4. Recent Developments
- 11.2.16.5. Financials (Based on Availability)
- 11.2.17 FuboTV Premier
- 11.2.17.1. Overview
- 11.2.17.2. Products
- 11.2.17.3. SWOT Analysis
- 11.2.17.4. Recent Developments
- 11.2.17.5. Financials (Based on Availability)
- 11.2.1 Netflix
List of Figures
- Figure 1: Global Streaming Services Revenue Breakdown (undefined, %) by Region 2025 & 2033
- Figure 2: North America Streaming Services Revenue (undefined), by Application 2025 & 2033
- Figure 3: North America Streaming Services Revenue Share (%), by Application 2025 & 2033
- Figure 4: North America Streaming Services Revenue (undefined), by Type 2025 & 2033
- Figure 5: North America Streaming Services Revenue Share (%), by Type 2025 & 2033
- Figure 6: North America Streaming Services Revenue (undefined), by Country 2025 & 2033
- Figure 7: North America Streaming Services Revenue Share (%), by Country 2025 & 2033
- Figure 8: South America Streaming Services Revenue (undefined), by Application 2025 & 2033
- Figure 9: South America Streaming Services Revenue Share (%), by Application 2025 & 2033
- Figure 10: South America Streaming Services Revenue (undefined), by Type 2025 & 2033
- Figure 11: South America Streaming Services Revenue Share (%), by Type 2025 & 2033
- Figure 12: South America Streaming Services Revenue (undefined), by Country 2025 & 2033
- Figure 13: South America Streaming Services Revenue Share (%), by Country 2025 & 2033
- Figure 14: Europe Streaming Services Revenue (undefined), by Application 2025 & 2033
- Figure 15: Europe Streaming Services Revenue Share (%), by Application 2025 & 2033
- Figure 16: Europe Streaming Services Revenue (undefined), by Type 2025 & 2033
- Figure 17: Europe Streaming Services Revenue Share (%), by Type 2025 & 2033
- Figure 18: Europe Streaming Services Revenue (undefined), by Country 2025 & 2033
- Figure 19: Europe Streaming Services Revenue Share (%), by Country 2025 & 2033
- Figure 20: Middle East & Africa Streaming Services Revenue (undefined), by Application 2025 & 2033
- Figure 21: Middle East & Africa Streaming Services Revenue Share (%), by Application 2025 & 2033
- Figure 22: Middle East & Africa Streaming Services Revenue (undefined), by Type 2025 & 2033
- Figure 23: Middle East & Africa Streaming Services Revenue Share (%), by Type 2025 & 2033
- Figure 24: Middle East & Africa Streaming Services Revenue (undefined), by Country 2025 & 2033
- Figure 25: Middle East & Africa Streaming Services Revenue Share (%), by Country 2025 & 2033
- Figure 26: Asia Pacific Streaming Services Revenue (undefined), by Application 2025 & 2033
- Figure 27: Asia Pacific Streaming Services Revenue Share (%), by Application 2025 & 2033
- Figure 28: Asia Pacific Streaming Services Revenue (undefined), by Type 2025 & 2033
- Figure 29: Asia Pacific Streaming Services Revenue Share (%), by Type 2025 & 2033
- Figure 30: Asia Pacific Streaming Services Revenue (undefined), by Country 2025 & 2033
- Figure 31: Asia Pacific Streaming Services Revenue Share (%), by Country 2025 & 2033
List of Tables
- Table 1: Global Streaming Services Revenue undefined Forecast, by Application 2020 & 2033
- Table 2: Global Streaming Services Revenue undefined Forecast, by Type 2020 & 2033
- Table 3: Global Streaming Services Revenue undefined Forecast, by Region 2020 & 2033
- Table 4: Global Streaming Services Revenue undefined Forecast, by Application 2020 & 2033
- Table 5: Global Streaming Services Revenue undefined Forecast, by Type 2020 & 2033
- Table 6: Global Streaming Services Revenue undefined Forecast, by Country 2020 & 2033
- Table 7: United States Streaming Services Revenue (undefined) Forecast, by Application 2020 & 2033
- Table 8: Canada Streaming Services Revenue (undefined) Forecast, by Application 2020 & 2033
- Table 9: Mexico Streaming Services Revenue (undefined) Forecast, by Application 2020 & 2033
- Table 10: Global Streaming Services Revenue undefined Forecast, by Application 2020 & 2033
- Table 11: Global Streaming Services Revenue undefined Forecast, by Type 2020 & 2033
- Table 12: Global Streaming Services Revenue undefined Forecast, by Country 2020 & 2033
- Table 13: Brazil Streaming Services Revenue (undefined) Forecast, by Application 2020 & 2033
- Table 14: Argentina Streaming Services Revenue (undefined) Forecast, by Application 2020 & 2033
- Table 15: Rest of South America Streaming Services Revenue (undefined) Forecast, by Application 2020 & 2033
- Table 16: Global Streaming Services Revenue undefined Forecast, by Application 2020 & 2033
- Table 17: Global Streaming Services Revenue undefined Forecast, by Type 2020 & 2033
- Table 18: Global Streaming Services Revenue undefined Forecast, by Country 2020 & 2033
- Table 19: United Kingdom Streaming Services Revenue (undefined) Forecast, by Application 2020 & 2033
- Table 20: Germany Streaming Services Revenue (undefined) Forecast, by Application 2020 & 2033
- Table 21: France Streaming Services Revenue (undefined) Forecast, by Application 2020 & 2033
- Table 22: Italy Streaming Services Revenue (undefined) Forecast, by Application 2020 & 2033
- Table 23: Spain Streaming Services Revenue (undefined) Forecast, by Application 2020 & 2033
- Table 24: Russia Streaming Services Revenue (undefined) Forecast, by Application 2020 & 2033
- Table 25: Benelux Streaming Services Revenue (undefined) Forecast, by Application 2020 & 2033
- Table 26: Nordics Streaming Services Revenue (undefined) Forecast, by Application 2020 & 2033
- Table 27: Rest of Europe Streaming Services Revenue (undefined) Forecast, by Application 2020 & 2033
- Table 28: Global Streaming Services Revenue undefined Forecast, by Application 2020 & 2033
- Table 29: Global Streaming Services Revenue undefined Forecast, by Type 2020 & 2033
- Table 30: Global Streaming Services Revenue undefined Forecast, by Country 2020 & 2033
- Table 31: Turkey Streaming Services Revenue (undefined) Forecast, by Application 2020 & 2033
- Table 32: Israel Streaming Services Revenue (undefined) Forecast, by Application 2020 & 2033
- Table 33: GCC Streaming Services Revenue (undefined) Forecast, by Application 2020 & 2033
- Table 34: North Africa Streaming Services Revenue (undefined) Forecast, by Application 2020 & 2033
- Table 35: South Africa Streaming Services Revenue (undefined) Forecast, by Application 2020 & 2033
- Table 36: Rest of Middle East & Africa Streaming Services Revenue (undefined) Forecast, by Application 2020 & 2033
- Table 37: Global Streaming Services Revenue undefined Forecast, by Application 2020 & 2033
- Table 38: Global Streaming Services Revenue undefined Forecast, by Type 2020 & 2033
- Table 39: Global Streaming Services Revenue undefined Forecast, by Country 2020 & 2033
- Table 40: China Streaming Services Revenue (undefined) Forecast, by Application 2020 & 2033
- Table 41: India Streaming Services Revenue (undefined) Forecast, by Application 2020 & 2033
- Table 42: Japan Streaming Services Revenue (undefined) Forecast, by Application 2020 & 2033
- Table 43: South Korea Streaming Services Revenue (undefined) Forecast, by Application 2020 & 2033
- Table 44: ASEAN Streaming Services Revenue (undefined) Forecast, by Application 2020 & 2033
- Table 45: Oceania Streaming Services Revenue (undefined) Forecast, by Application 2020 & 2033
- Table 46: Rest of Asia Pacific Streaming Services Revenue (undefined) Forecast, by Application 2020 & 2033
Frequently Asked Questions
1. What is the projected Compound Annual Growth Rate (CAGR) of the Streaming Services?
The projected CAGR is approximately 15%.
2. Which companies are prominent players in the Streaming Services?
Key companies in the market include Netflix, Hulu, Amazon Instant Video, Playstation Vue, Sling Orange, Crackle, Funny or Die, Twitch, Vevo, HBO Now, YouTube TV, IQIYI, Youku, Acorn TV, CBS All Access, DirectTV Now, FuboTV Premier.
3. What are the main segments of the Streaming Services?
The market segments include Application, Type.
4. Can you provide details about the market size?
The market size is estimated to be USD XXX N/A as of 2022.
5. What are some drivers contributing to market growth?
N/A
6. What are the notable trends driving market growth?
N/A
7. Are there any restraints impacting market growth?
N/A
8. Can you provide examples of recent developments in the market?
N/A
9. What pricing options are available for accessing the report?
Pricing options include single-user, multi-user, and enterprise licenses priced at USD 2900.00, USD 4350.00, and USD 5800.00 respectively.
10. Is the market size provided in terms of value or volume?
The market size is provided in terms of value, measured in N/A.
11. Are there any specific market keywords associated with the report?
Yes, the market keyword associated with the report is "Streaming Services," which aids in identifying and referencing the specific market segment covered.
12. How do I determine which pricing option suits my needs best?
The pricing options vary based on user requirements and access needs. Individual users may opt for single-user licenses, while businesses requiring broader access may choose multi-user or enterprise licenses for cost-effective access to the report.
13. Are there any additional resources or data provided in the Streaming Services report?
While the report offers comprehensive insights, it's advisable to review the specific contents or supplementary materials provided to ascertain if additional resources or data are available.
14. How can I stay updated on further developments or reports in the Streaming Services?
To stay informed about further developments, trends, and reports in the Streaming Services, consider subscribing to industry newsletters, following relevant companies and organizations, or regularly checking reputable industry news sources and publications.
Methodology
Step 1 - Identification of Relevant Samples Size from Population Database


Step 2 - Approaches for Defining Global Market Size (Value, Volume* & Price*)

Note*: In applicable scenarios
Step 3 - Data Sources
Primary Research
- Web Analytics
- Survey Reports
- Research Institute
- Latest Research Reports
- Opinion Leaders
Secondary Research
- Annual Reports
- White Paper
- Latest Press Release
- Industry Association
- Paid Database
- Investor Presentations

Step 4 - Data Triangulation
Involves using different sources of information in order to increase the validity of a study
These sources are likely to be stakeholders in a program - participants, other researchers, program staff, other community members, and so on.
Then we put all data in single framework & apply various statistical tools to find out the dynamic on the market.
During the analysis stage, feedback from the stakeholder groups would be compared to determine areas of agreement as well as areas of divergence