

Key Insights
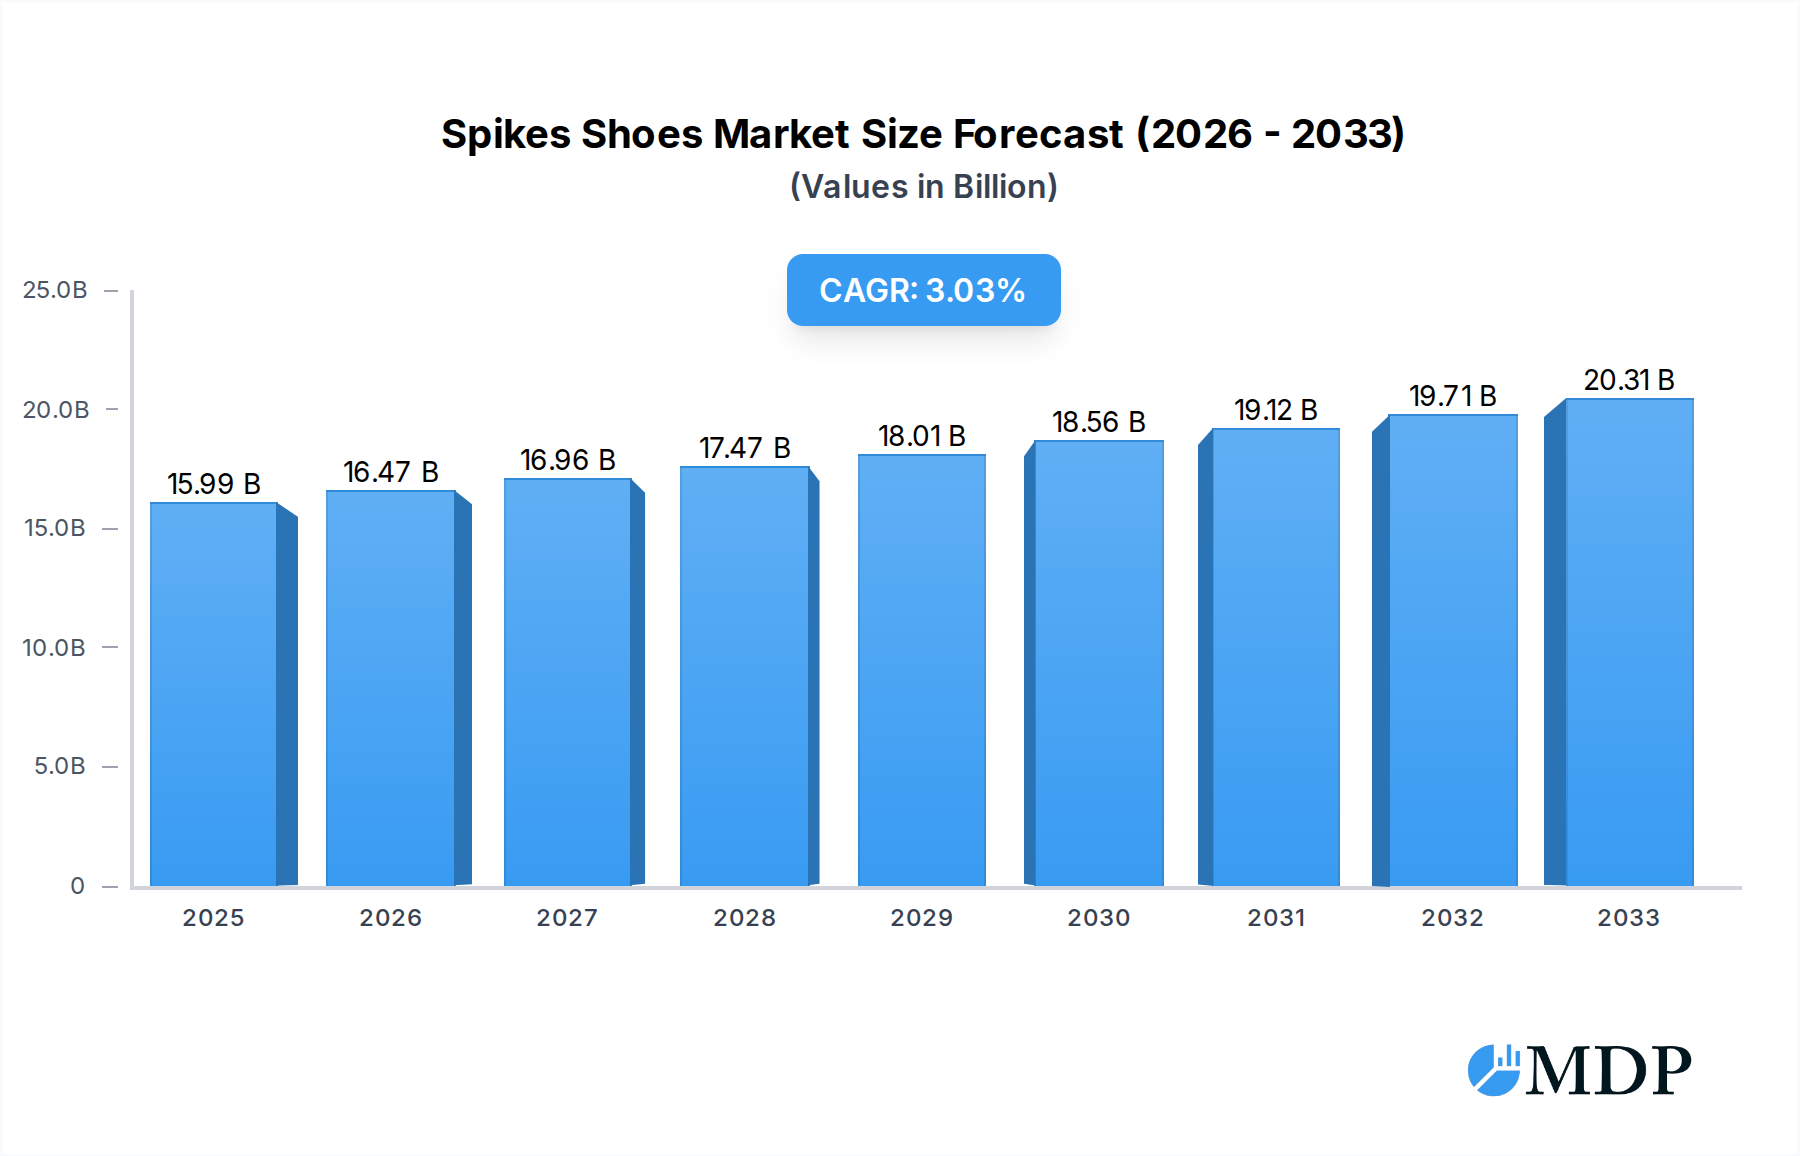
The global spikes shoes market is projected to reach approximately $15,990 million by 2025, exhibiting a Compound Annual Growth Rate (CAGR) of 3% from 2019 to 2033. This sustained growth is underpinned by several key drivers. Increased participation in athletic activities, from professional sports to recreational pursuits, directly fuels demand for specialized footwear like spikes shoes. The rising popularity of track and field, soccer, baseball, and other sports requiring enhanced traction and performance is a significant contributor. Furthermore, advancements in material science and shoe engineering are leading to the development of lighter, more durable, and performance-enhancing spikes shoes, attracting both professional athletes and amateur enthusiasts. The growing trend of athleisure and the integration of athletic footwear into everyday fashion also play a role, expanding the consumer base beyond hardcore athletes. E-commerce growth has also made these specialized shoes more accessible globally, further bolstering market expansion.

Spikes Shoes Market Size (In Billion)
The market is segmented by application into online sales and offline sales, with both channels experiencing growth as consumer purchasing habits evolve. Online sales benefit from convenience and wider selection, while offline sales offer the tactile experience of trying on shoes. By type, the market is divided into men's spikes and ladies' spikes, with both segments demonstrating consistent demand. Major players like Adidas, Nike, and PUMA are at the forefront, investing heavily in research and development to innovate and capture market share. Emerging trends include the development of eco-friendly spikes shoes and personalized footwear options. However, the market faces certain restraints, such as the high cost of specialized materials and manufacturing, and the relatively niche nature of some sports requiring specific spike configurations. Despite these challenges, the overall outlook for the spikes shoes market remains positive, driven by a continuous demand for performance-enhancing athletic gear.
Spikes Shoes Company Market Share
Unveiling the Future of Athletic Performance: Spikes Shoes Market Analysis 2019–2033
This comprehensive report provides an in-depth analysis of the global Spikes Shoes market, offering actionable insights for industry stakeholders. Covering a study period from 2019 to 2033, with a base year of 2025, this report delves into market dynamics, trends, leading segments, product developments, growth drivers, challenges, emerging opportunities, key players, and crucial milestones. Discover how innovations in athletic footwear are reshaping performance and driving market expansion.
Spikes Shoes Market Dynamics & Concentration
The global Spikes Shoes market exhibits a moderate concentration, characterized by the presence of both established global giants and emerging regional players. Key innovation drivers include advancements in material science for enhanced performance and durability, alongside a growing emphasis on biomechanics and athlete-specific design. Regulatory frameworks, while generally supportive of industry growth, can vary by region, impacting product standards and market entry. Product substitutes, such as high-performance athletic shoes without specific spike configurations, pose a challenge, though the niche appeal and performance benefits of spikes remain a strong differentiator. End-user trends are increasingly driven by specialization in sports, a focus on injury prevention, and a growing demand for customized and sustainable footwear. Merger and acquisition (M&A) activities, while not exceptionally high in volume, are strategically focused on acquiring technological expertise or expanding market reach. For instance, the M&A deal count in recent years has hovered around xx, with deal values reaching in the range of hundreds of million. Market share distribution sees dominant players like Nike and Adidas holding significant portions, estimated at over 30% and 25% respectively, while other players like PUMA, Asics Corporation, and New Balance collectively capture another xx% of the market.
Spikes Shoes Industry Trends & Analysis
The Spikes Shoes industry is poised for robust growth, driven by a confluence of factors including increasing participation in track and field, athletics, and specialized sports globally. The Compound Annual Growth Rate (CAGR) is projected to be a healthy xx% over the forecast period of 2025–2033. Technological disruptions are a significant trend, with manufacturers continuously innovating through advanced materials like carbon fiber composites, responsive cushioning systems, and 3D printing for personalized fit and performance enhancement. Consumer preferences are evolving to demand lighter, more durable, and aesthetically appealing spike shoes that offer superior traction and energy return. The competitive landscape is dynamic, with established brands like Nike, Adidas, PUMA, and Asics Corporation investing heavily in research and development and athlete endorsements. Emerging brands and regional players, particularly from Asia like Li-Ning and ANTA, are also gaining traction by offering competitive products at attractive price points. Market penetration is gradually increasing as more individuals engage in sports requiring specialized footwear. The overall market value is expected to reach over ten million by 2025, with projections indicating growth beyond a hundred million by 2033.
Leading Markets & Segments in Spikes Shoes
The Men's Spikes segment is currently the dominant force in the global Spikes Shoes market, driven by higher participation rates in male-dominated athletic disciplines and a greater historical focus on performance-oriented footwear for men. The Online Sales channel is rapidly gaining prominence, projected to account for over xx% of total sales by 2025. This surge is attributable to the convenience, wider product selection, and competitive pricing offered by e-commerce platforms. Key drivers for the dominance of Men's Spikes include:
- Economic Policies: Increased investment in sports infrastructure and development programs in key regions, particularly those with strong athletic traditions.
- Infrastructure: The proliferation of dedicated athletic tracks and field facilities worldwide supports higher participation and demand for specialized spike shoes.
- Consumer Behavior: A sustained cultural emphasis on athletic achievement and performance among male athletes.
While Ladies Spikes are experiencing significant growth due to increasing female participation in sports and a focus on gender-specific design and fit, they still represent a smaller portion of the overall market. Offline Sales, though declining in relative share, remain crucial for the brick-and-mortar retail experience, allowing for trial and expert fitting. The dominance of the Men's Spikes segment is further solidified by substantial marketing efforts and product development strategies by leading brands historically targeted at male athletes. However, the gap is narrowing as manufacturers increasingly recognize and cater to the unique needs of female athletes.
Spikes Shoes Product Developments
Recent product developments in the Spikes Shoes market are revolutionizing athletic performance. Innovations focus on lightweight, ultra-responsive materials such as graphene-infused foams and advanced carbon plate technology to maximize energy return and propulsion. Designers are incorporating adaptive fit systems, utilizing AI-driven customization to create footwear that precisely matches individual biomechanics, thereby minimizing injury risk and optimizing efficiency. Competitive advantages are being gained through superior traction patterns, aerodynamic designs, and the integration of smart sensor technology to track performance metrics. These advancements cater to the evolving needs of athletes seeking every possible edge.
Key Drivers of Spikes Shoes Growth
The Spikes Shoes market is experiencing significant growth fueled by several key drivers. Increasing global participation in track and field, athletics, and other sports requiring specialized footwear is a primary catalyst. Technological advancements in material science, leading to lighter, more durable, and performance-enhancing shoes, are also critical. Furthermore, growing athlete awareness of the benefits of specialized footwear for improved performance and injury prevention plays a crucial role. The rise of e-commerce platforms offers greater accessibility and a wider selection, contributing to market expansion. Strategic marketing campaigns and athlete endorsements by major brands further bolster demand.
Challenges in the Spikes Shoes Market
Despite robust growth, the Spikes Shoes market faces certain challenges. High manufacturing costs associated with advanced materials and specialized designs can lead to premium pricing, potentially limiting accessibility for some consumers. Intense competition from established global brands and the emergence of new players also creates pressure on profit margins. Supply chain disruptions, as witnessed in recent global events, can impact production and lead times. Regulatory hurdles in specific markets regarding material standards or import/export regulations can also pose challenges. The relatively niche application compared to general athletic footwear also limits market size for certain specialized spike types.
Emerging Opportunities in Spikes Shoes
Emerging opportunities in the Spikes Shoes market lie in several key areas. The increasing focus on sustainability and eco-friendly materials presents a significant avenue for innovation and market differentiation. Growth in emerging economies with a rising middle class and increased investment in sports infrastructure offers substantial untapped potential. The development of smart footwear with integrated sensors for performance tracking and data analysis is another promising frontier. Furthermore, expanding the product line to cater to an even wider range of specialized sports and recreational activities can unlock new consumer segments. Strategic partnerships with sports organizations and athletes will continue to be vital for market penetration.
Leading Players in the Spikes Shoes Sector
- Adidas
- Nike
- PUMA
- Asics Corporation
- New Balance
- Li-Ning
- Under Armour
- Stallion Sports
- Mizuno Corporation
- Saucony
- Spikes Shoes
- ECCO Sko A/S
- Skechers
- ANTA
- 361°
- PEAK
- Guirenniao
- Xtep
- China Dongxiang
Key Milestones in Spikes Shoes Industry
- 2019: Introduction of advanced carbon fiber plates in track spikes by multiple leading brands, significantly improving energy return and performance.
- 2020: Increased investment in research and development for sustainable and recycled materials in athletic footwear, impacting spike shoe manufacturing.
- 2021: Notable M&A activity as larger companies acquired innovative smaller firms specializing in biomechanical design and material science, aiming for a combined market value in the hundreds of million.
- 2022: Launch of AI-driven customization platforms allowing athletes to design personalized spike shoe configurations, indicating a move towards hyper-personalization.
- 2023: Growing consumer demand for lightweight and versatile spike shoes suitable for multiple track and field disciplines, driving product diversification.
- 2024: Significant advancements in 3D printing technology for footwear, enabling rapid prototyping and the creation of highly customized spike shoe components.
Strategic Outlook for Spikes Shoes Market
The strategic outlook for the Spikes Shoes market is exceptionally positive, driven by continued innovation and expanding global participation in sports. Key growth accelerators include the persistent demand for high-performance athletic gear, advancements in material science and footwear technology, and the increasing disposable income in emerging markets. Companies that focus on sustainable manufacturing practices, personalized product offerings, and leveraging digital channels for sales and engagement are best positioned for future success. Strategic partnerships and a deep understanding of evolving athlete needs will be paramount in capitalizing on the projected market expansion, expected to reach over a hundred million by 2033.
Spikes Shoes Segmentation
-
1. Application
- 1.1. Online Sales
- 1.2. Offline Sales
-
2. Types
- 2.1. Men's Spikes
- 2.2. Ladies Spikes
Spikes Shoes Segmentation By Geography
-
1. North America
- 1.1. United States
- 1.2. Canada
- 1.3. Mexico
-
2. South America
- 2.1. Brazil
- 2.2. Argentina
- 2.3. Rest of South America
-
3. Europe
- 3.1. United Kingdom
- 3.2. Germany
- 3.3. France
- 3.4. Italy
- 3.5. Spain
- 3.6. Russia
- 3.7. Benelux
- 3.8. Nordics
- 3.9. Rest of Europe
-
4. Middle East & Africa
- 4.1. Turkey
- 4.2. Israel
- 4.3. GCC
- 4.4. North Africa
- 4.5. South Africa
- 4.6. Rest of Middle East & Africa
-
5. Asia Pacific
- 5.1. China
- 5.2. India
- 5.3. Japan
- 5.4. South Korea
- 5.5. ASEAN
- 5.6. Oceania
- 5.7. Rest of Asia Pacific
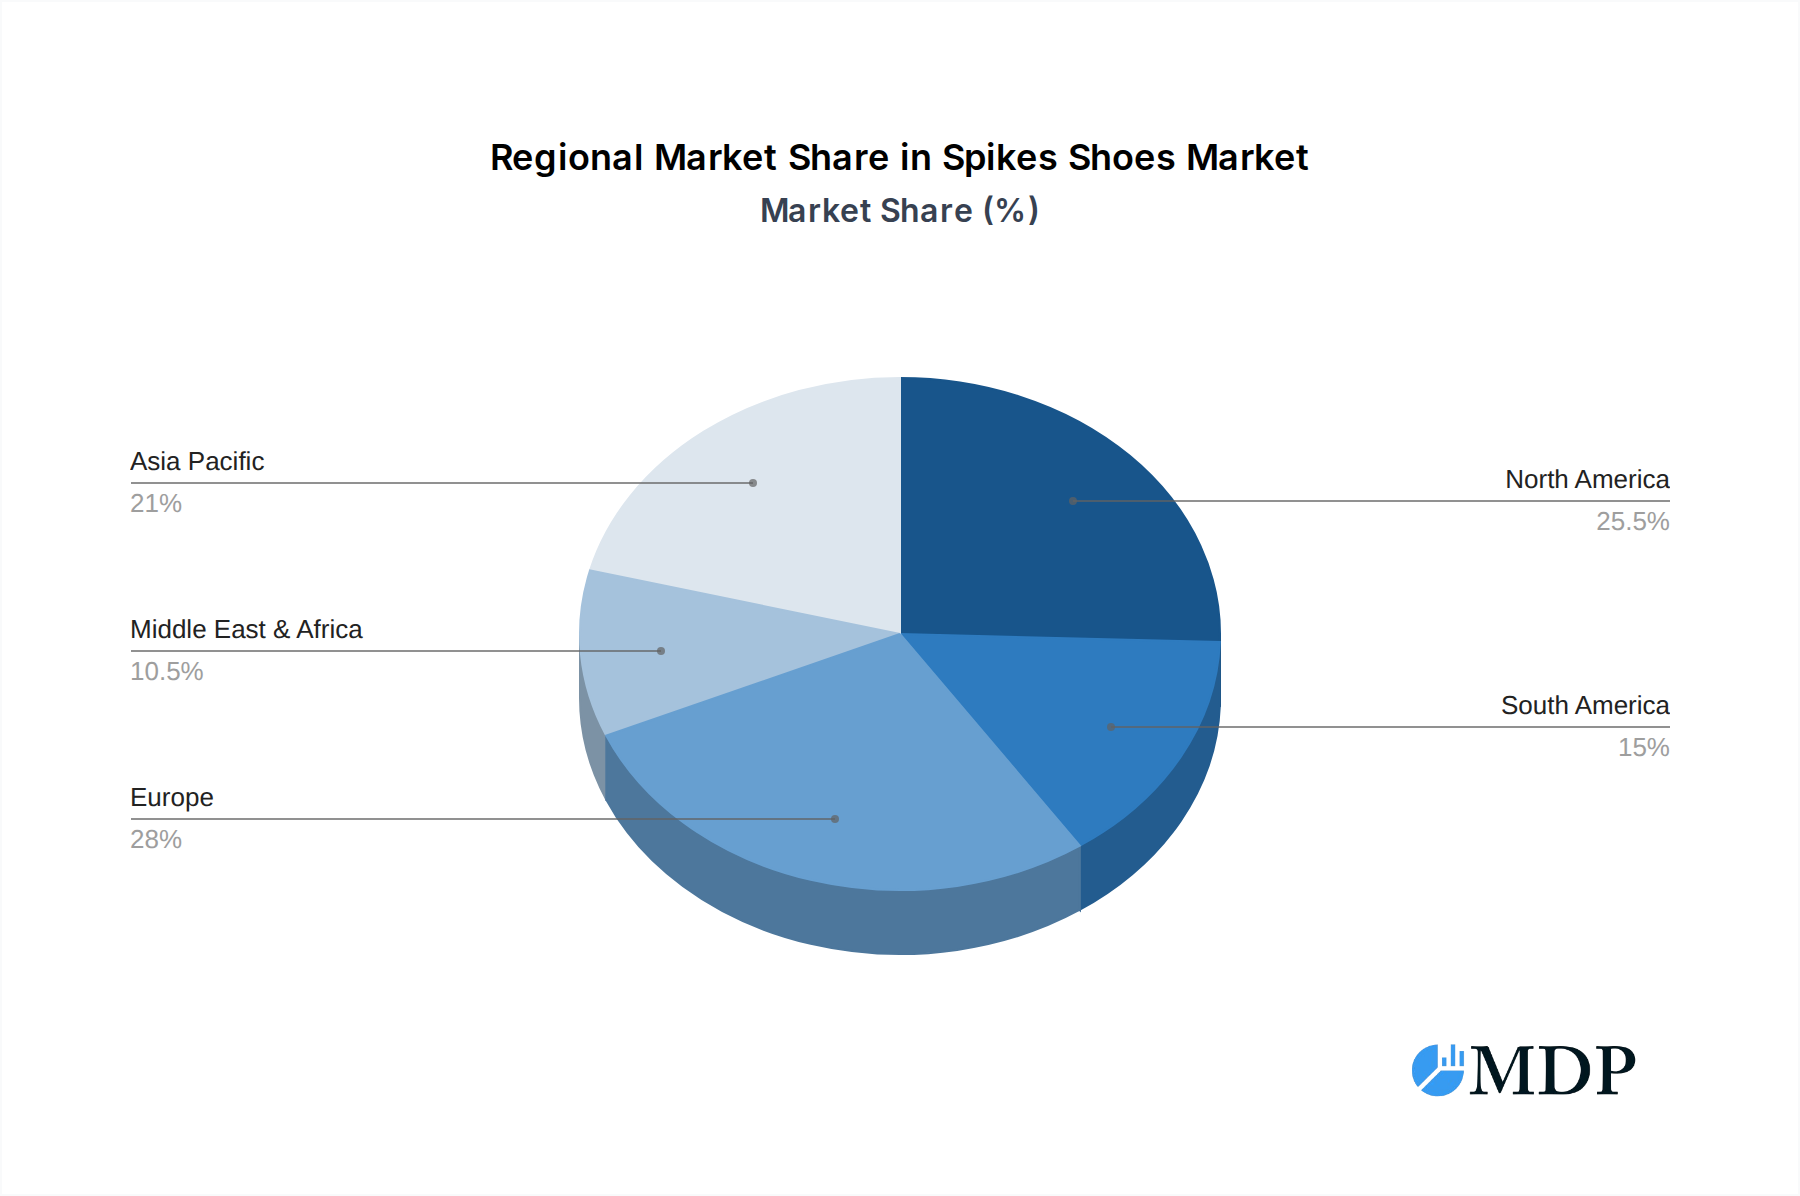
Spikes Shoes Regional Market Share
Geographic Coverage of Spikes Shoes
Spikes Shoes REPORT HIGHLIGHTS
| Aspects | Details |
|---|---|
| Study Period | 2020-2034 |
| Base Year | 2025 |
| Estimated Year | 2026 |
| Forecast Period | 2026-2034 |
| Historical Period | 2020-2025 |
| Growth Rate | CAGR of 3% from 2020-2034 |
| Segmentation |
|
Table of Contents
- 1. Introduction
- 1.1. Research Scope
- 1.2. Market Segmentation
- 1.3. Research Objective
- 1.4. Definitions and Assumptions
- 2. Executive Summary
- 2.1. Market Snapshot
- 3. Market Dynamics
- 3.1. Market Drivers
- 3.2. Market Restrains
- 3.3. Market Trends
- 3.4. Market Opportunities
- 4. Market Factor Analysis
- 4.1. Porters Five Forces
- 4.1.1. Bargaining Power of Suppliers
- 4.1.2. Bargaining Power of Buyers
- 4.1.3. Threat of New Entrants
- 4.1.4. Threat of Substitutes
- 4.1.5. Competitive Rivalry
- 4.2. PESTEL analysis
- 4.3. BCG Analysis
- 4.3.1. Stars (High Growth, High Market Share)
- 4.3.2. Cash Cows (Low Growth, High Market Share)
- 4.3.3. Question Mark (High Growth, Low Market Share)
- 4.3.4. Dogs (Low Growth, Low Market Share)
- 4.4. Ansoff Matrix Analysis
- 4.5. Supply Chain Analysis
- 4.6. Regulatory Landscape
- 4.7. Current Market Potential and Opportunity Assessment (TAM–SAM–SOM Framework)
- 4.8. MDP Analyst Note
- 4.1. Porters Five Forces
- 5. Market Analysis, Insights and Forecast 2021-2033
- 5.1. Market Analysis, Insights and Forecast - by Application
- 5.1.1. Online Sales
- 5.1.2. Offline Sales
- 5.2. Market Analysis, Insights and Forecast - by Types
- 5.2.1. Men's Spikes
- 5.2.2. Ladies Spikes
- 5.3. Market Analysis, Insights and Forecast - by Region
- 5.3.1. North America
- 5.3.2. South America
- 5.3.3. Europe
- 5.3.4. Middle East & Africa
- 5.3.5. Asia Pacific
- 5.1. Market Analysis, Insights and Forecast - by Application
- 6. Global Spikes Shoes Analysis, Insights and Forecast, 2021-2033
- 6.1. Market Analysis, Insights and Forecast - by Application
- 6.1.1. Online Sales
- 6.1.2. Offline Sales
- 6.2. Market Analysis, Insights and Forecast - by Types
- 6.2.1. Men's Spikes
- 6.2.2. Ladies Spikes
- 6.1. Market Analysis, Insights and Forecast - by Application
- 7. North America Spikes Shoes Analysis, Insights and Forecast, 2020-2032
- 7.1. Market Analysis, Insights and Forecast - by Application
- 7.1.1. Online Sales
- 7.1.2. Offline Sales
- 7.2. Market Analysis, Insights and Forecast - by Types
- 7.2.1. Men's Spikes
- 7.2.2. Ladies Spikes
- 7.1. Market Analysis, Insights and Forecast - by Application
- 8. South America Spikes Shoes Analysis, Insights and Forecast, 2020-2032
- 8.1. Market Analysis, Insights and Forecast - by Application
- 8.1.1. Online Sales
- 8.1.2. Offline Sales
- 8.2. Market Analysis, Insights and Forecast - by Types
- 8.2.1. Men's Spikes
- 8.2.2. Ladies Spikes
- 8.1. Market Analysis, Insights and Forecast - by Application
- 9. Europe Spikes Shoes Analysis, Insights and Forecast, 2020-2032
- 9.1. Market Analysis, Insights and Forecast - by Application
- 9.1.1. Online Sales
- 9.1.2. Offline Sales
- 9.2. Market Analysis, Insights and Forecast - by Types
- 9.2.1. Men's Spikes
- 9.2.2. Ladies Spikes
- 9.1. Market Analysis, Insights and Forecast - by Application
- 10. Middle East & Africa Spikes Shoes Analysis, Insights and Forecast, 2020-2032
- 10.1. Market Analysis, Insights and Forecast - by Application
- 10.1.1. Online Sales
- 10.1.2. Offline Sales
- 10.2. Market Analysis, Insights and Forecast - by Types
- 10.2.1. Men's Spikes
- 10.2.2. Ladies Spikes
- 10.1. Market Analysis, Insights and Forecast - by Application
- 11. Asia Pacific Spikes Shoes Analysis, Insights and Forecast, 2020-2032
- 11.1. Market Analysis, Insights and Forecast - by Application
- 11.1.1. Online Sales
- 11.1.2. Offline Sales
- 11.2. Market Analysis, Insights and Forecast - by Types
- 11.2.1. Men's Spikes
- 11.2.2. Ladies Spikes
- 11.1. Market Analysis, Insights and Forecast - by Application
- 12. Competitive Analysis
- 12.1. Company Profiles
- 12.1.1 Adidas
- 12.1.1.1. Company Overview
- 12.1.1.2. Products
- 12.1.1.3. Company Financials
- 12.1.1.4. SWOT Analysis
- 12.1.2 Nike
- 12.1.2.1. Company Overview
- 12.1.2.2. Products
- 12.1.2.3. Company Financials
- 12.1.2.4. SWOT Analysis
- 12.1.3 PUMA
- 12.1.3.1. Company Overview
- 12.1.3.2. Products
- 12.1.3.3. Company Financials
- 12.1.3.4. SWOT Analysis
- 12.1.4 Asics Corporation
- 12.1.4.1. Company Overview
- 12.1.4.2. Products
- 12.1.4.3. Company Financials
- 12.1.4.4. SWOT Analysis
- 12.1.5 New Balance
- 12.1.5.1. Company Overview
- 12.1.5.2. Products
- 12.1.5.3. Company Financials
- 12.1.5.4. SWOT Analysis
- 12.1.6 Li-Ning
- 12.1.6.1. Company Overview
- 12.1.6.2. Products
- 12.1.6.3. Company Financials
- 12.1.6.4. SWOT Analysis
- 12.1.7 Under Armour
- 12.1.7.1. Company Overview
- 12.1.7.2. Products
- 12.1.7.3. Company Financials
- 12.1.7.4. SWOT Analysis
- 12.1.8 Stallion Sports
- 12.1.8.1. Company Overview
- 12.1.8.2. Products
- 12.1.8.3. Company Financials
- 12.1.8.4. SWOT Analysis
- 12.1.9 Mizuno Corporation
- 12.1.9.1. Company Overview
- 12.1.9.2. Products
- 12.1.9.3. Company Financials
- 12.1.9.4. SWOT Analysis
- 12.1.10 Saucony
- 12.1.10.1. Company Overview
- 12.1.10.2. Products
- 12.1.10.3. Company Financials
- 12.1.10.4. SWOT Analysis
- 12.1.11 Spikes Shoes
- 12.1.11.1. Company Overview
- 12.1.11.2. Products
- 12.1.11.3. Company Financials
- 12.1.11.4. SWOT Analysis
- 12.1.12 New Balance
- 12.1.12.1. Company Overview
- 12.1.12.2. Products
- 12.1.12.3. Company Financials
- 12.1.12.4. SWOT Analysis
- 12.1.13 ECCO Sko A/S
- 12.1.13.1. Company Overview
- 12.1.13.2. Products
- 12.1.13.3. Company Financials
- 12.1.13.4. SWOT Analysis
- 12.1.14 Skecher
- 12.1.14.1. Company Overview
- 12.1.14.2. Products
- 12.1.14.3. Company Financials
- 12.1.14.4. SWOT Analysis
- 12.1.15 ANTA
- 12.1.15.1. Company Overview
- 12.1.15.2. Products
- 12.1.15.3. Company Financials
- 12.1.15.4. SWOT Analysis
- 12.1.16 361°
- 12.1.16.1. Company Overview
- 12.1.16.2. Products
- 12.1.16.3. Company Financials
- 12.1.16.4. SWOT Analysis
- 12.1.17 PEAK
- 12.1.17.1. Company Overview
- 12.1.17.2. Products
- 12.1.17.3. Company Financials
- 12.1.17.4. SWOT Analysis
- 12.1.18 Guirenniao
- 12.1.18.1. Company Overview
- 12.1.18.2. Products
- 12.1.18.3. Company Financials
- 12.1.18.4. SWOT Analysis
- 12.1.19 Xtep
- 12.1.19.1. Company Overview
- 12.1.19.2. Products
- 12.1.19.3. Company Financials
- 12.1.19.4. SWOT Analysis
- 12.1.20 China Dongxiang
- 12.1.20.1. Company Overview
- 12.1.20.2. Products
- 12.1.20.3. Company Financials
- 12.1.20.4. SWOT Analysis
- 12.1.1 Adidas
- 12.2. Market Entropy
- 12.2.1 Company's Key Areas Served
- 12.2.2 Recent Developments
- 12.3. Company Market Share Analysis 2025
- 12.3.1 Top 5 Companies Market Share Analysis
- 12.3.2 Top 3 Companies Market Share Analysis
- 12.4. List of Potential Customers
- 13. Research Methodology
List of Figures
- Figure 1: Global Spikes Shoes Revenue Breakdown (million, %) by Region 2025 & 2033
- Figure 2: Global Spikes Shoes Volume Breakdown (K, %) by Region 2025 & 2033
- Figure 3: North America Spikes Shoes Revenue (million), by Application 2025 & 2033
- Figure 4: North America Spikes Shoes Volume (K), by Application 2025 & 2033
- Figure 5: North America Spikes Shoes Revenue Share (%), by Application 2025 & 2033
- Figure 6: North America Spikes Shoes Volume Share (%), by Application 2025 & 2033
- Figure 7: North America Spikes Shoes Revenue (million), by Types 2025 & 2033
- Figure 8: North America Spikes Shoes Volume (K), by Types 2025 & 2033
- Figure 9: North America Spikes Shoes Revenue Share (%), by Types 2025 & 2033
- Figure 10: North America Spikes Shoes Volume Share (%), by Types 2025 & 2033
- Figure 11: North America Spikes Shoes Revenue (million), by Country 2025 & 2033
- Figure 12: North America Spikes Shoes Volume (K), by Country 2025 & 2033
- Figure 13: North America Spikes Shoes Revenue Share (%), by Country 2025 & 2033
- Figure 14: North America Spikes Shoes Volume Share (%), by Country 2025 & 2033
- Figure 15: South America Spikes Shoes Revenue (million), by Application 2025 & 2033
- Figure 16: South America Spikes Shoes Volume (K), by Application 2025 & 2033
- Figure 17: South America Spikes Shoes Revenue Share (%), by Application 2025 & 2033
- Figure 18: South America Spikes Shoes Volume Share (%), by Application 2025 & 2033
- Figure 19: South America Spikes Shoes Revenue (million), by Types 2025 & 2033
- Figure 20: South America Spikes Shoes Volume (K), by Types 2025 & 2033
- Figure 21: South America Spikes Shoes Revenue Share (%), by Types 2025 & 2033
- Figure 22: South America Spikes Shoes Volume Share (%), by Types 2025 & 2033
- Figure 23: South America Spikes Shoes Revenue (million), by Country 2025 & 2033
- Figure 24: South America Spikes Shoes Volume (K), by Country 2025 & 2033
- Figure 25: South America Spikes Shoes Revenue Share (%), by Country 2025 & 2033
- Figure 26: South America Spikes Shoes Volume Share (%), by Country 2025 & 2033
- Figure 27: Europe Spikes Shoes Revenue (million), by Application 2025 & 2033
- Figure 28: Europe Spikes Shoes Volume (K), by Application 2025 & 2033
- Figure 29: Europe Spikes Shoes Revenue Share (%), by Application 2025 & 2033
- Figure 30: Europe Spikes Shoes Volume Share (%), by Application 2025 & 2033
- Figure 31: Europe Spikes Shoes Revenue (million), by Types 2025 & 2033
- Figure 32: Europe Spikes Shoes Volume (K), by Types 2025 & 2033
- Figure 33: Europe Spikes Shoes Revenue Share (%), by Types 2025 & 2033
- Figure 34: Europe Spikes Shoes Volume Share (%), by Types 2025 & 2033
- Figure 35: Europe Spikes Shoes Revenue (million), by Country 2025 & 2033
- Figure 36: Europe Spikes Shoes Volume (K), by Country 2025 & 2033
- Figure 37: Europe Spikes Shoes Revenue Share (%), by Country 2025 & 2033
- Figure 38: Europe Spikes Shoes Volume Share (%), by Country 2025 & 2033
- Figure 39: Middle East & Africa Spikes Shoes Revenue (million), by Application 2025 & 2033
- Figure 40: Middle East & Africa Spikes Shoes Volume (K), by Application 2025 & 2033
- Figure 41: Middle East & Africa Spikes Shoes Revenue Share (%), by Application 2025 & 2033
- Figure 42: Middle East & Africa Spikes Shoes Volume Share (%), by Application 2025 & 2033
- Figure 43: Middle East & Africa Spikes Shoes Revenue (million), by Types 2025 & 2033
- Figure 44: Middle East & Africa Spikes Shoes Volume (K), by Types 2025 & 2033
- Figure 45: Middle East & Africa Spikes Shoes Revenue Share (%), by Types 2025 & 2033
- Figure 46: Middle East & Africa Spikes Shoes Volume Share (%), by Types 2025 & 2033
- Figure 47: Middle East & Africa Spikes Shoes Revenue (million), by Country 2025 & 2033
- Figure 48: Middle East & Africa Spikes Shoes Volume (K), by Country 2025 & 2033
- Figure 49: Middle East & Africa Spikes Shoes Revenue Share (%), by Country 2025 & 2033
- Figure 50: Middle East & Africa Spikes Shoes Volume Share (%), by Country 2025 & 2033
- Figure 51: Asia Pacific Spikes Shoes Revenue (million), by Application 2025 & 2033
- Figure 52: Asia Pacific Spikes Shoes Volume (K), by Application 2025 & 2033
- Figure 53: Asia Pacific Spikes Shoes Revenue Share (%), by Application 2025 & 2033
- Figure 54: Asia Pacific Spikes Shoes Volume Share (%), by Application 2025 & 2033
- Figure 55: Asia Pacific Spikes Shoes Revenue (million), by Types 2025 & 2033
- Figure 56: Asia Pacific Spikes Shoes Volume (K), by Types 2025 & 2033
- Figure 57: Asia Pacific Spikes Shoes Revenue Share (%), by Types 2025 & 2033
- Figure 58: Asia Pacific Spikes Shoes Volume Share (%), by Types 2025 & 2033
- Figure 59: Asia Pacific Spikes Shoes Revenue (million), by Country 2025 & 2033
- Figure 60: Asia Pacific Spikes Shoes Volume (K), by Country 2025 & 2033
- Figure 61: Asia Pacific Spikes Shoes Revenue Share (%), by Country 2025 & 2033
- Figure 62: Asia Pacific Spikes Shoes Volume Share (%), by Country 2025 & 2033
List of Tables
- Table 1: Global Spikes Shoes Revenue million Forecast, by Application 2020 & 2033
- Table 2: Global Spikes Shoes Volume K Forecast, by Application 2020 & 2033
- Table 3: Global Spikes Shoes Revenue million Forecast, by Types 2020 & 2033
- Table 4: Global Spikes Shoes Volume K Forecast, by Types 2020 & 2033
- Table 5: Global Spikes Shoes Revenue million Forecast, by Region 2020 & 2033
- Table 6: Global Spikes Shoes Volume K Forecast, by Region 2020 & 2033
- Table 7: Global Spikes Shoes Revenue million Forecast, by Application 2020 & 2033
- Table 8: Global Spikes Shoes Volume K Forecast, by Application 2020 & 2033
- Table 9: Global Spikes Shoes Revenue million Forecast, by Types 2020 & 2033
- Table 10: Global Spikes Shoes Volume K Forecast, by Types 2020 & 2033
- Table 11: Global Spikes Shoes Revenue million Forecast, by Country 2020 & 2033
- Table 12: Global Spikes Shoes Volume K Forecast, by Country 2020 & 2033
- Table 13: United States Spikes Shoes Revenue (million) Forecast, by Application 2020 & 2033
- Table 14: United States Spikes Shoes Volume (K) Forecast, by Application 2020 & 2033
- Table 15: Canada Spikes Shoes Revenue (million) Forecast, by Application 2020 & 2033
- Table 16: Canada Spikes Shoes Volume (K) Forecast, by Application 2020 & 2033
- Table 17: Mexico Spikes Shoes Revenue (million) Forecast, by Application 2020 & 2033
- Table 18: Mexico Spikes Shoes Volume (K) Forecast, by Application 2020 & 2033
- Table 19: Global Spikes Shoes Revenue million Forecast, by Application 2020 & 2033
- Table 20: Global Spikes Shoes Volume K Forecast, by Application 2020 & 2033
- Table 21: Global Spikes Shoes Revenue million Forecast, by Types 2020 & 2033
- Table 22: Global Spikes Shoes Volume K Forecast, by Types 2020 & 2033
- Table 23: Global Spikes Shoes Revenue million Forecast, by Country 2020 & 2033
- Table 24: Global Spikes Shoes Volume K Forecast, by Country 2020 & 2033
- Table 25: Brazil Spikes Shoes Revenue (million) Forecast, by Application 2020 & 2033
- Table 26: Brazil Spikes Shoes Volume (K) Forecast, by Application 2020 & 2033
- Table 27: Argentina Spikes Shoes Revenue (million) Forecast, by Application 2020 & 2033
- Table 28: Argentina Spikes Shoes Volume (K) Forecast, by Application 2020 & 2033
- Table 29: Rest of South America Spikes Shoes Revenue (million) Forecast, by Application 2020 & 2033
- Table 30: Rest of South America Spikes Shoes Volume (K) Forecast, by Application 2020 & 2033
- Table 31: Global Spikes Shoes Revenue million Forecast, by Application 2020 & 2033
- Table 32: Global Spikes Shoes Volume K Forecast, by Application 2020 & 2033
- Table 33: Global Spikes Shoes Revenue million Forecast, by Types 2020 & 2033
- Table 34: Global Spikes Shoes Volume K Forecast, by Types 2020 & 2033
- Table 35: Global Spikes Shoes Revenue million Forecast, by Country 2020 & 2033
- Table 36: Global Spikes Shoes Volume K Forecast, by Country 2020 & 2033
- Table 37: United Kingdom Spikes Shoes Revenue (million) Forecast, by Application 2020 & 2033
- Table 38: United Kingdom Spikes Shoes Volume (K) Forecast, by Application 2020 & 2033
- Table 39: Germany Spikes Shoes Revenue (million) Forecast, by Application 2020 & 2033
- Table 40: Germany Spikes Shoes Volume (K) Forecast, by Application 2020 & 2033
- Table 41: France Spikes Shoes Revenue (million) Forecast, by Application 2020 & 2033
- Table 42: France Spikes Shoes Volume (K) Forecast, by Application 2020 & 2033
- Table 43: Italy Spikes Shoes Revenue (million) Forecast, by Application 2020 & 2033
- Table 44: Italy Spikes Shoes Volume (K) Forecast, by Application 2020 & 2033
- Table 45: Spain Spikes Shoes Revenue (million) Forecast, by Application 2020 & 2033
- Table 46: Spain Spikes Shoes Volume (K) Forecast, by Application 2020 & 2033
- Table 47: Russia Spikes Shoes Revenue (million) Forecast, by Application 2020 & 2033
- Table 48: Russia Spikes Shoes Volume (K) Forecast, by Application 2020 & 2033
- Table 49: Benelux Spikes Shoes Revenue (million) Forecast, by Application 2020 & 2033
- Table 50: Benelux Spikes Shoes Volume (K) Forecast, by Application 2020 & 2033
- Table 51: Nordics Spikes Shoes Revenue (million) Forecast, by Application 2020 & 2033
- Table 52: Nordics Spikes Shoes Volume (K) Forecast, by Application 2020 & 2033
- Table 53: Rest of Europe Spikes Shoes Revenue (million) Forecast, by Application 2020 & 2033
- Table 54: Rest of Europe Spikes Shoes Volume (K) Forecast, by Application 2020 & 2033
- Table 55: Global Spikes Shoes Revenue million Forecast, by Application 2020 & 2033
- Table 56: Global Spikes Shoes Volume K Forecast, by Application 2020 & 2033
- Table 57: Global Spikes Shoes Revenue million Forecast, by Types 2020 & 2033
- Table 58: Global Spikes Shoes Volume K Forecast, by Types 2020 & 2033
- Table 59: Global Spikes Shoes Revenue million Forecast, by Country 2020 & 2033
- Table 60: Global Spikes Shoes Volume K Forecast, by Country 2020 & 2033
- Table 61: Turkey Spikes Shoes Revenue (million) Forecast, by Application 2020 & 2033
- Table 62: Turkey Spikes Shoes Volume (K) Forecast, by Application 2020 & 2033
- Table 63: Israel Spikes Shoes Revenue (million) Forecast, by Application 2020 & 2033
- Table 64: Israel Spikes Shoes Volume (K) Forecast, by Application 2020 & 2033
- Table 65: GCC Spikes Shoes Revenue (million) Forecast, by Application 2020 & 2033
- Table 66: GCC Spikes Shoes Volume (K) Forecast, by Application 2020 & 2033
- Table 67: North Africa Spikes Shoes Revenue (million) Forecast, by Application 2020 & 2033
- Table 68: North Africa Spikes Shoes Volume (K) Forecast, by Application 2020 & 2033
- Table 69: South Africa Spikes Shoes Revenue (million) Forecast, by Application 2020 & 2033
- Table 70: South Africa Spikes Shoes Volume (K) Forecast, by Application 2020 & 2033
- Table 71: Rest of Middle East & Africa Spikes Shoes Revenue (million) Forecast, by Application 2020 & 2033
- Table 72: Rest of Middle East & Africa Spikes Shoes Volume (K) Forecast, by Application 2020 & 2033
- Table 73: Global Spikes Shoes Revenue million Forecast, by Application 2020 & 2033
- Table 74: Global Spikes Shoes Volume K Forecast, by Application 2020 & 2033
- Table 75: Global Spikes Shoes Revenue million Forecast, by Types 2020 & 2033
- Table 76: Global Spikes Shoes Volume K Forecast, by Types 2020 & 2033
- Table 77: Global Spikes Shoes Revenue million Forecast, by Country 2020 & 2033
- Table 78: Global Spikes Shoes Volume K Forecast, by Country 2020 & 2033
- Table 79: China Spikes Shoes Revenue (million) Forecast, by Application 2020 & 2033
- Table 80: China Spikes Shoes Volume (K) Forecast, by Application 2020 & 2033
- Table 81: India Spikes Shoes Revenue (million) Forecast, by Application 2020 & 2033
- Table 82: India Spikes Shoes Volume (K) Forecast, by Application 2020 & 2033
- Table 83: Japan Spikes Shoes Revenue (million) Forecast, by Application 2020 & 2033
- Table 84: Japan Spikes Shoes Volume (K) Forecast, by Application 2020 & 2033
- Table 85: South Korea Spikes Shoes Revenue (million) Forecast, by Application 2020 & 2033
- Table 86: South Korea Spikes Shoes Volume (K) Forecast, by Application 2020 & 2033
- Table 87: ASEAN Spikes Shoes Revenue (million) Forecast, by Application 2020 & 2033
- Table 88: ASEAN Spikes Shoes Volume (K) Forecast, by Application 2020 & 2033
- Table 89: Oceania Spikes Shoes Revenue (million) Forecast, by Application 2020 & 2033
- Table 90: Oceania Spikes Shoes Volume (K) Forecast, by Application 2020 & 2033
- Table 91: Rest of Asia Pacific Spikes Shoes Revenue (million) Forecast, by Application 2020 & 2033
- Table 92: Rest of Asia Pacific Spikes Shoes Volume (K) Forecast, by Application 2020 & 2033
Frequently Asked Questions
1. What is the projected Compound Annual Growth Rate (CAGR) of the Spikes Shoes?
The projected CAGR is approximately 3%.
2. Which companies are prominent players in the Spikes Shoes?
Key companies in the market include Adidas, Nike, PUMA, Asics Corporation, New Balance, Li-Ning, Under Armour, Stallion Sports, Mizuno Corporation, Saucony, Spikes Shoes, New Balance, ECCO Sko A/S, Skecher, ANTA, 361°, PEAK, Guirenniao, Xtep, China Dongxiang.
3. What are the main segments of the Spikes Shoes?
The market segments include Application, Types.
4. Can you provide details about the market size?
The market size is estimated to be USD 15990 million as of 2022.
5. What are some drivers contributing to market growth?
N/A
6. What are the notable trends driving market growth?
N/A
7. Are there any restraints impacting market growth?
N/A
8. Can you provide examples of recent developments in the market?
N/A
9. What pricing options are available for accessing the report?
Pricing options include single-user, multi-user, and enterprise licenses priced at USD 3350.00, USD 5025.00, and USD 6700.00 respectively.
10. Is the market size provided in terms of value or volume?
The market size is provided in terms of value, measured in million and volume, measured in K.
11. Are there any specific market keywords associated with the report?
Yes, the market keyword associated with the report is "Spikes Shoes," which aids in identifying and referencing the specific market segment covered.
12. How do I determine which pricing option suits my needs best?
The pricing options vary based on user requirements and access needs. Individual users may opt for single-user licenses, while businesses requiring broader access may choose multi-user or enterprise licenses for cost-effective access to the report.
13. Are there any additional resources or data provided in the Spikes Shoes report?
While the report offers comprehensive insights, it's advisable to review the specific contents or supplementary materials provided to ascertain if additional resources or data are available.
14. How can I stay updated on further developments or reports in the Spikes Shoes?
To stay informed about further developments, trends, and reports in the Spikes Shoes, consider subscribing to industry newsletters, following relevant companies and organizations, or regularly checking reputable industry news sources and publications.
Methodology
Step 1 - Identification of Relevant Samples Size from Population Database


Step 2 - Approaches for Defining Global Market Size (Value, Volume* & Price*)

Note*: In applicable scenarios
Step 3 - Data Sources
Primary Research
- Web Analytics
- Survey Reports
- Research Institute
- Latest Research Reports
- Opinion Leaders
Secondary Research
- Annual Reports
- White Paper
- Latest Press Release
- Industry Association
- Paid Database
- Investor Presentations

Step 4 - Data Triangulation
Involves using different sources of information in order to increase the validity of a study
These sources are likely to be stakeholders in a program - participants, other researchers, program staff, other community members, and so on.
Then we put all data in single framework & apply various statistical tools to find out the dynamic on the market.
During the analysis stage, feedback from the stakeholder groups would be compared to determine areas of agreement as well as areas of divergence