

Key Insights
The global smart grill market is poised for significant expansion, projected to reach an estimated $121 million in 2025 with a robust Compound Annual Growth Rate (CAGR) of 5.3% through 2033. This growth is propelled by an increasing consumer appetite for convenient, technologically integrated outdoor cooking experiences. Key drivers include the desire for enhanced cooking control, remote monitoring capabilities, and the integration of smart home ecosystems. Consumers are increasingly seeking grills that offer precise temperature management, automated cooking cycles, and even recipe guidance, transforming the backyard barbecue into a more sophisticated culinary endeavor. The market is witnessing a surge in demand for both charcoal and gas-powered smart grills, with electric-thermal options also gaining traction as consumers prioritize energy efficiency and ease of use. The "smart" features, such as Wi-Fi connectivity, app-based controls, and built-in sensors, are no longer niche luxury items but are becoming expected features in premium grilling appliances.
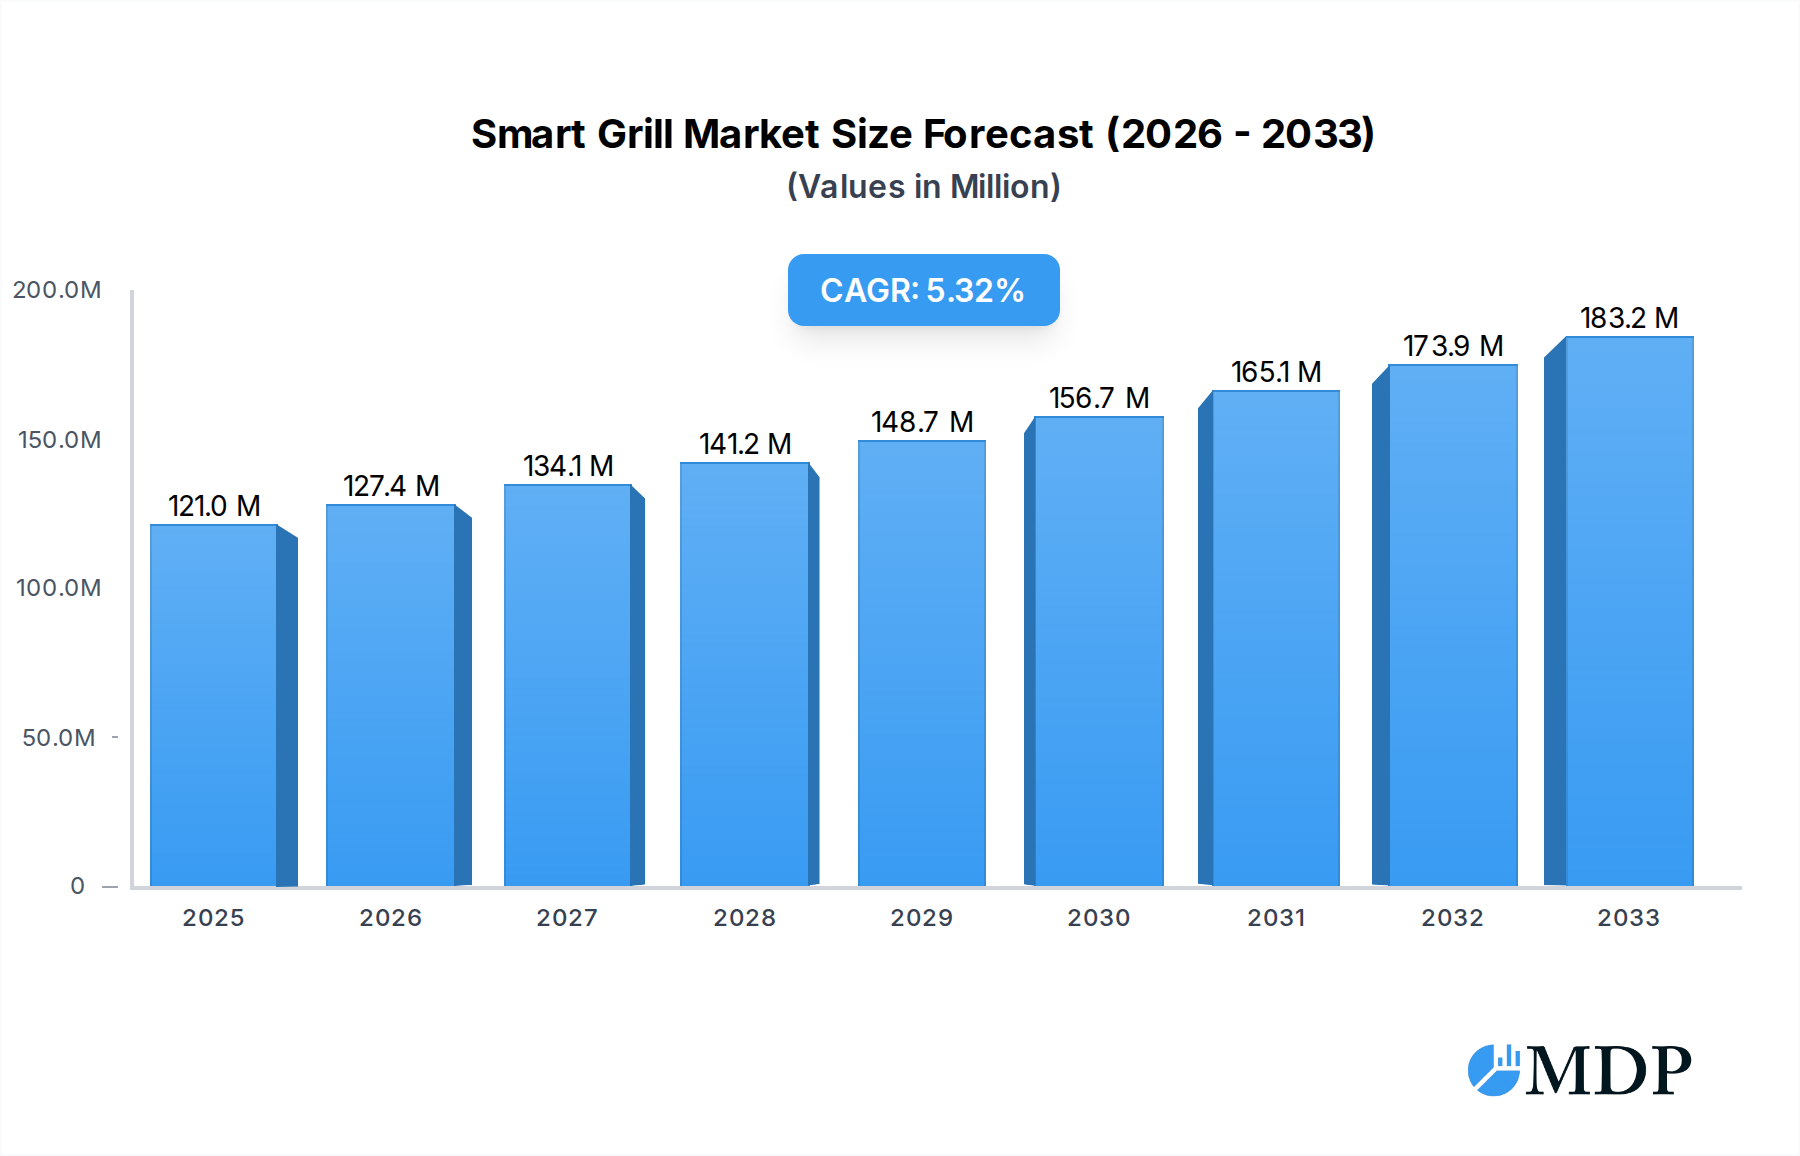
Smart Grill Market Size (In Million)
The smart grill landscape is further shaped by evolving consumer lifestyles, with an emphasis on convenience and healthy eating. The ability to monitor and adjust cooking from a smartphone, even while entertaining guests, significantly enhances the user experience. Furthermore, the integration of advanced features like meat probes that communicate cooking progress and alerts for optimal serving times contribute to the market's upward trajectory. While market growth is generally strong, potential restraints include the initial cost of smart grills, which can be a barrier for some consumers, and the need for continued consumer education regarding the benefits and usability of these advanced appliances. However, as technology becomes more accessible and integrated, and as brands like Weber, Lynx, and Traeger continue to innovate, the smart grill market is well-positioned for sustained and dynamic growth across diverse applications, from home kitchens to commercial establishments.

Smart Grill Company Market Share
This in-depth report provides a comprehensive analysis of the global Smart Grill market, offering critical insights into its dynamics, trends, leading players, and future trajectory. Covering the period from 2019 to 2033, with a base year of 2025, this study is an indispensable resource for grill manufacturers, appliance companies, technology providers, retailers, and industry investors seeking to capitalize on the burgeoning connected kitchen and outdoor living trends. Discover the evolving landscape of connected grills, IoT grilling, and smart outdoor cooking, and gain a strategic advantage in this rapidly expanding sector.
Smart Grill Market Dynamics & Concentration
The Smart Grill market is characterized by moderate to high concentration, with key players like Weber, Traeger, and Lynx dominating significant market share. Innovation is a primary driver, fueled by the demand for enhanced convenience, precise cooking control, and advanced features such as temperature monitoring, recipe integration, and remote operation. Regulatory frameworks, while generally supportive of consumer electronics, are beginning to address data privacy and cybersecurity concerns for connected devices. Product substitutes, including traditional grills and other smart kitchen appliances, pose a competitive threat, but the unique value proposition of smart grills in outdoor cooking continues to drive adoption. End-user trends indicate a growing preference for premium, feature-rich appliances in both residential and commercial settings. Merger and acquisition (M&A) activities are on the rise, with an estimated XX M&A deals recorded in the historical period (2019-2024), signaling consolidation and strategic expansion within the industry. The market share of leading smart grill brands is estimated to be around XX% in 2025.
Smart Grill Industry Trends & Analysis
The Smart Grill industry is poised for robust growth, driven by increasing consumer adoption of smart home technologies and a renewed focus on outdoor entertaining. The market penetration of smart grills is projected to climb significantly, reaching an estimated XX% by 2033. Technological disruptions, including advancements in sensor technology, AI-powered cooking assistants, and seamless app integration, are reshaping the consumer experience. Key market growth drivers include the rising disposable incomes, urbanization leading to smaller outdoor spaces that benefit from efficient, tech-enabled cooking, and the growing popularity of gourmet outdoor cooking. Consumer preferences are increasingly leaning towards grills that offer app control, personalized cooking experiences, and Wi-Fi connectivity. The competitive landscape is dynamic, with established players like Weber, Traeger, and Masterbuilt innovating rapidly, while new entrants introduce disruptive technologies. The Compound Annual Growth Rate (CAGR) for the Smart Grill market is estimated to be XX% during the forecast period (2025-2033). The influence of brands like Camp Chef, Char-Broil, Memphis, Recteq, and Lynx, which are actively investing in their smart product lines, is crucial in shaping market trends and expanding consumer choice.
Leading Markets & Segments in Smart Grill
The Home application segment is the dominant force in the Smart Grill market, driven by increasing consumer demand for connected kitchen appliances and enhanced outdoor living experiences. Countries with high disposable incomes and a strong culture of outdoor grilling, such as the United States, Canada, and select European nations, represent the leading markets.
- Dominant Region/Country: North America, particularly the United States, is the largest market due to its established grilling culture, high adoption rate of smart home devices, and significant presence of leading manufacturers like Weber and Traeger.
- Application: Home: This segment's dominance is fueled by homeowners seeking convenience, precision cooking, and the ability to monitor and control their grills remotely via smartphone apps. The integration of smart grills into the broader smart home ecosystem further enhances their appeal.
- Types: Gas: Gas smart grills represent the largest segment within the types category. Their inherent convenience, ease of temperature control, and rapid heating align perfectly with the features offered by smart technology. The ability to precisely manage gas flow and temperature remotely is a major draw for consumers.
- Application: Commercial: While currently smaller, the Commercial segment is showing significant growth potential. Restaurants, catering services, and hospitality venues are increasingly adopting smart grills for their efficiency, consistency, and data logging capabilities, which can optimize operations and ensure quality.
- Types: Electro-thermal: The Electro-thermal (electric) smart grill segment is gaining traction, especially in urban areas with restrictions on gas or charcoal. Their ease of use and integration with smart home systems make them a viable option for apartment dwellers and those seeking a cleaner grilling alternative.
- Types: Charcoal: The Charcoal segment, while traditional, is also seeing smart innovations. These often focus on precise temperature management and monitoring, appealing to grilling enthusiasts who value the flavor profile of charcoal but desire the precision of smart technology.
Economic policies encouraging smart home technology adoption and infrastructure development for robust Wi-Fi connectivity in outdoor spaces are key drivers underpinning the growth of these leading markets and segments.
Smart Grill Product Developments
Smart grill product developments are rapidly advancing, focusing on enhancing user experience and cooking precision. Innovations include advanced temperature probes with real-time monitoring, integrated meat thermometers, Wi-Fi and Bluetooth connectivity for app-based control, and pre-programmed cooking recipes. Many smart grills now feature automated cooking cycles, temperature alerts, and even voice command integration with smart assistants. Competitive advantages are being built around intuitive user interfaces, robust app ecosystems, and seamless integration with other smart home devices. The trend towards advanced diagnostics and predictive maintenance, informing users about fuel levels or potential issues, is also gaining traction, further solidifying the market fit for these sophisticated outdoor cooking appliances.
Key Drivers of Smart Grill Growth
The growth of the Smart Grill market is propelled by several key factors. Technologically, the increasing ubiquity of IoT (Internet of Things) and smart home ecosystems provides a fertile ground for connected appliances like smart grills. Consumers' growing appetite for convenience and efficiency in their daily lives, coupled with a desire for enhanced outdoor living and entertaining experiences, directly translates into demand for smart grilling solutions. Economically, rising disposable incomes in developed and developing nations allow consumers to invest in premium kitchen and outdoor appliances. Regulatory frameworks that support technological innovation and data connectivity also play a supportive role. Furthermore, a growing awareness of healthier cooking methods and the desire for precise temperature control to achieve optimal culinary results are significant drivers.
Challenges in the Smart Grill Market
Despite its promising growth, the Smart Grill market faces several challenges. High initial costs associated with smart technology can be a barrier for some consumers, limiting market penetration in price-sensitive segments. Regulatory hurdles, particularly concerning data privacy and cybersecurity for connected devices, require ongoing attention and compliance. Supply chain issues, which have impacted various industries globally, can affect the availability and cost of components, impacting production. Intense competitive pressures from both established grill manufacturers and emerging tech companies necessitate continuous innovation and effective marketing strategies. The need for reliable and widespread Wi-Fi connectivity in outdoor spaces can also be a limitation in certain geographical areas.
Emerging Opportunities in Smart Grill
Emerging opportunities in the Smart Grill market are abundant and driven by continuous technological breakthroughs and evolving consumer lifestyles. The expansion of AI-powered cooking assistants that offer personalized recipe suggestions and real-time cooking guidance represents a significant catalyst. Strategic partnerships between grill manufacturers and smart home platform providers can create seamless integration and enhance user adoption. Market expansion into underserved regions and the development of more affordable smart grill models can unlock new customer segments. The growing trend of outdoor kitchens and the increasing demand for sustainable and energy-efficient cooking solutions also present lucrative opportunities for innovation and market differentiation.
Leading Players in the Smart Grill Sector
- Weber
- Lynx
- Masterbuilt
- Camp Chef
- Traeger
- Char-Broil
- Memphis
- Recteq
Key Milestones in Smart Grill Industry
- 2019: Increased integration of basic Wi-Fi connectivity for remote monitoring in premium gas grills.
- 2020: Launch of smart grills with app-controlled temperature regulation and recipe integration.
- 2021: Growing adoption of meat probe technology and automated cooking programs.
- 2022: Introduction of voice control capabilities and enhanced cybersecurity features in smart grills.
- 2023: Expansion of smart grill offerings in the electric and hybrid fuel segments.
- 2024: Increased focus on AI-driven personalized cooking experiences and predictive maintenance alerts.
Strategic Outlook for Smart Grill Market
The strategic outlook for the Smart Grill market is exceptionally positive, driven by ongoing technological advancements and a growing consumer demand for connected living experiences. Growth accelerators will include the continued evolution of AI and machine learning to provide more sophisticated cooking assistance and personalized culinary guidance. Strategic partnerships and ecosystem integrations will be crucial for expanding market reach and enhancing user convenience. The development of sustainable and energy-efficient smart grill technologies will cater to environmentally conscious consumers. Furthermore, the increasing integration of smart grills into broader smart home platforms will solidify their position as essential components of the modern connected household.
Smart Grill Segmentation
-
1. Application
- 1.1. Home
- 1.2. Commercial
-
2. Types
- 2.1. Charcoal
- 2.2. Gas
- 2.3. Electro-thermal
Smart Grill Segmentation By Geography
-
1. North America
- 1.1. United States
- 1.2. Canada
- 1.3. Mexico
-
2. South America
- 2.1. Brazil
- 2.2. Argentina
- 2.3. Rest of South America
-
3. Europe
- 3.1. United Kingdom
- 3.2. Germany
- 3.3. France
- 3.4. Italy
- 3.5. Spain
- 3.6. Russia
- 3.7. Benelux
- 3.8. Nordics
- 3.9. Rest of Europe
-
4. Middle East & Africa
- 4.1. Turkey
- 4.2. Israel
- 4.3. GCC
- 4.4. North Africa
- 4.5. South Africa
- 4.6. Rest of Middle East & Africa
-
5. Asia Pacific
- 5.1. China
- 5.2. India
- 5.3. Japan
- 5.4. South Korea
- 5.5. ASEAN
- 5.6. Oceania
- 5.7. Rest of Asia Pacific

Smart Grill Regional Market Share
Geographic Coverage of Smart Grill
Smart Grill REPORT HIGHLIGHTS
| Aspects | Details |
|---|---|
| Study Period | 2020-2034 |
| Base Year | 2025 |
| Estimated Year | 2026 |
| Forecast Period | 2026-2034 |
| Historical Period | 2020-2025 |
| Growth Rate | CAGR of 5.3% from 2020-2034 |
| Segmentation |
|
Table of Contents
- 1. Introduction
- 1.1. Research Scope
- 1.2. Market Segmentation
- 1.3. Research Methodology
- 1.4. Definitions and Assumptions
- 2. Executive Summary
- 2.1. Introduction
- 3. Market Dynamics
- 3.1. Introduction
- 3.2. Market Drivers
- 3.3. Market Restrains
- 3.4. Market Trends
- 4. Market Factor Analysis
- 4.1. Porters Five Forces
- 4.2. Supply/Value Chain
- 4.3. PESTEL analysis
- 4.4. Market Entropy
- 4.5. Patent/Trademark Analysis
- 5. Global Smart Grill Analysis, Insights and Forecast, 2020-2032
- 5.1. Market Analysis, Insights and Forecast - by Application
- 5.1.1. Home
- 5.1.2. Commercial
- 5.2. Market Analysis, Insights and Forecast - by Types
- 5.2.1. Charcoal
- 5.2.2. Gas
- 5.2.3. Electro-thermal
- 5.3. Market Analysis, Insights and Forecast - by Region
- 5.3.1. North America
- 5.3.2. South America
- 5.3.3. Europe
- 5.3.4. Middle East & Africa
- 5.3.5. Asia Pacific
- 5.1. Market Analysis, Insights and Forecast - by Application
- 6. North America Smart Grill Analysis, Insights and Forecast, 2020-2032
- 6.1. Market Analysis, Insights and Forecast - by Application
- 6.1.1. Home
- 6.1.2. Commercial
- 6.2. Market Analysis, Insights and Forecast - by Types
- 6.2.1. Charcoal
- 6.2.2. Gas
- 6.2.3. Electro-thermal
- 6.1. Market Analysis, Insights and Forecast - by Application
- 7. South America Smart Grill Analysis, Insights and Forecast, 2020-2032
- 7.1. Market Analysis, Insights and Forecast - by Application
- 7.1.1. Home
- 7.1.2. Commercial
- 7.2. Market Analysis, Insights and Forecast - by Types
- 7.2.1. Charcoal
- 7.2.2. Gas
- 7.2.3. Electro-thermal
- 7.1. Market Analysis, Insights and Forecast - by Application
- 8. Europe Smart Grill Analysis, Insights and Forecast, 2020-2032
- 8.1. Market Analysis, Insights and Forecast - by Application
- 8.1.1. Home
- 8.1.2. Commercial
- 8.2. Market Analysis, Insights and Forecast - by Types
- 8.2.1. Charcoal
- 8.2.2. Gas
- 8.2.3. Electro-thermal
- 8.1. Market Analysis, Insights and Forecast - by Application
- 9. Middle East & Africa Smart Grill Analysis, Insights and Forecast, 2020-2032
- 9.1. Market Analysis, Insights and Forecast - by Application
- 9.1.1. Home
- 9.1.2. Commercial
- 9.2. Market Analysis, Insights and Forecast - by Types
- 9.2.1. Charcoal
- 9.2.2. Gas
- 9.2.3. Electro-thermal
- 9.1. Market Analysis, Insights and Forecast - by Application
- 10. Asia Pacific Smart Grill Analysis, Insights and Forecast, 2020-2032
- 10.1. Market Analysis, Insights and Forecast - by Application
- 10.1.1. Home
- 10.1.2. Commercial
- 10.2. Market Analysis, Insights and Forecast - by Types
- 10.2.1. Charcoal
- 10.2.2. Gas
- 10.2.3. Electro-thermal
- 10.1. Market Analysis, Insights and Forecast - by Application
- 11. Competitive Analysis
- 11.1. Global Market Share Analysis 2025
- 11.2. Company Profiles
- 11.2.1 Weber
- 11.2.1.1. Overview
- 11.2.1.2. Products
- 11.2.1.3. SWOT Analysis
- 11.2.1.4. Recent Developments
- 11.2.1.5. Financials (Based on Availability)
- 11.2.2 Lynx
- 11.2.2.1. Overview
- 11.2.2.2. Products
- 11.2.2.3. SWOT Analysis
- 11.2.2.4. Recent Developments
- 11.2.2.5. Financials (Based on Availability)
- 11.2.3 Masterbuilt
- 11.2.3.1. Overview
- 11.2.3.2. Products
- 11.2.3.3. SWOT Analysis
- 11.2.3.4. Recent Developments
- 11.2.3.5. Financials (Based on Availability)
- 11.2.4 Camp Chef
- 11.2.4.1. Overview
- 11.2.4.2. Products
- 11.2.4.3. SWOT Analysis
- 11.2.4.4. Recent Developments
- 11.2.4.5. Financials (Based on Availability)
- 11.2.5 Traeger
- 11.2.5.1. Overview
- 11.2.5.2. Products
- 11.2.5.3. SWOT Analysis
- 11.2.5.4. Recent Developments
- 11.2.5.5. Financials (Based on Availability)
- 11.2.6 Char-Broil
- 11.2.6.1. Overview
- 11.2.6.2. Products
- 11.2.6.3. SWOT Analysis
- 11.2.6.4. Recent Developments
- 11.2.6.5. Financials (Based on Availability)
- 11.2.7 Memphis
- 11.2.7.1. Overview
- 11.2.7.2. Products
- 11.2.7.3. SWOT Analysis
- 11.2.7.4. Recent Developments
- 11.2.7.5. Financials (Based on Availability)
- 11.2.8 Recteq
- 11.2.8.1. Overview
- 11.2.8.2. Products
- 11.2.8.3. SWOT Analysis
- 11.2.8.4. Recent Developments
- 11.2.8.5. Financials (Based on Availability)
- 11.2.1 Weber
List of Figures
- Figure 1: Global Smart Grill Revenue Breakdown (million, %) by Region 2025 & 2033
- Figure 2: North America Smart Grill Revenue (million), by Application 2025 & 2033
- Figure 3: North America Smart Grill Revenue Share (%), by Application 2025 & 2033
- Figure 4: North America Smart Grill Revenue (million), by Types 2025 & 2033
- Figure 5: North America Smart Grill Revenue Share (%), by Types 2025 & 2033
- Figure 6: North America Smart Grill Revenue (million), by Country 2025 & 2033
- Figure 7: North America Smart Grill Revenue Share (%), by Country 2025 & 2033
- Figure 8: South America Smart Grill Revenue (million), by Application 2025 & 2033
- Figure 9: South America Smart Grill Revenue Share (%), by Application 2025 & 2033
- Figure 10: South America Smart Grill Revenue (million), by Types 2025 & 2033
- Figure 11: South America Smart Grill Revenue Share (%), by Types 2025 & 2033
- Figure 12: South America Smart Grill Revenue (million), by Country 2025 & 2033
- Figure 13: South America Smart Grill Revenue Share (%), by Country 2025 & 2033
- Figure 14: Europe Smart Grill Revenue (million), by Application 2025 & 2033
- Figure 15: Europe Smart Grill Revenue Share (%), by Application 2025 & 2033
- Figure 16: Europe Smart Grill Revenue (million), by Types 2025 & 2033
- Figure 17: Europe Smart Grill Revenue Share (%), by Types 2025 & 2033
- Figure 18: Europe Smart Grill Revenue (million), by Country 2025 & 2033
- Figure 19: Europe Smart Grill Revenue Share (%), by Country 2025 & 2033
- Figure 20: Middle East & Africa Smart Grill Revenue (million), by Application 2025 & 2033
- Figure 21: Middle East & Africa Smart Grill Revenue Share (%), by Application 2025 & 2033
- Figure 22: Middle East & Africa Smart Grill Revenue (million), by Types 2025 & 2033
- Figure 23: Middle East & Africa Smart Grill Revenue Share (%), by Types 2025 & 2033
- Figure 24: Middle East & Africa Smart Grill Revenue (million), by Country 2025 & 2033
- Figure 25: Middle East & Africa Smart Grill Revenue Share (%), by Country 2025 & 2033
- Figure 26: Asia Pacific Smart Grill Revenue (million), by Application 2025 & 2033
- Figure 27: Asia Pacific Smart Grill Revenue Share (%), by Application 2025 & 2033
- Figure 28: Asia Pacific Smart Grill Revenue (million), by Types 2025 & 2033
- Figure 29: Asia Pacific Smart Grill Revenue Share (%), by Types 2025 & 2033
- Figure 30: Asia Pacific Smart Grill Revenue (million), by Country 2025 & 2033
- Figure 31: Asia Pacific Smart Grill Revenue Share (%), by Country 2025 & 2033
List of Tables
- Table 1: Global Smart Grill Revenue million Forecast, by Application 2020 & 2033
- Table 2: Global Smart Grill Revenue million Forecast, by Types 2020 & 2033
- Table 3: Global Smart Grill Revenue million Forecast, by Region 2020 & 2033
- Table 4: Global Smart Grill Revenue million Forecast, by Application 2020 & 2033
- Table 5: Global Smart Grill Revenue million Forecast, by Types 2020 & 2033
- Table 6: Global Smart Grill Revenue million Forecast, by Country 2020 & 2033
- Table 7: United States Smart Grill Revenue (million) Forecast, by Application 2020 & 2033
- Table 8: Canada Smart Grill Revenue (million) Forecast, by Application 2020 & 2033
- Table 9: Mexico Smart Grill Revenue (million) Forecast, by Application 2020 & 2033
- Table 10: Global Smart Grill Revenue million Forecast, by Application 2020 & 2033
- Table 11: Global Smart Grill Revenue million Forecast, by Types 2020 & 2033
- Table 12: Global Smart Grill Revenue million Forecast, by Country 2020 & 2033
- Table 13: Brazil Smart Grill Revenue (million) Forecast, by Application 2020 & 2033
- Table 14: Argentina Smart Grill Revenue (million) Forecast, by Application 2020 & 2033
- Table 15: Rest of South America Smart Grill Revenue (million) Forecast, by Application 2020 & 2033
- Table 16: Global Smart Grill Revenue million Forecast, by Application 2020 & 2033
- Table 17: Global Smart Grill Revenue million Forecast, by Types 2020 & 2033
- Table 18: Global Smart Grill Revenue million Forecast, by Country 2020 & 2033
- Table 19: United Kingdom Smart Grill Revenue (million) Forecast, by Application 2020 & 2033
- Table 20: Germany Smart Grill Revenue (million) Forecast, by Application 2020 & 2033
- Table 21: France Smart Grill Revenue (million) Forecast, by Application 2020 & 2033
- Table 22: Italy Smart Grill Revenue (million) Forecast, by Application 2020 & 2033
- Table 23: Spain Smart Grill Revenue (million) Forecast, by Application 2020 & 2033
- Table 24: Russia Smart Grill Revenue (million) Forecast, by Application 2020 & 2033
- Table 25: Benelux Smart Grill Revenue (million) Forecast, by Application 2020 & 2033
- Table 26: Nordics Smart Grill Revenue (million) Forecast, by Application 2020 & 2033
- Table 27: Rest of Europe Smart Grill Revenue (million) Forecast, by Application 2020 & 2033
- Table 28: Global Smart Grill Revenue million Forecast, by Application 2020 & 2033
- Table 29: Global Smart Grill Revenue million Forecast, by Types 2020 & 2033
- Table 30: Global Smart Grill Revenue million Forecast, by Country 2020 & 2033
- Table 31: Turkey Smart Grill Revenue (million) Forecast, by Application 2020 & 2033
- Table 32: Israel Smart Grill Revenue (million) Forecast, by Application 2020 & 2033
- Table 33: GCC Smart Grill Revenue (million) Forecast, by Application 2020 & 2033
- Table 34: North Africa Smart Grill Revenue (million) Forecast, by Application 2020 & 2033
- Table 35: South Africa Smart Grill Revenue (million) Forecast, by Application 2020 & 2033
- Table 36: Rest of Middle East & Africa Smart Grill Revenue (million) Forecast, by Application 2020 & 2033
- Table 37: Global Smart Grill Revenue million Forecast, by Application 2020 & 2033
- Table 38: Global Smart Grill Revenue million Forecast, by Types 2020 & 2033
- Table 39: Global Smart Grill Revenue million Forecast, by Country 2020 & 2033
- Table 40: China Smart Grill Revenue (million) Forecast, by Application 2020 & 2033
- Table 41: India Smart Grill Revenue (million) Forecast, by Application 2020 & 2033
- Table 42: Japan Smart Grill Revenue (million) Forecast, by Application 2020 & 2033
- Table 43: South Korea Smart Grill Revenue (million) Forecast, by Application 2020 & 2033
- Table 44: ASEAN Smart Grill Revenue (million) Forecast, by Application 2020 & 2033
- Table 45: Oceania Smart Grill Revenue (million) Forecast, by Application 2020 & 2033
- Table 46: Rest of Asia Pacific Smart Grill Revenue (million) Forecast, by Application 2020 & 2033
Frequently Asked Questions
1. What is the projected Compound Annual Growth Rate (CAGR) of the Smart Grill?
The projected CAGR is approximately 5.3%.
2. Which companies are prominent players in the Smart Grill?
Key companies in the market include Weber, Lynx, Masterbuilt, Camp Chef, Traeger, Char-Broil, Memphis, Recteq.
3. What are the main segments of the Smart Grill?
The market segments include Application, Types.
4. Can you provide details about the market size?
The market size is estimated to be USD 121 million as of 2022.
5. What are some drivers contributing to market growth?
N/A
6. What are the notable trends driving market growth?
N/A
7. Are there any restraints impacting market growth?
N/A
8. Can you provide examples of recent developments in the market?
N/A
9. What pricing options are available for accessing the report?
Pricing options include single-user, multi-user, and enterprise licenses priced at USD 2900.00, USD 4350.00, and USD 5800.00 respectively.
10. Is the market size provided in terms of value or volume?
The market size is provided in terms of value, measured in million.
11. Are there any specific market keywords associated with the report?
Yes, the market keyword associated with the report is "Smart Grill," which aids in identifying and referencing the specific market segment covered.
12. How do I determine which pricing option suits my needs best?
The pricing options vary based on user requirements and access needs. Individual users may opt for single-user licenses, while businesses requiring broader access may choose multi-user or enterprise licenses for cost-effective access to the report.
13. Are there any additional resources or data provided in the Smart Grill report?
While the report offers comprehensive insights, it's advisable to review the specific contents or supplementary materials provided to ascertain if additional resources or data are available.
14. How can I stay updated on further developments or reports in the Smart Grill?
To stay informed about further developments, trends, and reports in the Smart Grill, consider subscribing to industry newsletters, following relevant companies and organizations, or regularly checking reputable industry news sources and publications.
Methodology
Step 1 - Identification of Relevant Samples Size from Population Database


Step 2 - Approaches for Defining Global Market Size (Value, Volume* & Price*)

Note*: In applicable scenarios
Step 3 - Data Sources
Primary Research
- Web Analytics
- Survey Reports
- Research Institute
- Latest Research Reports
- Opinion Leaders
Secondary Research
- Annual Reports
- White Paper
- Latest Press Release
- Industry Association
- Paid Database
- Investor Presentations

Step 4 - Data Triangulation
Involves using different sources of information in order to increase the validity of a study
These sources are likely to be stakeholders in a program - participants, other researchers, program staff, other community members, and so on.
Then we put all data in single framework & apply various statistical tools to find out the dynamic on the market.
During the analysis stage, feedback from the stakeholder groups would be compared to determine areas of agreement as well as areas of divergence