

Key Insights
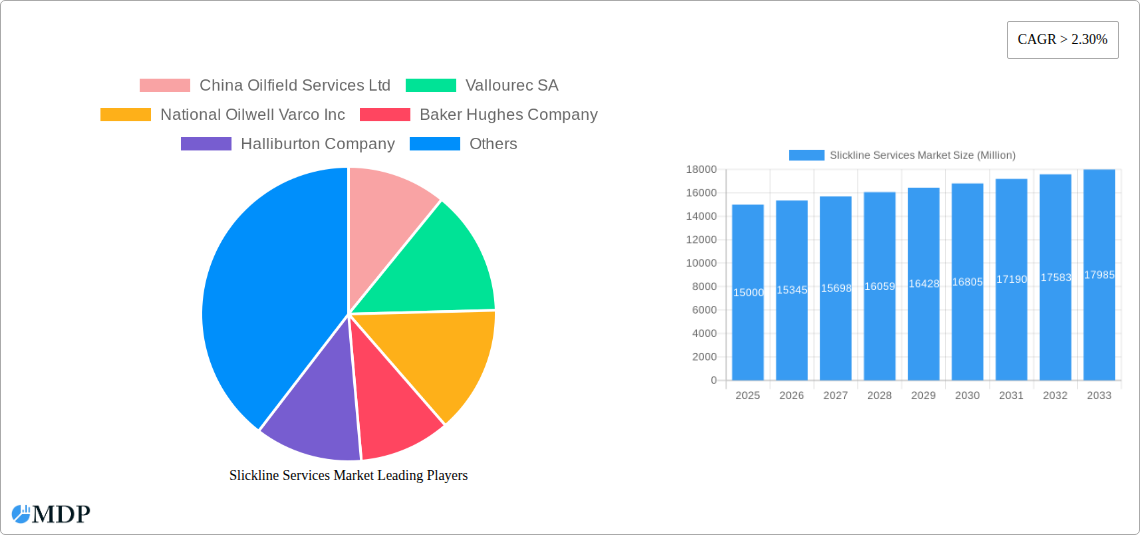
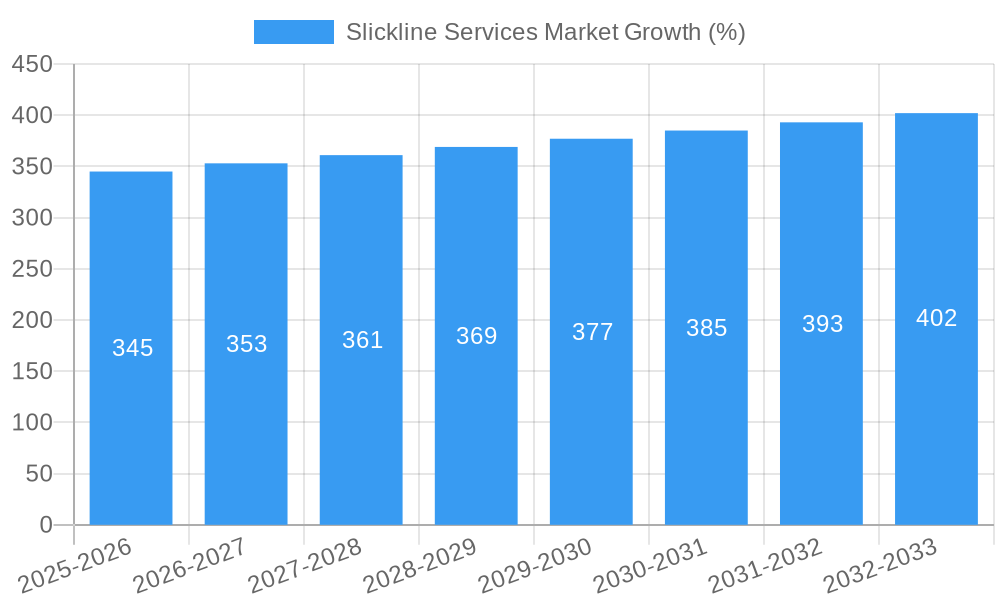
The global slickline services market is experiencing robust growth, driven by the increasing demand for oil and gas exploration and production activities worldwide. A compound annual growth rate (CAGR) exceeding 2.30% indicates a steadily expanding market, projected to reach significant value over the forecast period (2025-2033). This growth is fueled by several key factors. Firstly, the ongoing exploration and development of unconventional resources, such as shale gas and tight oil, necessitates the use of slickline services for well completion, intervention, and logging operations. Secondly, technological advancements in slickline tools and techniques are enhancing efficiency and reducing operational costs, further stimulating market expansion. The onshore segment currently holds a larger market share compared to offshore, owing to the higher concentration of oil and gas wells in onshore locations. However, growing offshore exploration activities are expected to drive significant growth in the offshore segment in the coming years. Major players like Schlumberger, Halliburton, and Baker Hughes are at the forefront of innovation and market share, with their technological advancements and global presence playing a crucial role. Competition is intense, pushing companies to offer advanced services and cost-effective solutions to maintain a competitive edge.
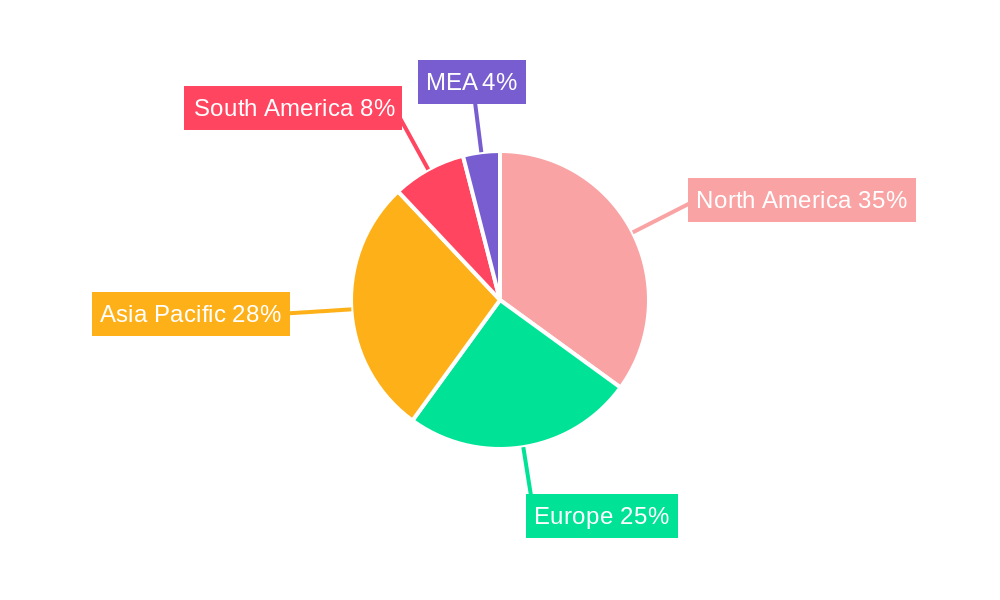
Geographic distribution shows North America and the Asia-Pacific region as key contributors to the overall market size, driven by significant oil and gas production activities in these regions. Europe also contributes significantly, with established oil and gas infrastructure and ongoing investments in exploration and production. However, growth in emerging markets, particularly in the Middle East and Africa, offers promising opportunities for expansion. The market segmentation, encompassing well completion, well intervention, and logging, highlights the diverse applications of slickline services across the oil and gas value chain. Future growth will likely depend on global energy demand, technological innovations, regulatory environments, and oil price fluctuations, alongside continued investment in oil and gas infrastructure development.
Slickline Services Market: A Comprehensive Report (2019-2033)
This comprehensive report provides an in-depth analysis of the global Slickline Services Market, covering the period from 2019 to 2033. With a focus on market dynamics, industry trends, leading players, and future opportunities, this report is an essential resource for industry stakeholders, investors, and strategic decision-makers. The report utilizes data from the historical period (2019-2024), the base year (2025), and provides estimations for the forecast period (2025-2033). The total market value is expected to reach xx Million by 2033.
Slickline Services Market Dynamics & Concentration
The Slickline Services market exhibits a moderately concentrated structure, with a few major players commanding significant market share. Market concentration is influenced by factors such as technological advancements, economies of scale, and regulatory frameworks. Innovation in slickline technology, including the development of advanced tools and techniques for improved efficiency and safety, is a key driver. Regulatory compliance, particularly concerning environmental protection and worker safety, significantly impacts market dynamics. The presence of substitute technologies, though limited, necessitates ongoing innovation to maintain market competitiveness. End-user trends, particularly in the energy sector, directly influence market demand. M&A activities have played a role in shaping the market landscape, with xx M&A deals recorded between 2019 and 2024, resulting in an average annual increase of xx%. Key players' market share fluctuations are analyzed, with the largest players holding approximately xx% of the market collectively.
- Market Share: Schlumberger Limited, Halliburton Company, and Baker Hughes Company hold the largest shares, collectively representing approximately xx% of the market.
- M&A Activity: Consolidation through mergers and acquisitions is expected to continue, driving further market concentration.
- Innovation Drivers: Demand for enhanced operational efficiency, improved safety measures, and reduced environmental impact fuels continuous technological advancements.
- Regulatory Frameworks: Stringent regulations regarding safety and environmental protection shape industry practices and influence investment decisions.
Slickline Services Market Industry Trends & Analysis
The Slickline Services market is experiencing robust growth, driven by increasing oil and gas exploration and production activities globally. Technological advancements, such as the adoption of automation and data analytics, are enhancing operational efficiency and reducing costs. Consumer preferences are shifting toward more sustainable and environmentally friendly technologies, prompting companies to invest in research and development to meet these demands. The market exhibits a high degree of competitiveness, with established players and new entrants vying for market share. The Compound Annual Growth Rate (CAGR) during the forecast period (2025-2033) is projected to be xx%, indicating a significant expansion of the market. Market penetration is expected to increase further due to the rising demand for efficient and cost-effective slickline services in both onshore and offshore operations. Furthermore, growing investments in unconventional oil and gas resources are further bolstering market growth.
Leading Markets & Segments in Slickline Services Market
The offshore segment currently dominates the Slickline Services market, accounting for approximately xx% of the total market value in 2025. This dominance is largely attributed to the higher complexity and specialized requirements of offshore operations. However, the onshore segment is witnessing significant growth, driven by increased exploration activities in various regions. The Well Intervention segment represents a substantial portion of the market, driven by its essential role in maintaining and optimizing well productivity.
- Offshore Segment Drivers: High demand from deepwater and ultra-deepwater projects, stringent safety and regulatory requirements driving adoption of advanced technologies, and higher service charges compared to onshore operations.
- Onshore Segment Drivers: Rising exploration and production in onshore fields globally, relatively lower operational costs compared to offshore operations, and government incentives promoting domestic oil and gas exploration in certain regions.
- Well Intervention Segment Drivers: Increasing focus on well integrity management, growing demand for extended well life, and the cost-effectiveness of slickline intervention techniques compared to workover rigs.
- Well Completion Segment Drivers: Essential role in the completion process of oil and gas wells, increasing adoption of advanced completion techniques, and the need for efficient and reliable slickline services during well completion operations.
- Logging Segment Drivers: Growing demand for accurate and detailed well log data, advancements in logging technology leading to improved efficiency and reduced downtime, and integration of slickline logging with other well intervention services.
Slickline Services Market Product Developments
Recent product innovations in the slickline services market focus on enhancing operational efficiency, improving safety, and reducing environmental impact. This includes the development of advanced tools and techniques for well intervention, completion, and logging operations. These advancements translate into increased productivity, reduced downtime, and improved data acquisition. Competition is driving continuous innovation, leading to the emergence of more sophisticated and cost-effective slickline services.
Key Drivers of Slickline Services Market Growth
The growth of the Slickline Services market is propelled by several key factors. Technological advancements, including automation and enhanced data analytics, improve operational efficiency and reduce costs. Rising exploration and production activities, particularly in unconventional resources, stimulate increased demand for slickline services. Favorable government policies and incentives for oil and gas exploration in several regions further bolster market growth. Furthermore, the increasing need for well integrity management and enhanced oil recovery techniques contributes significantly to market expansion.
Challenges in the Slickline Services Market
The Slickline Services market faces challenges including fluctuating oil and gas prices, which directly impact investment and demand. Stringent safety and environmental regulations necessitate significant investments in compliance measures. Competition from alternative technologies, particularly those focusing on automation and remote operation, presents a significant challenge. Supply chain disruptions and the availability of skilled labor further constrain market growth. The combined impact of these challenges is estimated to negatively affect the market growth rate by approximately xx% annually.
Emerging Opportunities in Slickline Services Market
Significant opportunities exist for growth within the Slickline Services market. Technological breakthroughs in areas such as automation, robotics, and data analytics are creating new avenues for efficiency improvements and cost reductions. Strategic partnerships and collaborations between service providers and oil and gas companies are fostering innovation and expanding market reach. Expansion into new geographic regions with significant untapped potential further presents promising opportunities for growth.
Leading Players in the Slickline Services Market Sector
- China Oilfield Services Ltd
- Vallourec SA
- National Oilwell Varco Inc
- Baker Hughes Company
- Halliburton Company
- Weatherford International Ltd
- Schlumberger Limited
- Scientific Drilling International Inc
Key Milestones in Slickline Services Market Industry
- October 2021: National Energy Services announces multi-year contracts totaling over USD 150 Million for slickline services in GCC countries. This significantly boosts market confidence and demonstrates strong demand.
- September 2021: Reservoir Link Energy Bhd secures a contract from Sarawak Shell for slickline equipment and services in Malaysia, indicating growth in the Asia-Pacific region.
Strategic Outlook for Slickline Services Market
The Slickline Services market is poised for sustained growth, driven by ongoing technological advancements, increased exploration and production activities, and strategic partnerships. The market is expected to witness a shift toward more automated, data-driven, and environmentally friendly services. Companies that proactively adapt to these trends and invest in innovation will be well-positioned to capitalize on the significant opportunities presented by this dynamic market. The long-term market potential is substantial, offering lucrative prospects for both established players and new entrants.
Slickline Services Market Segmentation
-
1. Operation
- 1.1. Well Completion
- 1.2. Well Intervention
- 1.3. Logging
-
2. Location of Deployment
- 2.1. Onshore
- 2.2. Offshore
Slickline Services Market Segmentation By Geography
- 1. North America
- 2. Europe
- 3. Asia Pacific
- 4. South America
- 5. Middle East and Africa
Slickline Services Market REPORT HIGHLIGHTS
| Aspects | Details |
|---|---|
| Study Period | 2019-2033 |
| Base Year | 2024 |
| Estimated Year | 2025 |
| Forecast Period | 2025-2033 |
| Historical Period | 2019-2024 |
| Growth Rate | CAGR of > 2.30% from 2019-2033 |
| Segmentation |
|
Table of Contents
- 1. Introduction
- 1.1. Research Scope
- 1.2. Market Segmentation
- 1.3. Research Methodology
- 1.4. Definitions and Assumptions
- 2. Executive Summary
- 2.1. Introduction
- 3. Market Dynamics
- 3.1. Introduction
- 3.2. Market Drivers
- 3.2.1. 4.; Increased Drilling and Completion Activities
- 3.3. Market Restrains
- 3.3.1. 4.; Volatility of Oil Prices
- 3.4. Market Trends
- 3.4.1. Onshore Segment to Dominate the Market
- 4. Market Factor Analysis
- 4.1. Porters Five Forces
- 4.2. Supply/Value Chain
- 4.3. PESTEL analysis
- 4.4. Market Entropy
- 4.5. Patent/Trademark Analysis
- 5. Global Slickline Services Market Analysis, Insights and Forecast, 2019-2031
- 5.1. Market Analysis, Insights and Forecast - by Operation
- 5.1.1. Well Completion
- 5.1.2. Well Intervention
- 5.1.3. Logging
- 5.2. Market Analysis, Insights and Forecast - by Location of Deployment
- 5.2.1. Onshore
- 5.2.2. Offshore
- 5.3. Market Analysis, Insights and Forecast - by Region
- 5.3.1. North America
- 5.3.2. Europe
- 5.3.3. Asia Pacific
- 5.3.4. South America
- 5.3.5. Middle East and Africa
- 5.1. Market Analysis, Insights and Forecast - by Operation
- 6. North America Slickline Services Market Analysis, Insights and Forecast, 2019-2031
- 6.1. Market Analysis, Insights and Forecast - by Operation
- 6.1.1. Well Completion
- 6.1.2. Well Intervention
- 6.1.3. Logging
- 6.2. Market Analysis, Insights and Forecast - by Location of Deployment
- 6.2.1. Onshore
- 6.2.2. Offshore
- 6.1. Market Analysis, Insights and Forecast - by Operation
- 7. Europe Slickline Services Market Analysis, Insights and Forecast, 2019-2031
- 7.1. Market Analysis, Insights and Forecast - by Operation
- 7.1.1. Well Completion
- 7.1.2. Well Intervention
- 7.1.3. Logging
- 7.2. Market Analysis, Insights and Forecast - by Location of Deployment
- 7.2.1. Onshore
- 7.2.2. Offshore
- 7.1. Market Analysis, Insights and Forecast - by Operation
- 8. Asia Pacific Slickline Services Market Analysis, Insights and Forecast, 2019-2031
- 8.1. Market Analysis, Insights and Forecast - by Operation
- 8.1.1. Well Completion
- 8.1.2. Well Intervention
- 8.1.3. Logging
- 8.2. Market Analysis, Insights and Forecast - by Location of Deployment
- 8.2.1. Onshore
- 8.2.2. Offshore
- 8.1. Market Analysis, Insights and Forecast - by Operation
- 9. South America Slickline Services Market Analysis, Insights and Forecast, 2019-2031
- 9.1. Market Analysis, Insights and Forecast - by Operation
- 9.1.1. Well Completion
- 9.1.2. Well Intervention
- 9.1.3. Logging
- 9.2. Market Analysis, Insights and Forecast - by Location of Deployment
- 9.2.1. Onshore
- 9.2.2. Offshore
- 9.1. Market Analysis, Insights and Forecast - by Operation
- 10. Middle East and Africa Slickline Services Market Analysis, Insights and Forecast, 2019-2031
- 10.1. Market Analysis, Insights and Forecast - by Operation
- 10.1.1. Well Completion
- 10.1.2. Well Intervention
- 10.1.3. Logging
- 10.2. Market Analysis, Insights and Forecast - by Location of Deployment
- 10.2.1. Onshore
- 10.2.2. Offshore
- 10.1. Market Analysis, Insights and Forecast - by Operation
- 11. North America Slickline Services Market Analysis, Insights and Forecast, 2019-2031
- 11.1. Market Analysis, Insights and Forecast - By Country/Sub-region
- 11.1.1 United States
- 11.1.2 Canada
- 11.1.3 Mexico
- 12. Europe Slickline Services Market Analysis, Insights and Forecast, 2019-2031
- 12.1. Market Analysis, Insights and Forecast - By Country/Sub-region
- 12.1.1 Germany
- 12.1.2 United Kingdom
- 12.1.3 France
- 12.1.4 Spain
- 12.1.5 Italy
- 12.1.6 Spain
- 12.1.7 Belgium
- 12.1.8 Netherland
- 12.1.9 Nordics
- 12.1.10 Rest of Europe
- 13. Asia Pacific Slickline Services Market Analysis, Insights and Forecast, 2019-2031
- 13.1. Market Analysis, Insights and Forecast - By Country/Sub-region
- 13.1.1 China
- 13.1.2 Japan
- 13.1.3 India
- 13.1.4 South Korea
- 13.1.5 Southeast Asia
- 13.1.6 Australia
- 13.1.7 Indonesia
- 13.1.8 Phillipes
- 13.1.9 Singapore
- 13.1.10 Thailandc
- 13.1.11 Rest of Asia Pacific
- 14. South America Slickline Services Market Analysis, Insights and Forecast, 2019-2031
- 14.1. Market Analysis, Insights and Forecast - By Country/Sub-region
- 14.1.1 Brazil
- 14.1.2 Argentina
- 14.1.3 Peru
- 14.1.4 Chile
- 14.1.5 Colombia
- 14.1.6 Ecuador
- 14.1.7 Venezuela
- 14.1.8 Rest of South America
- 15. MEA Slickline Services Market Analysis, Insights and Forecast, 2019-2031
- 15.1. Market Analysis, Insights and Forecast - By Country/Sub-region
- 15.1.1 United Arab Emirates
- 15.1.2 Saudi Arabia
- 15.1.3 South Africa
- 15.1.4 Rest of Middle East and Africa
- 16. Competitive Analysis
- 16.1. Global Market Share Analysis 2024
- 16.2. Company Profiles
- 16.2.1 China Oilfield Services Ltd
- 16.2.1.1. Overview
- 16.2.1.2. Products
- 16.2.1.3. SWOT Analysis
- 16.2.1.4. Recent Developments
- 16.2.1.5. Financials (Based on Availability)
- 16.2.2 Vallourec SA
- 16.2.2.1. Overview
- 16.2.2.2. Products
- 16.2.2.3. SWOT Analysis
- 16.2.2.4. Recent Developments
- 16.2.2.5. Financials (Based on Availability)
- 16.2.3 National Oilwell Varco Inc
- 16.2.3.1. Overview
- 16.2.3.2. Products
- 16.2.3.3. SWOT Analysis
- 16.2.3.4. Recent Developments
- 16.2.3.5. Financials (Based on Availability)
- 16.2.4 Baker Hughes Company
- 16.2.4.1. Overview
- 16.2.4.2. Products
- 16.2.4.3. SWOT Analysis
- 16.2.4.4. Recent Developments
- 16.2.4.5. Financials (Based on Availability)
- 16.2.5 Halliburton Company
- 16.2.5.1. Overview
- 16.2.5.2. Products
- 16.2.5.3. SWOT Analysis
- 16.2.5.4. Recent Developments
- 16.2.5.5. Financials (Based on Availability)
- 16.2.6 Weatherford International Ltd
- 16.2.6.1. Overview
- 16.2.6.2. Products
- 16.2.6.3. SWOT Analysis
- 16.2.6.4. Recent Developments
- 16.2.6.5. Financials (Based on Availability)
- 16.2.7 Schlumberger Limited
- 16.2.7.1. Overview
- 16.2.7.2. Products
- 16.2.7.3. SWOT Analysis
- 16.2.7.4. Recent Developments
- 16.2.7.5. Financials (Based on Availability)
- 16.2.8 Scientific Drilling International Inc
- 16.2.8.1. Overview
- 16.2.8.2. Products
- 16.2.8.3. SWOT Analysis
- 16.2.8.4. Recent Developments
- 16.2.8.5. Financials (Based on Availability)
- 16.2.1 China Oilfield Services Ltd
List of Figures
- Figure 1: Global Slickline Services Market Revenue Breakdown (Million, %) by Region 2024 & 2032
- Figure 2: North America Slickline Services Market Revenue (Million), by Country 2024 & 2032
- Figure 3: North America Slickline Services Market Revenue Share (%), by Country 2024 & 2032
- Figure 4: Europe Slickline Services Market Revenue (Million), by Country 2024 & 2032
- Figure 5: Europe Slickline Services Market Revenue Share (%), by Country 2024 & 2032
- Figure 6: Asia Pacific Slickline Services Market Revenue (Million), by Country 2024 & 2032
- Figure 7: Asia Pacific Slickline Services Market Revenue Share (%), by Country 2024 & 2032
- Figure 8: South America Slickline Services Market Revenue (Million), by Country 2024 & 2032
- Figure 9: South America Slickline Services Market Revenue Share (%), by Country 2024 & 2032
- Figure 10: MEA Slickline Services Market Revenue (Million), by Country 2024 & 2032
- Figure 11: MEA Slickline Services Market Revenue Share (%), by Country 2024 & 2032
- Figure 12: North America Slickline Services Market Revenue (Million), by Operation 2024 & 2032
- Figure 13: North America Slickline Services Market Revenue Share (%), by Operation 2024 & 2032
- Figure 14: North America Slickline Services Market Revenue (Million), by Location of Deployment 2024 & 2032
- Figure 15: North America Slickline Services Market Revenue Share (%), by Location of Deployment 2024 & 2032
- Figure 16: North America Slickline Services Market Revenue (Million), by Country 2024 & 2032
- Figure 17: North America Slickline Services Market Revenue Share (%), by Country 2024 & 2032
- Figure 18: Europe Slickline Services Market Revenue (Million), by Operation 2024 & 2032
- Figure 19: Europe Slickline Services Market Revenue Share (%), by Operation 2024 & 2032
- Figure 20: Europe Slickline Services Market Revenue (Million), by Location of Deployment 2024 & 2032
- Figure 21: Europe Slickline Services Market Revenue Share (%), by Location of Deployment 2024 & 2032
- Figure 22: Europe Slickline Services Market Revenue (Million), by Country 2024 & 2032
- Figure 23: Europe Slickline Services Market Revenue Share (%), by Country 2024 & 2032
- Figure 24: Asia Pacific Slickline Services Market Revenue (Million), by Operation 2024 & 2032
- Figure 25: Asia Pacific Slickline Services Market Revenue Share (%), by Operation 2024 & 2032
- Figure 26: Asia Pacific Slickline Services Market Revenue (Million), by Location of Deployment 2024 & 2032
- Figure 27: Asia Pacific Slickline Services Market Revenue Share (%), by Location of Deployment 2024 & 2032
- Figure 28: Asia Pacific Slickline Services Market Revenue (Million), by Country 2024 & 2032
- Figure 29: Asia Pacific Slickline Services Market Revenue Share (%), by Country 2024 & 2032
- Figure 30: South America Slickline Services Market Revenue (Million), by Operation 2024 & 2032
- Figure 31: South America Slickline Services Market Revenue Share (%), by Operation 2024 & 2032
- Figure 32: South America Slickline Services Market Revenue (Million), by Location of Deployment 2024 & 2032
- Figure 33: South America Slickline Services Market Revenue Share (%), by Location of Deployment 2024 & 2032
- Figure 34: South America Slickline Services Market Revenue (Million), by Country 2024 & 2032
- Figure 35: South America Slickline Services Market Revenue Share (%), by Country 2024 & 2032
- Figure 36: Middle East and Africa Slickline Services Market Revenue (Million), by Operation 2024 & 2032
- Figure 37: Middle East and Africa Slickline Services Market Revenue Share (%), by Operation 2024 & 2032
- Figure 38: Middle East and Africa Slickline Services Market Revenue (Million), by Location of Deployment 2024 & 2032
- Figure 39: Middle East and Africa Slickline Services Market Revenue Share (%), by Location of Deployment 2024 & 2032
- Figure 40: Middle East and Africa Slickline Services Market Revenue (Million), by Country 2024 & 2032
- Figure 41: Middle East and Africa Slickline Services Market Revenue Share (%), by Country 2024 & 2032
List of Tables
- Table 1: Global Slickline Services Market Revenue Million Forecast, by Region 2019 & 2032
- Table 2: Global Slickline Services Market Revenue Million Forecast, by Operation 2019 & 2032
- Table 3: Global Slickline Services Market Revenue Million Forecast, by Location of Deployment 2019 & 2032
- Table 4: Global Slickline Services Market Revenue Million Forecast, by Region 2019 & 2032
- Table 5: Global Slickline Services Market Revenue Million Forecast, by Country 2019 & 2032
- Table 6: United States Slickline Services Market Revenue (Million) Forecast, by Application 2019 & 2032
- Table 7: Canada Slickline Services Market Revenue (Million) Forecast, by Application 2019 & 2032
- Table 8: Mexico Slickline Services Market Revenue (Million) Forecast, by Application 2019 & 2032
- Table 9: Global Slickline Services Market Revenue Million Forecast, by Country 2019 & 2032
- Table 10: Germany Slickline Services Market Revenue (Million) Forecast, by Application 2019 & 2032
- Table 11: United Kingdom Slickline Services Market Revenue (Million) Forecast, by Application 2019 & 2032
- Table 12: France Slickline Services Market Revenue (Million) Forecast, by Application 2019 & 2032
- Table 13: Spain Slickline Services Market Revenue (Million) Forecast, by Application 2019 & 2032
- Table 14: Italy Slickline Services Market Revenue (Million) Forecast, by Application 2019 & 2032
- Table 15: Spain Slickline Services Market Revenue (Million) Forecast, by Application 2019 & 2032
- Table 16: Belgium Slickline Services Market Revenue (Million) Forecast, by Application 2019 & 2032
- Table 17: Netherland Slickline Services Market Revenue (Million) Forecast, by Application 2019 & 2032
- Table 18: Nordics Slickline Services Market Revenue (Million) Forecast, by Application 2019 & 2032
- Table 19: Rest of Europe Slickline Services Market Revenue (Million) Forecast, by Application 2019 & 2032
- Table 20: Global Slickline Services Market Revenue Million Forecast, by Country 2019 & 2032
- Table 21: China Slickline Services Market Revenue (Million) Forecast, by Application 2019 & 2032
- Table 22: Japan Slickline Services Market Revenue (Million) Forecast, by Application 2019 & 2032
- Table 23: India Slickline Services Market Revenue (Million) Forecast, by Application 2019 & 2032
- Table 24: South Korea Slickline Services Market Revenue (Million) Forecast, by Application 2019 & 2032
- Table 25: Southeast Asia Slickline Services Market Revenue (Million) Forecast, by Application 2019 & 2032
- Table 26: Australia Slickline Services Market Revenue (Million) Forecast, by Application 2019 & 2032
- Table 27: Indonesia Slickline Services Market Revenue (Million) Forecast, by Application 2019 & 2032
- Table 28: Phillipes Slickline Services Market Revenue (Million) Forecast, by Application 2019 & 2032
- Table 29: Singapore Slickline Services Market Revenue (Million) Forecast, by Application 2019 & 2032
- Table 30: Thailandc Slickline Services Market Revenue (Million) Forecast, by Application 2019 & 2032
- Table 31: Rest of Asia Pacific Slickline Services Market Revenue (Million) Forecast, by Application 2019 & 2032
- Table 32: Global Slickline Services Market Revenue Million Forecast, by Country 2019 & 2032
- Table 33: Brazil Slickline Services Market Revenue (Million) Forecast, by Application 2019 & 2032
- Table 34: Argentina Slickline Services Market Revenue (Million) Forecast, by Application 2019 & 2032
- Table 35: Peru Slickline Services Market Revenue (Million) Forecast, by Application 2019 & 2032
- Table 36: Chile Slickline Services Market Revenue (Million) Forecast, by Application 2019 & 2032
- Table 37: Colombia Slickline Services Market Revenue (Million) Forecast, by Application 2019 & 2032
- Table 38: Ecuador Slickline Services Market Revenue (Million) Forecast, by Application 2019 & 2032
- Table 39: Venezuela Slickline Services Market Revenue (Million) Forecast, by Application 2019 & 2032
- Table 40: Rest of South America Slickline Services Market Revenue (Million) Forecast, by Application 2019 & 2032
- Table 41: Global Slickline Services Market Revenue Million Forecast, by Country 2019 & 2032
- Table 42: United Arab Emirates Slickline Services Market Revenue (Million) Forecast, by Application 2019 & 2032
- Table 43: Saudi Arabia Slickline Services Market Revenue (Million) Forecast, by Application 2019 & 2032
- Table 44: South Africa Slickline Services Market Revenue (Million) Forecast, by Application 2019 & 2032
- Table 45: Rest of Middle East and Africa Slickline Services Market Revenue (Million) Forecast, by Application 2019 & 2032
- Table 46: Global Slickline Services Market Revenue Million Forecast, by Operation 2019 & 2032
- Table 47: Global Slickline Services Market Revenue Million Forecast, by Location of Deployment 2019 & 2032
- Table 48: Global Slickline Services Market Revenue Million Forecast, by Country 2019 & 2032
- Table 49: Global Slickline Services Market Revenue Million Forecast, by Operation 2019 & 2032
- Table 50: Global Slickline Services Market Revenue Million Forecast, by Location of Deployment 2019 & 2032
- Table 51: Global Slickline Services Market Revenue Million Forecast, by Country 2019 & 2032
- Table 52: Global Slickline Services Market Revenue Million Forecast, by Operation 2019 & 2032
- Table 53: Global Slickline Services Market Revenue Million Forecast, by Location of Deployment 2019 & 2032
- Table 54: Global Slickline Services Market Revenue Million Forecast, by Country 2019 & 2032
- Table 55: Global Slickline Services Market Revenue Million Forecast, by Operation 2019 & 2032
- Table 56: Global Slickline Services Market Revenue Million Forecast, by Location of Deployment 2019 & 2032
- Table 57: Global Slickline Services Market Revenue Million Forecast, by Country 2019 & 2032
- Table 58: Global Slickline Services Market Revenue Million Forecast, by Operation 2019 & 2032
- Table 59: Global Slickline Services Market Revenue Million Forecast, by Location of Deployment 2019 & 2032
- Table 60: Global Slickline Services Market Revenue Million Forecast, by Country 2019 & 2032
Frequently Asked Questions
1. What is the projected Compound Annual Growth Rate (CAGR) of the Slickline Services Market?
The projected CAGR is approximately > 2.30%.
2. Which companies are prominent players in the Slickline Services Market?
Key companies in the market include China Oilfield Services Ltd, Vallourec SA, National Oilwell Varco Inc, Baker Hughes Company, Halliburton Company, Weatherford International Ltd, Schlumberger Limited, Scientific Drilling International Inc.
3. What are the main segments of the Slickline Services Market?
The market segments include Operation, Location of Deployment.
4. Can you provide details about the market size?
The market size is estimated to be USD XX Million as of 2022.
5. What are some drivers contributing to market growth?
4.; Increased Drilling and Completion Activities.
6. What are the notable trends driving market growth?
Onshore Segment to Dominate the Market.
7. Are there any restraints impacting market growth?
4.; Volatility of Oil Prices.
8. Can you provide examples of recent developments in the market?
In October 2021, National Energy Services announced several drilling and evaluation service lines in GCC countries, totaling more than USD 150M. It also revealed that the multi-year contracts encompass slickline services, tubular running services, and testing services with multiple national oil companies.
9. What pricing options are available for accessing the report?
Pricing options include single-user, multi-user, and enterprise licenses priced at USD 4750, USD 5250, and USD 8750 respectively.
10. Is the market size provided in terms of value or volume?
The market size is provided in terms of value, measured in Million.
11. Are there any specific market keywords associated with the report?
Yes, the market keyword associated with the report is "Slickline Services Market," which aids in identifying and referencing the specific market segment covered.
12. How do I determine which pricing option suits my needs best?
The pricing options vary based on user requirements and access needs. Individual users may opt for single-user licenses, while businesses requiring broader access may choose multi-user or enterprise licenses for cost-effective access to the report.
13. Are there any additional resources or data provided in the Slickline Services Market report?
While the report offers comprehensive insights, it's advisable to review the specific contents or supplementary materials provided to ascertain if additional resources or data are available.
14. How can I stay updated on further developments or reports in the Slickline Services Market?
To stay informed about further developments, trends, and reports in the Slickline Services Market, consider subscribing to industry newsletters, following relevant companies and organizations, or regularly checking reputable industry news sources and publications.
Methodology
Step 1 - Identification of Relevant Samples Size from Population Database


Step 2 - Approaches for Defining Global Market Size (Value, Volume* & Price*)

Note*: In applicable scenarios
Step 3 - Data Sources
Primary Research
- Web Analytics
- Survey Reports
- Research Institute
- Latest Research Reports
- Opinion Leaders
Secondary Research
- Annual Reports
- White Paper
- Latest Press Release
- Industry Association
- Paid Database
- Investor Presentations

Step 4 - Data Triangulation
Involves using different sources of information in order to increase the validity of a study
These sources are likely to be stakeholders in a program - participants, other researchers, program staff, other community members, and so on.
Then we put all data in single framework & apply various statistical tools to find out the dynamic on the market.
During the analysis stage, feedback from the stakeholder groups would be compared to determine areas of agreement as well as areas of divergence
