

Key Insights
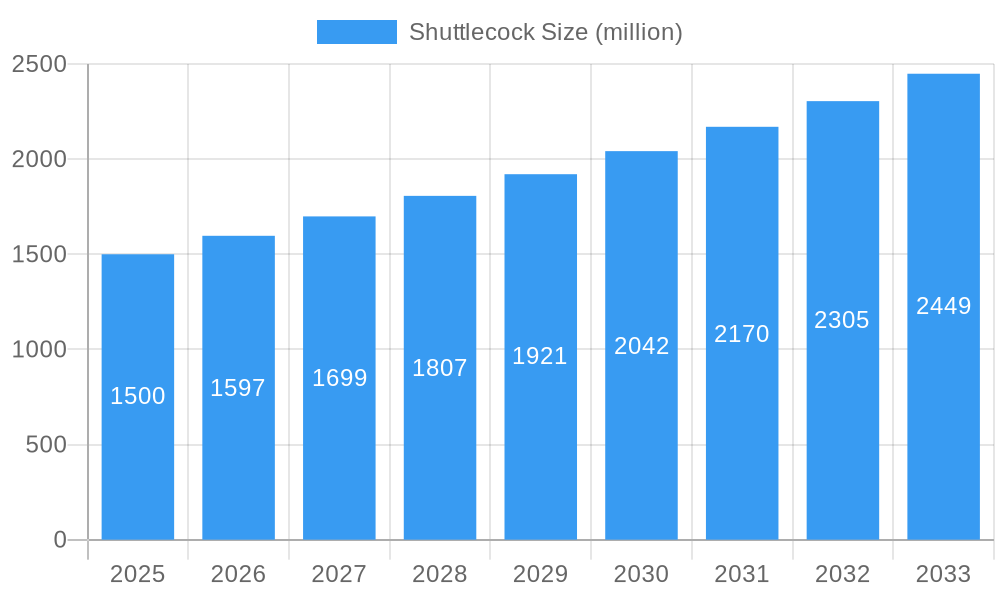
The global shuttlecock market is poised for robust expansion, projected to reach an estimated USD 1,500 million by 2025 and grow at a Compound Annual Growth Rate (CAGR) of approximately 6.5% through 2033. This significant growth is fueled by the escalating popularity of badminton as both a recreational activity and a professional sport worldwide. The increasing participation across various age groups, driven by health and wellness trends, directly translates to higher demand for shuttlecocks. Furthermore, the rising number of organized tournaments, from local club events to international championships, necessitates a continuous supply of high-quality shuttlecocks, acting as a substantial market driver. Key players are investing in product innovation, developing shuttlecocks with enhanced durability and consistent flight characteristics, which further stimulates market adoption.
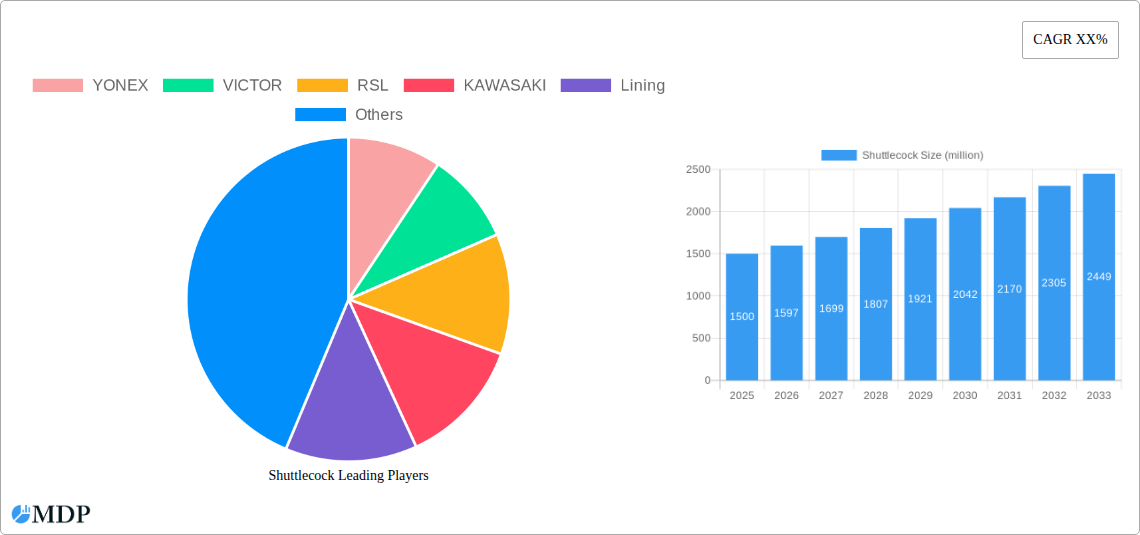
Shuttlecock Market Size (In Billion)
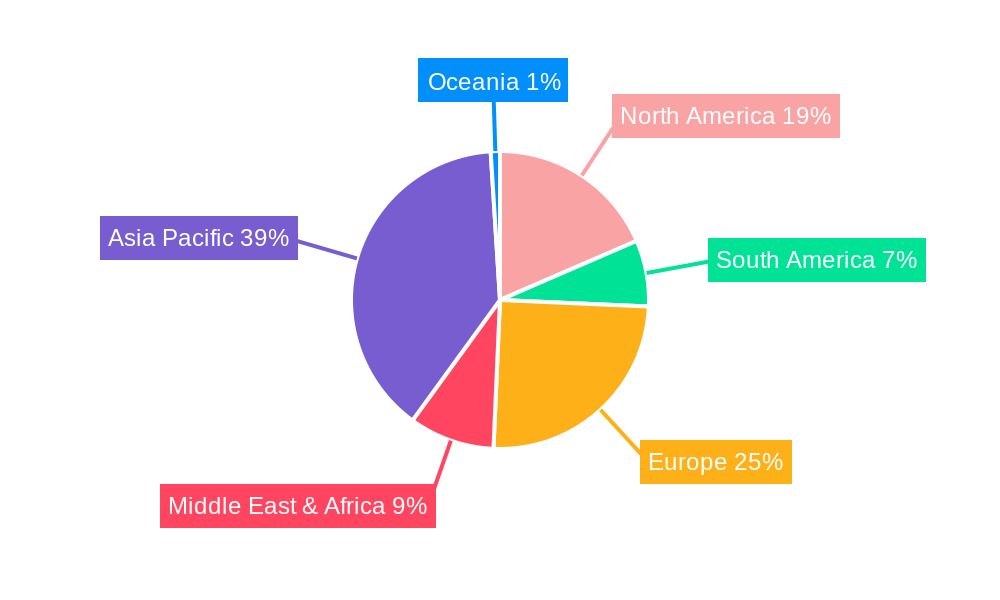
The market segmentation reveals a dynamic landscape, with Practice shuttlecocks holding a significant share due to the high volume required for training and casual play. However, the Tournaments segment is expected to exhibit higher growth rates, driven by the demand for premium, tournament-grade shuttlecocks that meet stringent performance standards. In terms of product types, Feather shuttlecocks remain the preferred choice for professional players and high-level competitions due to their superior flight and speed, while Nylon shuttlecocks cater to the wider recreational and beginner market, offering greater durability and affordability. Geographically, the Asia Pacific region is anticipated to lead the market, propelled by the immense popularity of badminton in countries like China and India, and the presence of major manufacturing hubs. North America and Europe also represent substantial markets, with growing participation rates and increasing investment in sports infrastructure.
Shuttlecock Company Market Share
This comprehensive report delves into the dynamic global shuttlecock market, providing in-depth analysis and strategic insights for industry stakeholders. Covering the historical period of 2019–2024, the base year of 2025, and a forecast period extending to 2033, this report offers a 360-degree view of market trends, opportunities, and challenges. With an estimated market size projected to reach millions by 2033, this report is essential for businesses seeking to capitalize on the growing demand for high-performance shuttlecocks.
Shuttlecock Market Dynamics & Concentration
The global shuttlecock market is characterized by a moderate to high concentration, with a few dominant players like YONEX, VICTOR, and RSL commanding significant market share, estimated to be over millions in collective revenue for the historical period. Innovation drivers are primarily fueled by advancements in material science and design, leading to enhanced durability and flight consistency. Regulatory frameworks, while generally supportive of sports equipment, focus on standardization for professional tournaments. Product substitutes include practice-grade nylon shuttlecocks for professional feather shuttlecocks, impacting different market segments. End-user trends show a growing preference for durable and high-performance shuttlecocks across both amateur and professional players. Mergers and acquisitions (M&A) activity has been present, with an estimated number of significant deals in the historical period, aimed at consolidating market position and expanding product portfolios. The market's growth is intrinsically linked to the increasing popularity of badminton worldwide.
Shuttlecock Industry Trends & Analysis
The shuttlecock industry is experiencing robust growth, projected to expand at a Compound Annual Growth Rate (CAGR) of percentage during the forecast period. This expansion is driven by several key factors, including the rising global participation in badminton, fueled by increased awareness of its health benefits and the sport's growing professionalization. Technological disruptions are playing a significant role, with ongoing research and development in materials science leading to the creation of more resilient and aerodynamically superior shuttlecocks. For instance, advancements in synthetic materials are narrowing the gap in performance between feather and nylon shuttlecocks, appealing to a wider consumer base. Consumer preferences are evolving, with a greater emphasis on consistency, durability, and eco-friendly materials. This is pushing manufacturers to innovate beyond traditional designs. Competitive dynamics are intense, with established brands like YONEX and VICTOR investing heavily in marketing and sponsorships of major tournaments to enhance brand visibility and loyalty. Market penetration is steadily increasing across developing economies, as disposable incomes rise and sports infrastructure improves. The estimated market penetration for shuttlecocks in the historical period was around percentage, with projections indicating a rise to percentage by 2033. The industry's overall value is estimated to be in the millions for the historical period, with substantial growth anticipated.
Leading Markets & Segments in Shuttlecock
The Application segment of Tournaments holds a dominant position in the global shuttlecock market, driven by the increasing frequency and scale of international and national badminton competitions. This segment is further bolstered by the demand for high-quality feather shuttlecocks, which are the official choice for most professional tournaments due to their superior flight characteristics and consistency. The Types segment of Feather Shuttlecocks consequently leads the market, accounting for an estimated percentage of the total market share in the historical period. Key drivers for the dominance of this segment include the inherent performance advantages of natural feathers, perceived by professional players as offering unmatched control and feel. Furthermore, economic policies in regions like Asia-Pacific, which are major hubs for badminton talent and infrastructure development, significantly contribute to this dominance. For example, government investments in sports facilities and grassroots development programs in countries such as China and India directly translate into higher demand for premium shuttlecocks used in competitive play. Infrastructure development, including the construction of indoor stadiums and training academies, further supports the growth of the tournament segment. The market penetration of feather shuttlecocks in this segment is estimated to be percentage, with continued growth expected as the sport's professionalization deepens.
Shuttlecock Product Developments
Recent product developments in the shuttlecock market are centered on enhancing durability, flight consistency, and environmental sustainability. Innovations include the introduction of advanced synthetic materials that mimic the performance of natural feathers, offering greater resilience to breakage and more predictable flight paths. Manufacturers are also experimenting with unique barrel designs and material compositions to optimize aerodynamics for different playing conditions and skill levels. These advancements provide competitive advantages by catering to a broader spectrum of players, from beginners seeking durable training options to professionals demanding peak performance. The market is witnessing a rise in eco-friendly shuttlecocks made from recycled or biodegradable materials, aligning with growing consumer environmental consciousness.
Key Drivers of Shuttlecock Growth
The global shuttlecock market is propelled by several key growth drivers. The burgeoning popularity of badminton as a recreational and professional sport worldwide, particularly in Asia, the Americas, and Europe, is a primary catalyst. Technological advancements in material science are leading to the development of more durable and consistent shuttlecocks, appealing to both amateur and professional players. Furthermore, increased disposable incomes in emerging economies have made sporting activities and equipment more accessible, driving demand. Sponsorships and media coverage of major badminton tournaments globally contribute significantly by raising the sport's profile and inspiring participation. Government initiatives promoting sports and healthy lifestyles also play a crucial role in expanding the consumer base for shuttlecocks.
Challenges in the Shuttlecock Market
Despite robust growth, the shuttlecock market faces several challenges. The inherent fragility of feather shuttlecocks, which are preferred for professional play, leads to a higher replacement rate and increased costs for players. Regulatory hurdles, though minimal, can sometimes involve certifications for materials used in professional-grade shuttlecocks. Supply chain disruptions, as seen in recent global events, can impact the availability and cost of raw materials, especially natural feathers. Intense competition among numerous brands, including established players like YONEX and emerging manufacturers, can lead to price pressures and necessitate significant investment in marketing and product differentiation. The market penetration of premium feather shuttlecocks remains limited in price-sensitive regions, presenting a barrier to widespread adoption.
Emerging Opportunities in Shuttlecock
Emerging opportunities in the shuttlecock market are largely driven by technological breakthroughs and strategic market expansion. The development of advanced synthetic materials that offer performance comparable to natural feathers at a lower price point presents a significant opportunity to capture a larger segment of the market, especially in price-sensitive regions. Strategic partnerships between shuttlecock manufacturers and sports academies or coaching institutions can foster brand loyalty and drive demand for specific product lines. Market expansion into untapped geographic regions and the development of specialized shuttlecocks for different playing environments (e.g., outdoor play) offer avenues for sustained growth. Furthermore, the increasing focus on sustainability presents an opportunity for companies to lead in the production of eco-friendly shuttlecocks, appealing to environmentally conscious consumers.
Leading Players in the Shuttlecock Sector
The global shuttlecock sector features a competitive landscape with several leading companies. Key players include:
- YONEX
- VICTOR
- RSL
- KAWASAKI
- Lining
- SOTX Sports Equipment
- Shanghai Badminton Factory
- DHS
- Yehlex
- Carlton
- GOSEN
- YODIMAN
- Yanlong
- HANGYU
- BABOLAT
- Kason
- Kumpoo
Key Milestones in Shuttlecock Industry
- 2019: Introduction of advanced composite materials for enhanced shuttlecock durability by YONEX.
- 2020: RSL launches a new line of eco-friendly shuttlecocks made from recycled materials.
- 2021: VICTOR expands its distribution network in Southeast Asia, boosting market presence.
- 2022: The International Badminton Federation (BWF) announces new standards for shuttlecock flight testing.
- 2023: KAWASAKI introduces its flagship feather shuttlecock line, focusing on professional tournament grade performance.
- 2024: Several smaller brands emerge with innovative manufacturing techniques, increasing market fragmentation.
Strategic Outlook for Shuttlecock Market
The strategic outlook for the shuttlecock market remains exceptionally positive, driven by the sport's escalating global popularity and continuous product innovation. Key growth accelerators include the increasing investment in badminton infrastructure and professional leagues, particularly in emerging economies. Manufacturers should focus on research and development to create more durable, consistent, and sustainable shuttlecock options to cater to diverse player preferences and environmental concerns. Strategic alliances with sports federations and endorsement deals with top-tier players will be crucial for enhancing brand visibility and market penetration. Embracing digital marketing and e-commerce platforms will also be vital for reaching a wider consumer base and adapting to evolving purchasing habits.
Shuttlecock Segmentation
-
1. Application
- 1.1. Practice
- 1.2. Tournaments
-
2. Types
- 2.1. Feather Shuttlecocks
- 2.2. Nylon Shuttlecocks
Shuttlecock Segmentation By Geography
-
1. North America
- 1.1. United States
- 1.2. Canada
- 1.3. Mexico
-
2. South America
- 2.1. Brazil
- 2.2. Argentina
- 2.3. Rest of South America
-
3. Europe
- 3.1. United Kingdom
- 3.2. Germany
- 3.3. France
- 3.4. Italy
- 3.5. Spain
- 3.6. Russia
- 3.7. Benelux
- 3.8. Nordics
- 3.9. Rest of Europe
-
4. Middle East & Africa
- 4.1. Turkey
- 4.2. Israel
- 4.3. GCC
- 4.4. North Africa
- 4.5. South Africa
- 4.6. Rest of Middle East & Africa
-
5. Asia Pacific
- 5.1. China
- 5.2. India
- 5.3. Japan
- 5.4. South Korea
- 5.5. ASEAN
- 5.6. Oceania
- 5.7. Rest of Asia Pacific
Shuttlecock Regional Market Share
Geographic Coverage of Shuttlecock
Shuttlecock REPORT HIGHLIGHTS
| Aspects | Details |
|---|---|
| Study Period | 2020-2034 |
| Base Year | 2025 |
| Estimated Year | 2026 |
| Forecast Period | 2026-2034 |
| Historical Period | 2020-2025 |
| Growth Rate | CAGR of XX% from 2020-2034 |
| Segmentation |
|
Table of Contents
- 1. Introduction
- 1.1. Research Scope
- 1.2. Market Segmentation
- 1.3. Research Methodology
- 1.4. Definitions and Assumptions
- 2. Executive Summary
- 2.1. Introduction
- 3. Market Dynamics
- 3.1. Introduction
- 3.2. Market Drivers
- 3.3. Market Restrains
- 3.4. Market Trends
- 4. Market Factor Analysis
- 4.1. Porters Five Forces
- 4.2. Supply/Value Chain
- 4.3. PESTEL analysis
- 4.4. Market Entropy
- 4.5. Patent/Trademark Analysis
- 5. Global Shuttlecock Analysis, Insights and Forecast, 2020-2032
- 5.1. Market Analysis, Insights and Forecast - by Application
- 5.1.1. Practice
- 5.1.2. Tournaments
- 5.2. Market Analysis, Insights and Forecast - by Types
- 5.2.1. Feather Shuttlecocks
- 5.2.2. Nylon Shuttlecocks
- 5.3. Market Analysis, Insights and Forecast - by Region
- 5.3.1. North America
- 5.3.2. South America
- 5.3.3. Europe
- 5.3.4. Middle East & Africa
- 5.3.5. Asia Pacific
- 5.1. Market Analysis, Insights and Forecast - by Application
- 6. North America Shuttlecock Analysis, Insights and Forecast, 2020-2032
- 6.1. Market Analysis, Insights and Forecast - by Application
- 6.1.1. Practice
- 6.1.2. Tournaments
- 6.2. Market Analysis, Insights and Forecast - by Types
- 6.2.1. Feather Shuttlecocks
- 6.2.2. Nylon Shuttlecocks
- 6.1. Market Analysis, Insights and Forecast - by Application
- 7. South America Shuttlecock Analysis, Insights and Forecast, 2020-2032
- 7.1. Market Analysis, Insights and Forecast - by Application
- 7.1.1. Practice
- 7.1.2. Tournaments
- 7.2. Market Analysis, Insights and Forecast - by Types
- 7.2.1. Feather Shuttlecocks
- 7.2.2. Nylon Shuttlecocks
- 7.1. Market Analysis, Insights and Forecast - by Application
- 8. Europe Shuttlecock Analysis, Insights and Forecast, 2020-2032
- 8.1. Market Analysis, Insights and Forecast - by Application
- 8.1.1. Practice
- 8.1.2. Tournaments
- 8.2. Market Analysis, Insights and Forecast - by Types
- 8.2.1. Feather Shuttlecocks
- 8.2.2. Nylon Shuttlecocks
- 8.1. Market Analysis, Insights and Forecast - by Application
- 9. Middle East & Africa Shuttlecock Analysis, Insights and Forecast, 2020-2032
- 9.1. Market Analysis, Insights and Forecast - by Application
- 9.1.1. Practice
- 9.1.2. Tournaments
- 9.2. Market Analysis, Insights and Forecast - by Types
- 9.2.1. Feather Shuttlecocks
- 9.2.2. Nylon Shuttlecocks
- 9.1. Market Analysis, Insights and Forecast - by Application
- 10. Asia Pacific Shuttlecock Analysis, Insights and Forecast, 2020-2032
- 10.1. Market Analysis, Insights and Forecast - by Application
- 10.1.1. Practice
- 10.1.2. Tournaments
- 10.2. Market Analysis, Insights and Forecast - by Types
- 10.2.1. Feather Shuttlecocks
- 10.2.2. Nylon Shuttlecocks
- 10.1. Market Analysis, Insights and Forecast - by Application
- 11. Competitive Analysis
- 11.1. Global Market Share Analysis 2025
- 11.2. Company Profiles
- 11.2.1 YONEX
- 11.2.1.1. Overview
- 11.2.1.2. Products
- 11.2.1.3. SWOT Analysis
- 11.2.1.4. Recent Developments
- 11.2.1.5. Financials (Based on Availability)
- 11.2.2 VICTOR
- 11.2.2.1. Overview
- 11.2.2.2. Products
- 11.2.2.3. SWOT Analysis
- 11.2.2.4. Recent Developments
- 11.2.2.5. Financials (Based on Availability)
- 11.2.3 RSL
- 11.2.3.1. Overview
- 11.2.3.2. Products
- 11.2.3.3. SWOT Analysis
- 11.2.3.4. Recent Developments
- 11.2.3.5. Financials (Based on Availability)
- 11.2.4 KAWASAKI
- 11.2.4.1. Overview
- 11.2.4.2. Products
- 11.2.4.3. SWOT Analysis
- 11.2.4.4. Recent Developments
- 11.2.4.5. Financials (Based on Availability)
- 11.2.5 Lining
- 11.2.5.1. Overview
- 11.2.5.2. Products
- 11.2.5.3. SWOT Analysis
- 11.2.5.4. Recent Developments
- 11.2.5.5. Financials (Based on Availability)
- 11.2.6 SOTX Sports Equipment
- 11.2.6.1. Overview
- 11.2.6.2. Products
- 11.2.6.3. SWOT Analysis
- 11.2.6.4. Recent Developments
- 11.2.6.5. Financials (Based on Availability)
- 11.2.7 Shanghai Badminton Factory
- 11.2.7.1. Overview
- 11.2.7.2. Products
- 11.2.7.3. SWOT Analysis
- 11.2.7.4. Recent Developments
- 11.2.7.5. Financials (Based on Availability)
- 11.2.8 DHS
- 11.2.8.1. Overview
- 11.2.8.2. Products
- 11.2.8.3. SWOT Analysis
- 11.2.8.4. Recent Developments
- 11.2.8.5. Financials (Based on Availability)
- 11.2.9 Yehlex
- 11.2.9.1. Overview
- 11.2.9.2. Products
- 11.2.9.3. SWOT Analysis
- 11.2.9.4. Recent Developments
- 11.2.9.5. Financials (Based on Availability)
- 11.2.10 Carlton
- 11.2.10.1. Overview
- 11.2.10.2. Products
- 11.2.10.3. SWOT Analysis
- 11.2.10.4. Recent Developments
- 11.2.10.5. Financials (Based on Availability)
- 11.2.11 GOSEN
- 11.2.11.1. Overview
- 11.2.11.2. Products
- 11.2.11.3. SWOT Analysis
- 11.2.11.4. Recent Developments
- 11.2.11.5. Financials (Based on Availability)
- 11.2.12 YODIMAN
- 11.2.12.1. Overview
- 11.2.12.2. Products
- 11.2.12.3. SWOT Analysis
- 11.2.12.4. Recent Developments
- 11.2.12.5. Financials (Based on Availability)
- 11.2.13 Yanlong
- 11.2.13.1. Overview
- 11.2.13.2. Products
- 11.2.13.3. SWOT Analysis
- 11.2.13.4. Recent Developments
- 11.2.13.5. Financials (Based on Availability)
- 11.2.14 HANGYU
- 11.2.14.1. Overview
- 11.2.14.2. Products
- 11.2.14.3. SWOT Analysis
- 11.2.14.4. Recent Developments
- 11.2.14.5. Financials (Based on Availability)
- 11.2.15 BABOLAT
- 11.2.15.1. Overview
- 11.2.15.2. Products
- 11.2.15.3. SWOT Analysis
- 11.2.15.4. Recent Developments
- 11.2.15.5. Financials (Based on Availability)
- 11.2.16 Kason
- 11.2.16.1. Overview
- 11.2.16.2. Products
- 11.2.16.3. SWOT Analysis
- 11.2.16.4. Recent Developments
- 11.2.16.5. Financials (Based on Availability)
- 11.2.17 Kumpoo
- 11.2.17.1. Overview
- 11.2.17.2. Products
- 11.2.17.3. SWOT Analysis
- 11.2.17.4. Recent Developments
- 11.2.17.5. Financials (Based on Availability)
- 11.2.1 YONEX
List of Figures
- Figure 1: Global Shuttlecock Revenue Breakdown (million, %) by Region 2025 & 2033
- Figure 2: North America Shuttlecock Revenue (million), by Application 2025 & 2033
- Figure 3: North America Shuttlecock Revenue Share (%), by Application 2025 & 2033
- Figure 4: North America Shuttlecock Revenue (million), by Types 2025 & 2033
- Figure 5: North America Shuttlecock Revenue Share (%), by Types 2025 & 2033
- Figure 6: North America Shuttlecock Revenue (million), by Country 2025 & 2033
- Figure 7: North America Shuttlecock Revenue Share (%), by Country 2025 & 2033
- Figure 8: South America Shuttlecock Revenue (million), by Application 2025 & 2033
- Figure 9: South America Shuttlecock Revenue Share (%), by Application 2025 & 2033
- Figure 10: South America Shuttlecock Revenue (million), by Types 2025 & 2033
- Figure 11: South America Shuttlecock Revenue Share (%), by Types 2025 & 2033
- Figure 12: South America Shuttlecock Revenue (million), by Country 2025 & 2033
- Figure 13: South America Shuttlecock Revenue Share (%), by Country 2025 & 2033
- Figure 14: Europe Shuttlecock Revenue (million), by Application 2025 & 2033
- Figure 15: Europe Shuttlecock Revenue Share (%), by Application 2025 & 2033
- Figure 16: Europe Shuttlecock Revenue (million), by Types 2025 & 2033
- Figure 17: Europe Shuttlecock Revenue Share (%), by Types 2025 & 2033
- Figure 18: Europe Shuttlecock Revenue (million), by Country 2025 & 2033
- Figure 19: Europe Shuttlecock Revenue Share (%), by Country 2025 & 2033
- Figure 20: Middle East & Africa Shuttlecock Revenue (million), by Application 2025 & 2033
- Figure 21: Middle East & Africa Shuttlecock Revenue Share (%), by Application 2025 & 2033
- Figure 22: Middle East & Africa Shuttlecock Revenue (million), by Types 2025 & 2033
- Figure 23: Middle East & Africa Shuttlecock Revenue Share (%), by Types 2025 & 2033
- Figure 24: Middle East & Africa Shuttlecock Revenue (million), by Country 2025 & 2033
- Figure 25: Middle East & Africa Shuttlecock Revenue Share (%), by Country 2025 & 2033
- Figure 26: Asia Pacific Shuttlecock Revenue (million), by Application 2025 & 2033
- Figure 27: Asia Pacific Shuttlecock Revenue Share (%), by Application 2025 & 2033
- Figure 28: Asia Pacific Shuttlecock Revenue (million), by Types 2025 & 2033
- Figure 29: Asia Pacific Shuttlecock Revenue Share (%), by Types 2025 & 2033
- Figure 30: Asia Pacific Shuttlecock Revenue (million), by Country 2025 & 2033
- Figure 31: Asia Pacific Shuttlecock Revenue Share (%), by Country 2025 & 2033
List of Tables
- Table 1: Global Shuttlecock Revenue million Forecast, by Application 2020 & 2033
- Table 2: Global Shuttlecock Revenue million Forecast, by Types 2020 & 2033
- Table 3: Global Shuttlecock Revenue million Forecast, by Region 2020 & 2033
- Table 4: Global Shuttlecock Revenue million Forecast, by Application 2020 & 2033
- Table 5: Global Shuttlecock Revenue million Forecast, by Types 2020 & 2033
- Table 6: Global Shuttlecock Revenue million Forecast, by Country 2020 & 2033
- Table 7: United States Shuttlecock Revenue (million) Forecast, by Application 2020 & 2033
- Table 8: Canada Shuttlecock Revenue (million) Forecast, by Application 2020 & 2033
- Table 9: Mexico Shuttlecock Revenue (million) Forecast, by Application 2020 & 2033
- Table 10: Global Shuttlecock Revenue million Forecast, by Application 2020 & 2033
- Table 11: Global Shuttlecock Revenue million Forecast, by Types 2020 & 2033
- Table 12: Global Shuttlecock Revenue million Forecast, by Country 2020 & 2033
- Table 13: Brazil Shuttlecock Revenue (million) Forecast, by Application 2020 & 2033
- Table 14: Argentina Shuttlecock Revenue (million) Forecast, by Application 2020 & 2033
- Table 15: Rest of South America Shuttlecock Revenue (million) Forecast, by Application 2020 & 2033
- Table 16: Global Shuttlecock Revenue million Forecast, by Application 2020 & 2033
- Table 17: Global Shuttlecock Revenue million Forecast, by Types 2020 & 2033
- Table 18: Global Shuttlecock Revenue million Forecast, by Country 2020 & 2033
- Table 19: United Kingdom Shuttlecock Revenue (million) Forecast, by Application 2020 & 2033
- Table 20: Germany Shuttlecock Revenue (million) Forecast, by Application 2020 & 2033
- Table 21: France Shuttlecock Revenue (million) Forecast, by Application 2020 & 2033
- Table 22: Italy Shuttlecock Revenue (million) Forecast, by Application 2020 & 2033
- Table 23: Spain Shuttlecock Revenue (million) Forecast, by Application 2020 & 2033
- Table 24: Russia Shuttlecock Revenue (million) Forecast, by Application 2020 & 2033
- Table 25: Benelux Shuttlecock Revenue (million) Forecast, by Application 2020 & 2033
- Table 26: Nordics Shuttlecock Revenue (million) Forecast, by Application 2020 & 2033
- Table 27: Rest of Europe Shuttlecock Revenue (million) Forecast, by Application 2020 & 2033
- Table 28: Global Shuttlecock Revenue million Forecast, by Application 2020 & 2033
- Table 29: Global Shuttlecock Revenue million Forecast, by Types 2020 & 2033
- Table 30: Global Shuttlecock Revenue million Forecast, by Country 2020 & 2033
- Table 31: Turkey Shuttlecock Revenue (million) Forecast, by Application 2020 & 2033
- Table 32: Israel Shuttlecock Revenue (million) Forecast, by Application 2020 & 2033
- Table 33: GCC Shuttlecock Revenue (million) Forecast, by Application 2020 & 2033
- Table 34: North Africa Shuttlecock Revenue (million) Forecast, by Application 2020 & 2033
- Table 35: South Africa Shuttlecock Revenue (million) Forecast, by Application 2020 & 2033
- Table 36: Rest of Middle East & Africa Shuttlecock Revenue (million) Forecast, by Application 2020 & 2033
- Table 37: Global Shuttlecock Revenue million Forecast, by Application 2020 & 2033
- Table 38: Global Shuttlecock Revenue million Forecast, by Types 2020 & 2033
- Table 39: Global Shuttlecock Revenue million Forecast, by Country 2020 & 2033
- Table 40: China Shuttlecock Revenue (million) Forecast, by Application 2020 & 2033
- Table 41: India Shuttlecock Revenue (million) Forecast, by Application 2020 & 2033
- Table 42: Japan Shuttlecock Revenue (million) Forecast, by Application 2020 & 2033
- Table 43: South Korea Shuttlecock Revenue (million) Forecast, by Application 2020 & 2033
- Table 44: ASEAN Shuttlecock Revenue (million) Forecast, by Application 2020 & 2033
- Table 45: Oceania Shuttlecock Revenue (million) Forecast, by Application 2020 & 2033
- Table 46: Rest of Asia Pacific Shuttlecock Revenue (million) Forecast, by Application 2020 & 2033
Frequently Asked Questions
1. What is the projected Compound Annual Growth Rate (CAGR) of the Shuttlecock?
The projected CAGR is approximately XX%.
2. Which companies are prominent players in the Shuttlecock?
Key companies in the market include YONEX, VICTOR, RSL, KAWASAKI, Lining, SOTX Sports Equipment, Shanghai Badminton Factory, DHS, Yehlex, Carlton, GOSEN, YODIMAN, Yanlong, HANGYU, BABOLAT, Kason, Kumpoo.
3. What are the main segments of the Shuttlecock?
The market segments include Application, Types.
4. Can you provide details about the market size?
The market size is estimated to be USD XXX million as of 2022.
5. What are some drivers contributing to market growth?
N/A
6. What are the notable trends driving market growth?
N/A
7. Are there any restraints impacting market growth?
N/A
8. Can you provide examples of recent developments in the market?
N/A
9. What pricing options are available for accessing the report?
Pricing options include single-user, multi-user, and enterprise licenses priced at USD 2900.00, USD 4350.00, and USD 5800.00 respectively.
10. Is the market size provided in terms of value or volume?
The market size is provided in terms of value, measured in million.
11. Are there any specific market keywords associated with the report?
Yes, the market keyword associated with the report is "Shuttlecock," which aids in identifying and referencing the specific market segment covered.
12. How do I determine which pricing option suits my needs best?
The pricing options vary based on user requirements and access needs. Individual users may opt for single-user licenses, while businesses requiring broader access may choose multi-user or enterprise licenses for cost-effective access to the report.
13. Are there any additional resources or data provided in the Shuttlecock report?
While the report offers comprehensive insights, it's advisable to review the specific contents or supplementary materials provided to ascertain if additional resources or data are available.
14. How can I stay updated on further developments or reports in the Shuttlecock?
To stay informed about further developments, trends, and reports in the Shuttlecock, consider subscribing to industry newsletters, following relevant companies and organizations, or regularly checking reputable industry news sources and publications.
Methodology
Step 1 - Identification of Relevant Samples Size from Population Database


Step 2 - Approaches for Defining Global Market Size (Value, Volume* & Price*)

Note*: In applicable scenarios
Step 3 - Data Sources
Primary Research
- Web Analytics
- Survey Reports
- Research Institute
- Latest Research Reports
- Opinion Leaders
Secondary Research
- Annual Reports
- White Paper
- Latest Press Release
- Industry Association
- Paid Database
- Investor Presentations

Step 4 - Data Triangulation
Involves using different sources of information in order to increase the validity of a study
These sources are likely to be stakeholders in a program - participants, other researchers, program staff, other community members, and so on.
Then we put all data in single framework & apply various statistical tools to find out the dynamic on the market.
During the analysis stage, feedback from the stakeholder groups would be compared to determine areas of agreement as well as areas of divergence