

Key Insights
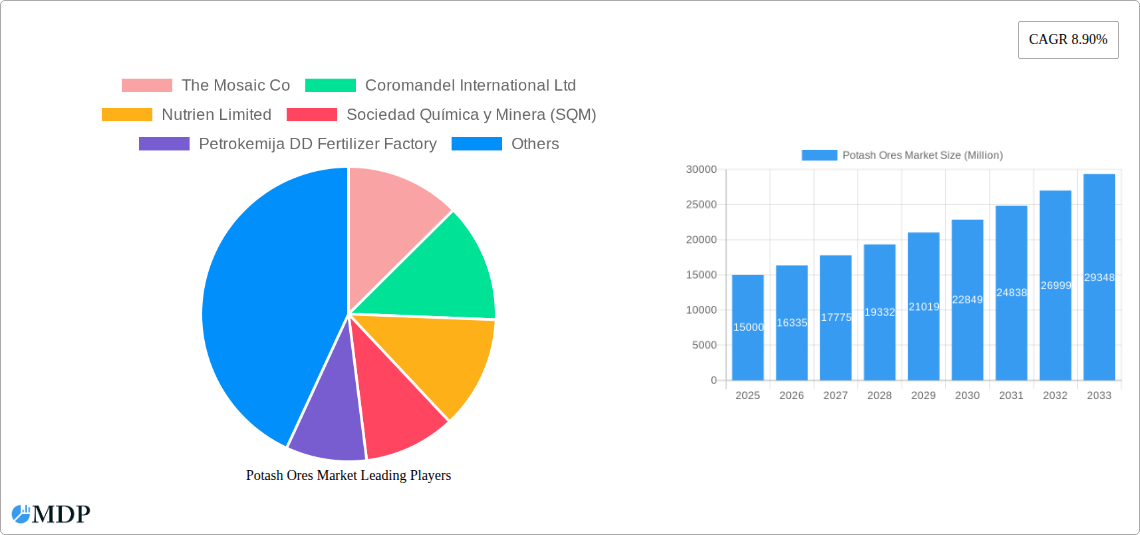
The global potash ores market is poised for significant expansion, projecting a Compound Annual Growth Rate (CAGR) of 8.9% from 2025 to 2033. This upward trend is primarily fueled by escalating global food demand, driven by a growing population requiring enhanced agricultural productivity. Advances in agricultural technologies, including precision farming and fertigation, are optimizing potash efficacy and utilization. Furthermore, government incentives for sustainable agricultural practices worldwide are indirectly bolstering the market by promoting responsible fertilizer management. Despite challenges such as price volatility influenced by geopolitical factors and environmental considerations regarding fertilizer runoff, the market's positive growth trajectory is expected to persist. Segmentation indicates robust demand across fertigation, foliar, and soil applications, serving essential crop types like field crops, horticultural crops, and turf & ornamental. Key market leaders, including The Mosaic Co, Nutrien Limited, and SQM, command market share through their substantial production capacities and extensive distribution networks. Regional market dynamics are anticipated to align with areas of substantial agricultural activity and population centers. The market's ongoing expansion signals considerable opportunities for investment and innovation within the potash ore sector.
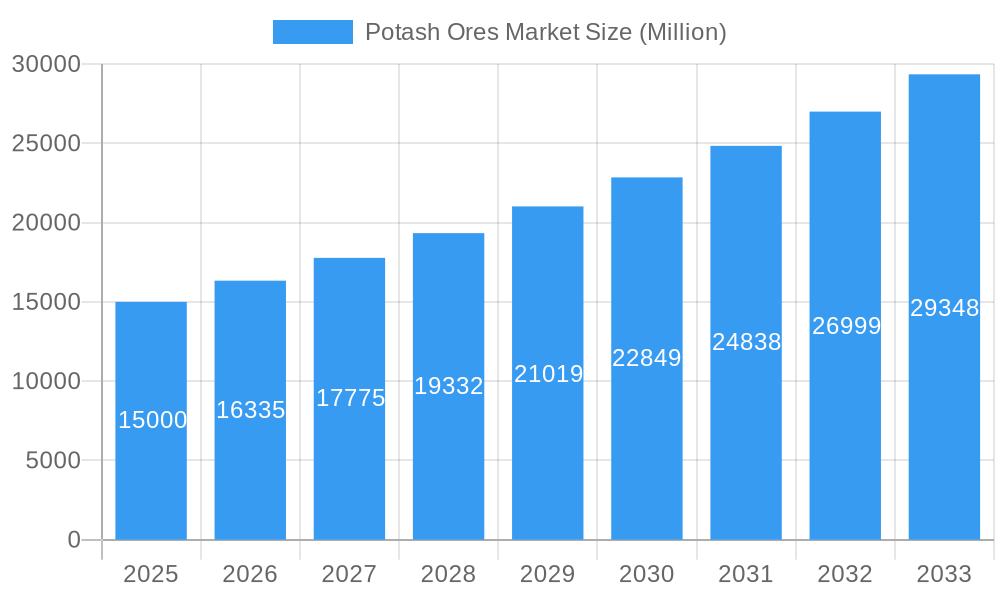
Potash Ores Market Market Size (In Billion)
The forecast period of 2025-2033 anticipates sustained market growth. Assuming stable global economic and agricultural conditions, the market size, estimated at 66.11 billion in the base year of 2025, is set to expand. Key growth drivers, including increasing food demand, technological advancements in fertilizer application, and government support for sustainable agriculture, are expected to remain consistent. Nevertheless, addressing price volatility and environmental concerns will necessitate responsible mining practices and the development of efficient, eco-friendly fertilizer technologies. This dynamic market requires diligent observation of global economic trends, agricultural developments, and regulatory shifts.
Potash Ores Market Company Market Share
Dive Deep into the Potash Ores Market: A Comprehensive Report (2019-2033)
This insightful report provides a detailed analysis of the global Potash Ores Market, offering invaluable data and forecasts for stakeholders across the agricultural and chemical industries. From market dynamics and concentration to leading players and emerging opportunities, this comprehensive study covers all key aspects, equipping you with the knowledge to make informed strategic decisions. The report covers the period from 2019 to 2033, with a focus on the forecast period from 2025 to 2033 (Base Year: 2025, Estimated Year: 2025). Expect a thorough examination of market segments including Straight and Other types, application modes (Fertigation, Foliar, Soil), and crop types (Field Crops, Horticultural Crops, Turf & Ornamental). The market size is projected to reach xx Million by 2033.
Potash Ores Market Market Dynamics & Concentration
This section analyzes the competitive landscape of the potash ores market, exploring factors influencing market concentration, innovation, regulation, substitution, end-user trends, and mergers and acquisitions (M&A). We will delve into market share distribution among key players and assess the frequency of M&A activities during the study period (2019-2024). The high concentration of the market is driven by a small number of large players who control significant production capacities and distribution networks. However, emerging players and innovative technologies are gradually increasing competition.
- Market Concentration: The global potash ores market exhibits a moderately concentrated structure, with the top five players holding approximately xx% of the market share in 2024. This concentration is expected to remain relatively stable through 2033, although smaller players are likely to witness marginal growth.
- Innovation Drivers: Technological advancements in potash extraction and processing, alongside the development of enhanced nutrient delivery systems, are major drivers of innovation.
- Regulatory Frameworks: Government regulations concerning environmental protection and sustainable agricultural practices significantly impact market dynamics. Compliance with these regulations often necessitates capital investment in new technologies and production processes.
- Product Substitutes: While limited, certain alternative fertilizers and nutrient management strategies serve as substitutes, exerting modest competitive pressure.
- End-User Trends: Growing global population and rising demand for food security drive the need for increased fertilizer usage, positively impacting market growth. Sustainable farming practices and precision agriculture are also emerging trends.
- M&A Activities: The analysis reveals xx M&A deals involving major players during the 2019-2024 period, mostly aimed at expanding production capabilities, distribution networks, and market reach.
Potash Ores Market Industry Trends & Analysis
This section provides a detailed analysis of market growth drivers, technological disruptions, consumer preferences, and competitive dynamics. We examine the historical and projected Compound Annual Growth Rate (CAGR) and assess market penetration across different segments. The market is experiencing steady growth, fueled by factors such as increasing food demand, global population growth, and the growing adoption of efficient farming techniques.
Leading Markets & Segments in Potash Ores Market
This segment identifies the dominant regions, countries, and product segments within the potash ores market, pinpointing key drivers behind their dominance. We provide a comprehensive overview of the market performance across different segments:
- By Type: Straight potash remains the dominant type, holding approximately xx% market share, due to its widespread use and effectiveness in crop production. Other types are witnessing growth driven by the rising demand for customized fertilizer blends.
- By Application Mode: Soil application remains the most widely adopted method, accounting for xx% of the market. However, Fertigation and Foliar application are gaining traction due to their efficiency and reduced environmental impact.
- By Crop Type: Field crops (e.g., corn, wheat, soybeans) constitute the largest segment, owing to their extensive cultivation globally and high fertilizer requirement. Horticultural crops and turf & ornamental are also significant segments.
- Regional Dominance: [Insert dominant region/country and explain reasons in a paragraph. Examples: North America, due to its established potash production infrastructure and strong agricultural sector. Or, Specific countries within Asia-Pacific based on population growth and agricultural expansion]. The analysis will include factors such as economic policies, governmental support for the agricultural sector, and infrastructure investments.
Potash Ores Market Product Developments
Recent product innovations in the potash ores market focus on improving nutrient efficiency, enhancing soil health, and minimizing environmental impact. This includes advancements in controlled-release fertilizers and the development of bio-stimulants that enhance nutrient uptake by plants. These innovations cater to the growing demand for sustainable and high-yield agricultural practices.
Key Drivers of Potash Ores Market Growth
Several factors are driving the expansion of the potash ores market. These include:
- Technological Advancements: Improved extraction techniques and the development of efficient nutrient delivery systems boost productivity and reduce environmental impact.
- Economic Growth: Rising global disposable incomes and increasing food demands contribute to growth.
- Governmental Policies: Supportive policies promoting sustainable agriculture and food security drive investments in the sector.
Challenges in the Potash Ores Market Market
The potash ores market faces several challenges, including:
- Regulatory Hurdles: Stringent environmental regulations and compliance costs can impact profitability.
- Supply Chain Issues: Geopolitical instability and fluctuating prices of raw materials can disrupt supply chains.
- Competitive Pressures: Intense competition among major players often leads to price wars and reduced margins. The impact can be quantified as a x% reduction in average profit margins over the past 5 years.
Emerging Opportunities in Potash Ores Market
The potash ores market presents several long-term opportunities, including:
- Technological Breakthroughs: Advancements in precision agriculture and nutrient management technologies offer significant potential for growth.
- Strategic Partnerships: Collaborations between potash producers, agricultural technology companies, and retailers can lead to increased market penetration and efficiency.
- Market Expansion: Growing demand for fertilizers in developing countries presents considerable expansion potential.
Leading Players in the Potash Ores Market Sector
- The Mosaic Co
- Coromandel International Ltd
- Nutrien Limited
- Sociedad Química y Minera (SQM)
- Petrokemija DD Fertilizer Factory
- Sinofert Holdings Ltd
- Eurochem
- Intrepid Potash Inc
- K+S AKTIENGESELLSCHAFT
Key Milestones in Potash Ores Market Industry
- February 2019: Nutrien Ltd. acquired Van Horn, Inc., expanding its retail network and market reach in the US.
- March 2021: Mosaic partnered with Sound Agriculture to develop a nutrient efficiency product, leveraging bio-inspired chemistry to improve fertilizer utilization. The product is anticipated to launch in 2023 in the US.
- March 2022: EuroChem Group acquired Fertilizantes Heringer SA, boosting its production and distribution capacity in Brazil.
Strategic Outlook for Potash Ores Market Market
The future of the potash ores market looks promising, driven by technological innovations and growing global food demand. Strategic partnerships and investments in sustainable agricultural practices will be critical for success. The market is poised for sustained growth, with significant opportunities for players who can effectively adapt to evolving consumer preferences and regulatory frameworks. Companies that prioritize innovation, sustainable practices, and efficient supply chain management are best positioned to capture market share.
Potash Ores Market Segmentation
- 1. Production Analysis
- 2. Consumption Analysis
- 3. Import Market Analysis (Value & Volume)
- 4. Export Market Analysis (Value & Volume)
- 5. Price Trend Analysis
Potash Ores Market Segmentation By Geography
-
1. North America
- 1.1. United States
- 1.2. Canada
- 1.3. Mexico
-
2. South America
- 2.1. Brazil
- 2.2. Argentina
- 2.3. Rest of South America
-
3. Europe
- 3.1. United Kingdom
- 3.2. Germany
- 3.3. France
- 3.4. Italy
- 3.5. Spain
- 3.6. Russia
- 3.7. Benelux
- 3.8. Nordics
- 3.9. Rest of Europe
-
4. Middle East & Africa
- 4.1. Turkey
- 4.2. Israel
- 4.3. GCC
- 4.4. North Africa
- 4.5. South Africa
- 4.6. Rest of Middle East & Africa
-
5. Asia Pacific
- 5.1. China
- 5.2. India
- 5.3. Japan
- 5.4. South Korea
- 5.5. ASEAN
- 5.6. Oceania
- 5.7. Rest of Asia Pacific
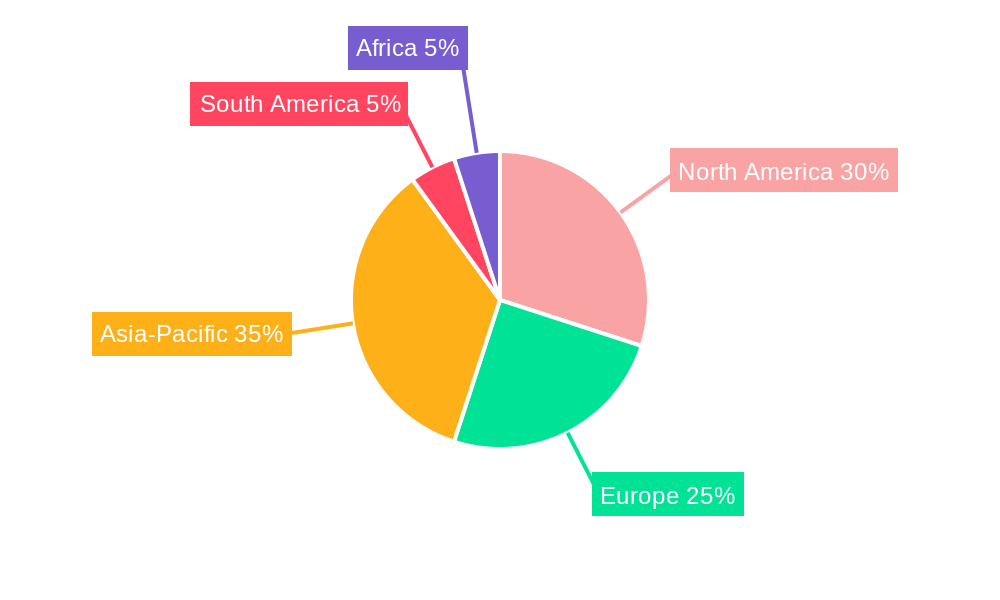
Potash Ores Market Regional Market Share
Geographic Coverage of Potash Ores Market
Potash Ores Market REPORT HIGHLIGHTS
| Aspects | Details |
|---|---|
| Study Period | 2020-2034 |
| Base Year | 2025 |
| Estimated Year | 2026 |
| Forecast Period | 2026-2034 |
| Historical Period | 2020-2025 |
| Growth Rate | CAGR of 8.9% from 2020-2034 |
| Segmentation |
|
Table of Contents
- 1. Introduction
- 1.1. Research Scope
- 1.2. Market Segmentation
- 1.3. Research Methodology
- 1.4. Definitions and Assumptions
- 2. Executive Summary
- 2.1. Introduction
- 3. Market Dynamics
- 3.1. Introduction
- 3.2. Market Drivers
- 3.2.1. Shortage of Skilled Labor; Government Support to Enhance Farm Mechanization
- 3.3. Market Restrains
- 3.3.1. Heavy Initial Procurement Cost and High Expenditure on Maintenance
- 3.4. Market Trends
- 3.4.1. MoP is the largest segment by Product.
- 4. Market Factor Analysis
- 4.1. Porters Five Forces
- 4.2. Supply/Value Chain
- 4.3. PESTEL analysis
- 4.4. Market Entropy
- 4.5. Patent/Trademark Analysis
- 5. Global Potash Ores Market Analysis, Insights and Forecast, 2020-2032
- 5.1. Market Analysis, Insights and Forecast - by Production Analysis
- 5.2. Market Analysis, Insights and Forecast - by Consumption Analysis
- 5.3. Market Analysis, Insights and Forecast - by Import Market Analysis (Value & Volume)
- 5.4. Market Analysis, Insights and Forecast - by Export Market Analysis (Value & Volume)
- 5.5. Market Analysis, Insights and Forecast - by Price Trend Analysis
- 5.6. Market Analysis, Insights and Forecast - by Region
- 5.6.1. North America
- 5.6.2. South America
- 5.6.3. Europe
- 5.6.4. Middle East & Africa
- 5.6.5. Asia Pacific
- 5.1. Market Analysis, Insights and Forecast - by Production Analysis
- 6. North America Potash Ores Market Analysis, Insights and Forecast, 2020-2032
- 6.1. Market Analysis, Insights and Forecast - by Production Analysis
- 6.2. Market Analysis, Insights and Forecast - by Consumption Analysis
- 6.3. Market Analysis, Insights and Forecast - by Import Market Analysis (Value & Volume)
- 6.4. Market Analysis, Insights and Forecast - by Export Market Analysis (Value & Volume)
- 6.5. Market Analysis, Insights and Forecast - by Price Trend Analysis
- 6.1. Market Analysis, Insights and Forecast - by Production Analysis
- 7. South America Potash Ores Market Analysis, Insights and Forecast, 2020-2032
- 7.1. Market Analysis, Insights and Forecast - by Production Analysis
- 7.2. Market Analysis, Insights and Forecast - by Consumption Analysis
- 7.3. Market Analysis, Insights and Forecast - by Import Market Analysis (Value & Volume)
- 7.4. Market Analysis, Insights and Forecast - by Export Market Analysis (Value & Volume)
- 7.5. Market Analysis, Insights and Forecast - by Price Trend Analysis
- 7.1. Market Analysis, Insights and Forecast - by Production Analysis
- 8. Europe Potash Ores Market Analysis, Insights and Forecast, 2020-2032
- 8.1. Market Analysis, Insights and Forecast - by Production Analysis
- 8.2. Market Analysis, Insights and Forecast - by Consumption Analysis
- 8.3. Market Analysis, Insights and Forecast - by Import Market Analysis (Value & Volume)
- 8.4. Market Analysis, Insights and Forecast - by Export Market Analysis (Value & Volume)
- 8.5. Market Analysis, Insights and Forecast - by Price Trend Analysis
- 8.1. Market Analysis, Insights and Forecast - by Production Analysis
- 9. Middle East & Africa Potash Ores Market Analysis, Insights and Forecast, 2020-2032
- 9.1. Market Analysis, Insights and Forecast - by Production Analysis
- 9.2. Market Analysis, Insights and Forecast - by Consumption Analysis
- 9.3. Market Analysis, Insights and Forecast - by Import Market Analysis (Value & Volume)
- 9.4. Market Analysis, Insights and Forecast - by Export Market Analysis (Value & Volume)
- 9.5. Market Analysis, Insights and Forecast - by Price Trend Analysis
- 9.1. Market Analysis, Insights and Forecast - by Production Analysis
- 10. Asia Pacific Potash Ores Market Analysis, Insights and Forecast, 2020-2032
- 10.1. Market Analysis, Insights and Forecast - by Production Analysis
- 10.2. Market Analysis, Insights and Forecast - by Consumption Analysis
- 10.3. Market Analysis, Insights and Forecast - by Import Market Analysis (Value & Volume)
- 10.4. Market Analysis, Insights and Forecast - by Export Market Analysis (Value & Volume)
- 10.5. Market Analysis, Insights and Forecast - by Price Trend Analysis
- 10.1. Market Analysis, Insights and Forecast - by Production Analysis
- 11. Competitive Analysis
- 11.1. Global Market Share Analysis 2025
- 11.2. Company Profiles
- 11.2.1 The Mosaic Co
- 11.2.1.1. Overview
- 11.2.1.2. Products
- 11.2.1.3. SWOT Analysis
- 11.2.1.4. Recent Developments
- 11.2.1.5. Financials (Based on Availability)
- 11.2.2 Coromandel International Ltd
- 11.2.2.1. Overview
- 11.2.2.2. Products
- 11.2.2.3. SWOT Analysis
- 11.2.2.4. Recent Developments
- 11.2.2.5. Financials (Based on Availability)
- 11.2.3 Nutrien Limited
- 11.2.3.1. Overview
- 11.2.3.2. Products
- 11.2.3.3. SWOT Analysis
- 11.2.3.4. Recent Developments
- 11.2.3.5. Financials (Based on Availability)
- 11.2.4 Sociedad Química y Minera (SQM)
- 11.2.4.1. Overview
- 11.2.4.2. Products
- 11.2.4.3. SWOT Analysis
- 11.2.4.4. Recent Developments
- 11.2.4.5. Financials (Based on Availability)
- 11.2.5 Petrokemija DD Fertilizer Factory
- 11.2.5.1. Overview
- 11.2.5.2. Products
- 11.2.5.3. SWOT Analysis
- 11.2.5.4. Recent Developments
- 11.2.5.5. Financials (Based on Availability)
- 11.2.6 Sinofert Holdings Ltd
- 11.2.6.1. Overview
- 11.2.6.2. Products
- 11.2.6.3. SWOT Analysis
- 11.2.6.4. Recent Developments
- 11.2.6.5. Financials (Based on Availability)
- 11.2.7 Eurochem
- 11.2.7.1. Overview
- 11.2.7.2. Products
- 11.2.7.3. SWOT Analysis
- 11.2.7.4. Recent Developments
- 11.2.7.5. Financials (Based on Availability)
- 11.2.8 Intrepid Potash Inc
- 11.2.8.1. Overview
- 11.2.8.2. Products
- 11.2.8.3. SWOT Analysis
- 11.2.8.4. Recent Developments
- 11.2.8.5. Financials (Based on Availability)
- 11.2.9 K+S AKTIENGESELLSCHAFT
- 11.2.9.1. Overview
- 11.2.9.2. Products
- 11.2.9.3. SWOT Analysis
- 11.2.9.4. Recent Developments
- 11.2.9.5. Financials (Based on Availability)
- 11.2.1 The Mosaic Co
List of Figures
- Figure 1: Global Potash Ores Market Revenue Breakdown (billion, %) by Region 2025 & 2033
- Figure 2: North America Potash Ores Market Revenue (billion), by Production Analysis 2025 & 2033
- Figure 3: North America Potash Ores Market Revenue Share (%), by Production Analysis 2025 & 2033
- Figure 4: North America Potash Ores Market Revenue (billion), by Consumption Analysis 2025 & 2033
- Figure 5: North America Potash Ores Market Revenue Share (%), by Consumption Analysis 2025 & 2033
- Figure 6: North America Potash Ores Market Revenue (billion), by Import Market Analysis (Value & Volume) 2025 & 2033
- Figure 7: North America Potash Ores Market Revenue Share (%), by Import Market Analysis (Value & Volume) 2025 & 2033
- Figure 8: North America Potash Ores Market Revenue (billion), by Export Market Analysis (Value & Volume) 2025 & 2033
- Figure 9: North America Potash Ores Market Revenue Share (%), by Export Market Analysis (Value & Volume) 2025 & 2033
- Figure 10: North America Potash Ores Market Revenue (billion), by Price Trend Analysis 2025 & 2033
- Figure 11: North America Potash Ores Market Revenue Share (%), by Price Trend Analysis 2025 & 2033
- Figure 12: North America Potash Ores Market Revenue (billion), by Country 2025 & 2033
- Figure 13: North America Potash Ores Market Revenue Share (%), by Country 2025 & 2033
- Figure 14: South America Potash Ores Market Revenue (billion), by Production Analysis 2025 & 2033
- Figure 15: South America Potash Ores Market Revenue Share (%), by Production Analysis 2025 & 2033
- Figure 16: South America Potash Ores Market Revenue (billion), by Consumption Analysis 2025 & 2033
- Figure 17: South America Potash Ores Market Revenue Share (%), by Consumption Analysis 2025 & 2033
- Figure 18: South America Potash Ores Market Revenue (billion), by Import Market Analysis (Value & Volume) 2025 & 2033
- Figure 19: South America Potash Ores Market Revenue Share (%), by Import Market Analysis (Value & Volume) 2025 & 2033
- Figure 20: South America Potash Ores Market Revenue (billion), by Export Market Analysis (Value & Volume) 2025 & 2033
- Figure 21: South America Potash Ores Market Revenue Share (%), by Export Market Analysis (Value & Volume) 2025 & 2033
- Figure 22: South America Potash Ores Market Revenue (billion), by Price Trend Analysis 2025 & 2033
- Figure 23: South America Potash Ores Market Revenue Share (%), by Price Trend Analysis 2025 & 2033
- Figure 24: South America Potash Ores Market Revenue (billion), by Country 2025 & 2033
- Figure 25: South America Potash Ores Market Revenue Share (%), by Country 2025 & 2033
- Figure 26: Europe Potash Ores Market Revenue (billion), by Production Analysis 2025 & 2033
- Figure 27: Europe Potash Ores Market Revenue Share (%), by Production Analysis 2025 & 2033
- Figure 28: Europe Potash Ores Market Revenue (billion), by Consumption Analysis 2025 & 2033
- Figure 29: Europe Potash Ores Market Revenue Share (%), by Consumption Analysis 2025 & 2033
- Figure 30: Europe Potash Ores Market Revenue (billion), by Import Market Analysis (Value & Volume) 2025 & 2033
- Figure 31: Europe Potash Ores Market Revenue Share (%), by Import Market Analysis (Value & Volume) 2025 & 2033
- Figure 32: Europe Potash Ores Market Revenue (billion), by Export Market Analysis (Value & Volume) 2025 & 2033
- Figure 33: Europe Potash Ores Market Revenue Share (%), by Export Market Analysis (Value & Volume) 2025 & 2033
- Figure 34: Europe Potash Ores Market Revenue (billion), by Price Trend Analysis 2025 & 2033
- Figure 35: Europe Potash Ores Market Revenue Share (%), by Price Trend Analysis 2025 & 2033
- Figure 36: Europe Potash Ores Market Revenue (billion), by Country 2025 & 2033
- Figure 37: Europe Potash Ores Market Revenue Share (%), by Country 2025 & 2033
- Figure 38: Middle East & Africa Potash Ores Market Revenue (billion), by Production Analysis 2025 & 2033
- Figure 39: Middle East & Africa Potash Ores Market Revenue Share (%), by Production Analysis 2025 & 2033
- Figure 40: Middle East & Africa Potash Ores Market Revenue (billion), by Consumption Analysis 2025 & 2033
- Figure 41: Middle East & Africa Potash Ores Market Revenue Share (%), by Consumption Analysis 2025 & 2033
- Figure 42: Middle East & Africa Potash Ores Market Revenue (billion), by Import Market Analysis (Value & Volume) 2025 & 2033
- Figure 43: Middle East & Africa Potash Ores Market Revenue Share (%), by Import Market Analysis (Value & Volume) 2025 & 2033
- Figure 44: Middle East & Africa Potash Ores Market Revenue (billion), by Export Market Analysis (Value & Volume) 2025 & 2033
- Figure 45: Middle East & Africa Potash Ores Market Revenue Share (%), by Export Market Analysis (Value & Volume) 2025 & 2033
- Figure 46: Middle East & Africa Potash Ores Market Revenue (billion), by Price Trend Analysis 2025 & 2033
- Figure 47: Middle East & Africa Potash Ores Market Revenue Share (%), by Price Trend Analysis 2025 & 2033
- Figure 48: Middle East & Africa Potash Ores Market Revenue (billion), by Country 2025 & 2033
- Figure 49: Middle East & Africa Potash Ores Market Revenue Share (%), by Country 2025 & 2033
- Figure 50: Asia Pacific Potash Ores Market Revenue (billion), by Production Analysis 2025 & 2033
- Figure 51: Asia Pacific Potash Ores Market Revenue Share (%), by Production Analysis 2025 & 2033
- Figure 52: Asia Pacific Potash Ores Market Revenue (billion), by Consumption Analysis 2025 & 2033
- Figure 53: Asia Pacific Potash Ores Market Revenue Share (%), by Consumption Analysis 2025 & 2033
- Figure 54: Asia Pacific Potash Ores Market Revenue (billion), by Import Market Analysis (Value & Volume) 2025 & 2033
- Figure 55: Asia Pacific Potash Ores Market Revenue Share (%), by Import Market Analysis (Value & Volume) 2025 & 2033
- Figure 56: Asia Pacific Potash Ores Market Revenue (billion), by Export Market Analysis (Value & Volume) 2025 & 2033
- Figure 57: Asia Pacific Potash Ores Market Revenue Share (%), by Export Market Analysis (Value & Volume) 2025 & 2033
- Figure 58: Asia Pacific Potash Ores Market Revenue (billion), by Price Trend Analysis 2025 & 2033
- Figure 59: Asia Pacific Potash Ores Market Revenue Share (%), by Price Trend Analysis 2025 & 2033
- Figure 60: Asia Pacific Potash Ores Market Revenue (billion), by Country 2025 & 2033
- Figure 61: Asia Pacific Potash Ores Market Revenue Share (%), by Country 2025 & 2033
List of Tables
- Table 1: Global Potash Ores Market Revenue billion Forecast, by Production Analysis 2020 & 2033
- Table 2: Global Potash Ores Market Revenue billion Forecast, by Consumption Analysis 2020 & 2033
- Table 3: Global Potash Ores Market Revenue billion Forecast, by Import Market Analysis (Value & Volume) 2020 & 2033
- Table 4: Global Potash Ores Market Revenue billion Forecast, by Export Market Analysis (Value & Volume) 2020 & 2033
- Table 5: Global Potash Ores Market Revenue billion Forecast, by Price Trend Analysis 2020 & 2033
- Table 6: Global Potash Ores Market Revenue billion Forecast, by Region 2020 & 2033
- Table 7: Global Potash Ores Market Revenue billion Forecast, by Production Analysis 2020 & 2033
- Table 8: Global Potash Ores Market Revenue billion Forecast, by Consumption Analysis 2020 & 2033
- Table 9: Global Potash Ores Market Revenue billion Forecast, by Import Market Analysis (Value & Volume) 2020 & 2033
- Table 10: Global Potash Ores Market Revenue billion Forecast, by Export Market Analysis (Value & Volume) 2020 & 2033
- Table 11: Global Potash Ores Market Revenue billion Forecast, by Price Trend Analysis 2020 & 2033
- Table 12: Global Potash Ores Market Revenue billion Forecast, by Country 2020 & 2033
- Table 13: United States Potash Ores Market Revenue (billion) Forecast, by Application 2020 & 2033
- Table 14: Canada Potash Ores Market Revenue (billion) Forecast, by Application 2020 & 2033
- Table 15: Mexico Potash Ores Market Revenue (billion) Forecast, by Application 2020 & 2033
- Table 16: Global Potash Ores Market Revenue billion Forecast, by Production Analysis 2020 & 2033
- Table 17: Global Potash Ores Market Revenue billion Forecast, by Consumption Analysis 2020 & 2033
- Table 18: Global Potash Ores Market Revenue billion Forecast, by Import Market Analysis (Value & Volume) 2020 & 2033
- Table 19: Global Potash Ores Market Revenue billion Forecast, by Export Market Analysis (Value & Volume) 2020 & 2033
- Table 20: Global Potash Ores Market Revenue billion Forecast, by Price Trend Analysis 2020 & 2033
- Table 21: Global Potash Ores Market Revenue billion Forecast, by Country 2020 & 2033
- Table 22: Brazil Potash Ores Market Revenue (billion) Forecast, by Application 2020 & 2033
- Table 23: Argentina Potash Ores Market Revenue (billion) Forecast, by Application 2020 & 2033
- Table 24: Rest of South America Potash Ores Market Revenue (billion) Forecast, by Application 2020 & 2033
- Table 25: Global Potash Ores Market Revenue billion Forecast, by Production Analysis 2020 & 2033
- Table 26: Global Potash Ores Market Revenue billion Forecast, by Consumption Analysis 2020 & 2033
- Table 27: Global Potash Ores Market Revenue billion Forecast, by Import Market Analysis (Value & Volume) 2020 & 2033
- Table 28: Global Potash Ores Market Revenue billion Forecast, by Export Market Analysis (Value & Volume) 2020 & 2033
- Table 29: Global Potash Ores Market Revenue billion Forecast, by Price Trend Analysis 2020 & 2033
- Table 30: Global Potash Ores Market Revenue billion Forecast, by Country 2020 & 2033
- Table 31: United Kingdom Potash Ores Market Revenue (billion) Forecast, by Application 2020 & 2033
- Table 32: Germany Potash Ores Market Revenue (billion) Forecast, by Application 2020 & 2033
- Table 33: France Potash Ores Market Revenue (billion) Forecast, by Application 2020 & 2033
- Table 34: Italy Potash Ores Market Revenue (billion) Forecast, by Application 2020 & 2033
- Table 35: Spain Potash Ores Market Revenue (billion) Forecast, by Application 2020 & 2033
- Table 36: Russia Potash Ores Market Revenue (billion) Forecast, by Application 2020 & 2033
- Table 37: Benelux Potash Ores Market Revenue (billion) Forecast, by Application 2020 & 2033
- Table 38: Nordics Potash Ores Market Revenue (billion) Forecast, by Application 2020 & 2033
- Table 39: Rest of Europe Potash Ores Market Revenue (billion) Forecast, by Application 2020 & 2033
- Table 40: Global Potash Ores Market Revenue billion Forecast, by Production Analysis 2020 & 2033
- Table 41: Global Potash Ores Market Revenue billion Forecast, by Consumption Analysis 2020 & 2033
- Table 42: Global Potash Ores Market Revenue billion Forecast, by Import Market Analysis (Value & Volume) 2020 & 2033
- Table 43: Global Potash Ores Market Revenue billion Forecast, by Export Market Analysis (Value & Volume) 2020 & 2033
- Table 44: Global Potash Ores Market Revenue billion Forecast, by Price Trend Analysis 2020 & 2033
- Table 45: Global Potash Ores Market Revenue billion Forecast, by Country 2020 & 2033
- Table 46: Turkey Potash Ores Market Revenue (billion) Forecast, by Application 2020 & 2033
- Table 47: Israel Potash Ores Market Revenue (billion) Forecast, by Application 2020 & 2033
- Table 48: GCC Potash Ores Market Revenue (billion) Forecast, by Application 2020 & 2033
- Table 49: North Africa Potash Ores Market Revenue (billion) Forecast, by Application 2020 & 2033
- Table 50: South Africa Potash Ores Market Revenue (billion) Forecast, by Application 2020 & 2033
- Table 51: Rest of Middle East & Africa Potash Ores Market Revenue (billion) Forecast, by Application 2020 & 2033
- Table 52: Global Potash Ores Market Revenue billion Forecast, by Production Analysis 2020 & 2033
- Table 53: Global Potash Ores Market Revenue billion Forecast, by Consumption Analysis 2020 & 2033
- Table 54: Global Potash Ores Market Revenue billion Forecast, by Import Market Analysis (Value & Volume) 2020 & 2033
- Table 55: Global Potash Ores Market Revenue billion Forecast, by Export Market Analysis (Value & Volume) 2020 & 2033
- Table 56: Global Potash Ores Market Revenue billion Forecast, by Price Trend Analysis 2020 & 2033
- Table 57: Global Potash Ores Market Revenue billion Forecast, by Country 2020 & 2033
- Table 58: China Potash Ores Market Revenue (billion) Forecast, by Application 2020 & 2033
- Table 59: India Potash Ores Market Revenue (billion) Forecast, by Application 2020 & 2033
- Table 60: Japan Potash Ores Market Revenue (billion) Forecast, by Application 2020 & 2033
- Table 61: South Korea Potash Ores Market Revenue (billion) Forecast, by Application 2020 & 2033
- Table 62: ASEAN Potash Ores Market Revenue (billion) Forecast, by Application 2020 & 2033
- Table 63: Oceania Potash Ores Market Revenue (billion) Forecast, by Application 2020 & 2033
- Table 64: Rest of Asia Pacific Potash Ores Market Revenue (billion) Forecast, by Application 2020 & 2033
Frequently Asked Questions
1. What is the projected Compound Annual Growth Rate (CAGR) of the Potash Ores Market?
The projected CAGR is approximately 8.9%.
2. Which companies are prominent players in the Potash Ores Market?
Key companies in the market include The Mosaic Co, Coromandel International Ltd, Nutrien Limited, Sociedad Química y Minera (SQM), Petrokemija DD Fertilizer Factory, Sinofert Holdings Ltd, Eurochem, Intrepid Potash Inc, K+S AKTIENGESELLSCHAFT.
3. What are the main segments of the Potash Ores Market?
The market segments include Production Analysis, Consumption Analysis, Import Market Analysis (Value & Volume), Export Market Analysis (Value & Volume), Price Trend Analysis.
4. Can you provide details about the market size?
The market size is estimated to be USD 66.11 billion as of 2022.
5. What are some drivers contributing to market growth?
Shortage of Skilled Labor; Government Support to Enhance Farm Mechanization.
6. What are the notable trends driving market growth?
MoP is the largest segment by Product..
7. Are there any restraints impacting market growth?
Heavy Initial Procurement Cost and High Expenditure on Maintenance.
8. Can you provide examples of recent developments in the market?
March 2022: EuroChem Group announced that it has completed the purchase of the share holding control of Brazilian distributor Fertilizantes Heringer SA, with 51.48% of the shares, further strengthening its production and distribution capacity in Brazil.March 2021: Mosaic announced a partnership with Sound Agriculture to develop and distribute a nutrient efficiency product. Sound Agriculture will focus on manufacturing of the active ingredient and product formulation, while Mosaic will oversee field development, regulatory, sales and marketing efforts. The product leverage Sound Agrculture Bio-inspired chemistry that activates the soil microbiome to give plants access to important nutrients and allow growers to optimize fertilizer inputs.It is expected to release in 2023 for US market.February 2019: Nutrien Ltd. acquired Van Horn, Inc. (Van Horn), a leading US retailer and agricultural services provider which serve over 5,000 customers in 18 counties to grow their Retail business.
9. What pricing options are available for accessing the report?
Pricing options include single-user, multi-user, and enterprise licenses priced at USD 3800, USD 4500, and USD 5800 respectively.
10. Is the market size provided in terms of value or volume?
The market size is provided in terms of value, measured in billion.
11. Are there any specific market keywords associated with the report?
Yes, the market keyword associated with the report is "Potash Ores Market," which aids in identifying and referencing the specific market segment covered.
12. How do I determine which pricing option suits my needs best?
The pricing options vary based on user requirements and access needs. Individual users may opt for single-user licenses, while businesses requiring broader access may choose multi-user or enterprise licenses for cost-effective access to the report.
13. Are there any additional resources or data provided in the Potash Ores Market report?
While the report offers comprehensive insights, it's advisable to review the specific contents or supplementary materials provided to ascertain if additional resources or data are available.
14. How can I stay updated on further developments or reports in the Potash Ores Market?
To stay informed about further developments, trends, and reports in the Potash Ores Market, consider subscribing to industry newsletters, following relevant companies and organizations, or regularly checking reputable industry news sources and publications.
Methodology
Step 1 - Identification of Relevant Samples Size from Population Database


Step 2 - Approaches for Defining Global Market Size (Value, Volume* & Price*)

Note*: In applicable scenarios
Step 3 - Data Sources
Primary Research
- Web Analytics
- Survey Reports
- Research Institute
- Latest Research Reports
- Opinion Leaders
Secondary Research
- Annual Reports
- White Paper
- Latest Press Release
- Industry Association
- Paid Database
- Investor Presentations

Step 4 - Data Triangulation
Involves using different sources of information in order to increase the validity of a study
These sources are likely to be stakeholders in a program - participants, other researchers, program staff, other community members, and so on.
Then we put all data in single framework & apply various statistical tools to find out the dynamic on the market.
During the analysis stage, feedback from the stakeholder groups would be compared to determine areas of agreement as well as areas of divergence