

Key Insights
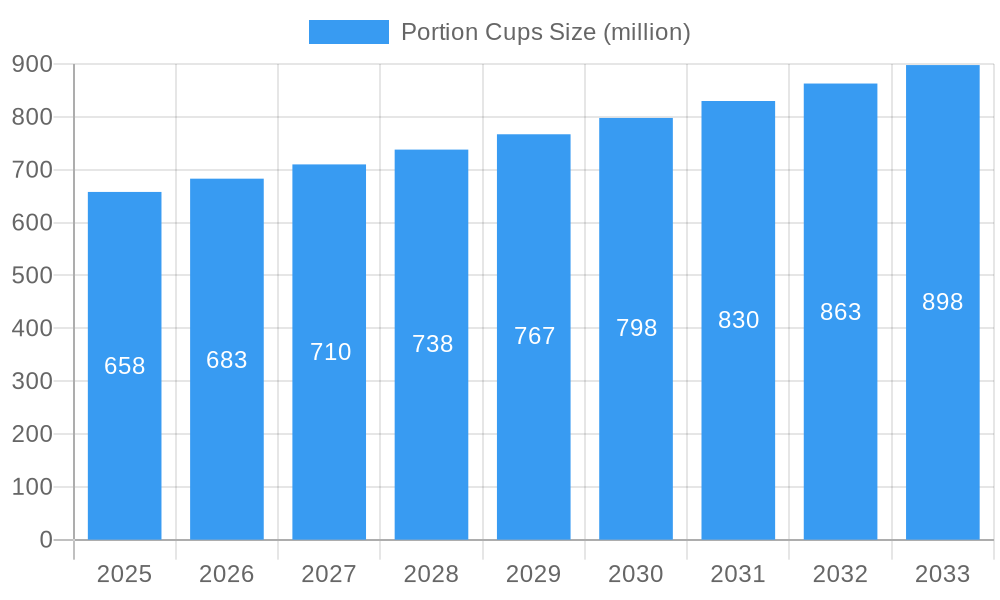
The global portion cups market is poised for steady expansion, with a projected market size of $658 million. This growth is underpinned by a Compound Annual Growth Rate (CAGR) of 3.9% from 2019 to 2033, indicating sustained demand for these convenient, single-serving containers. The primary drivers for this market growth include the escalating demand from the food services sector, driven by the proliferation of fast-food chains, cafes, and catering businesses, all of which rely heavily on portion cups for dressings, sauces, dips, and condiments. Furthermore, the increasing adoption of on-the-go food consumption and the convenience factor associated with portion cups in households for snacks and small food items are contributing significantly to market expansion. The market is segmented by type, with plastic portion cups holding a dominant share due to their cost-effectiveness and durability. However, a notable trend is the burgeoning demand for sustainable alternatives, with renewable and compostable sugarcane-based portion cups gaining traction as environmental consciousness rises among consumers and businesses.
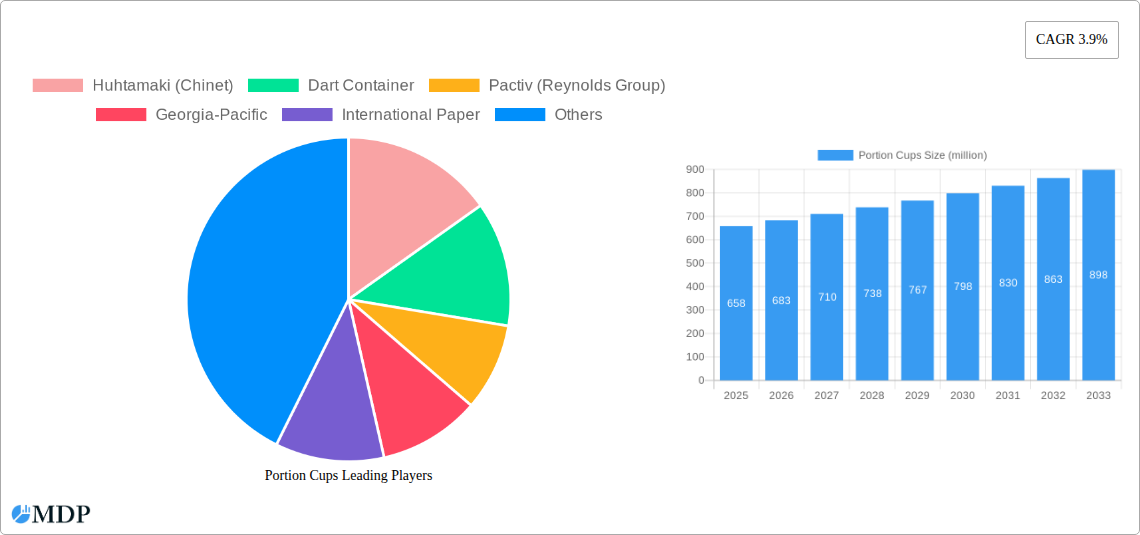
Portion Cups Market Size (In Million)
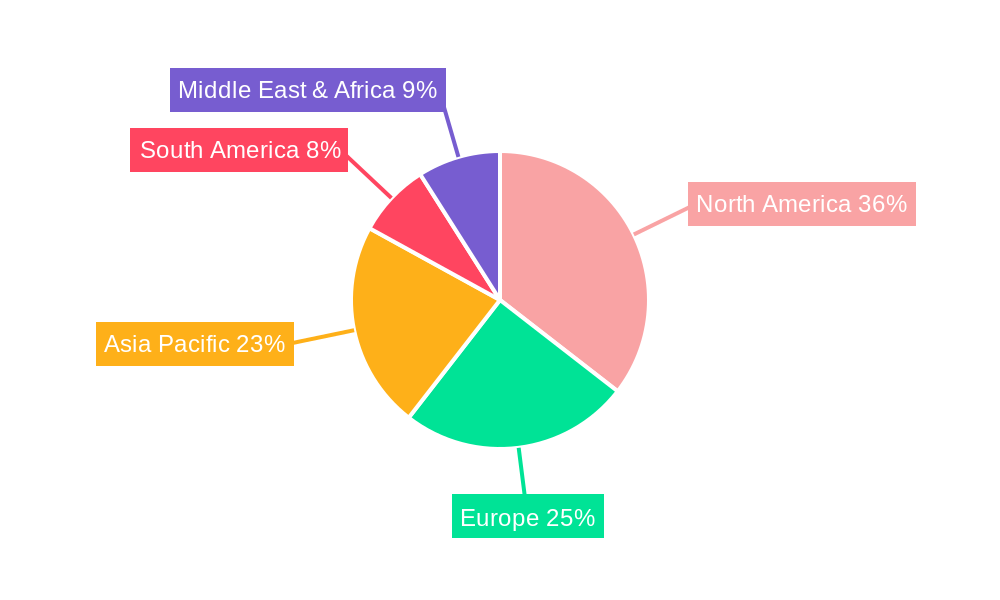
The market also presents opportunities driven by the expanding institutional segment, encompassing healthcare facilities, educational institutions, and corporate offices, where pre-portioned servings are essential for hygiene and portion control. While plastic remains a significant material, the increasing regulatory scrutiny on single-use plastics and a growing consumer preference for eco-friendly packaging are expected to shape future market dynamics. Companies are actively investing in research and development to offer innovative and sustainable portion cup solutions. Geographically, North America, particularly the United States, is expected to remain a leading market due to its established food service infrastructure and high consumer spending on convenience food. Asia Pacific, with its rapidly growing economies and expanding middle class, presents a substantial growth opportunity, fueled by the rise of organized retail and food delivery services. Restraints such as fluctuating raw material prices and stringent environmental regulations could pose challenges, but the overall outlook for the portion cups market remains positive, driven by convenience, evolving consumer preferences, and the expanding food service industry.
Portion Cups Company Market Share
This report offers a comprehensive analysis of the global Portion Cups market, providing actionable insights for industry stakeholders. The study covers the historical period from 2019 to 2024, with the base year set at 2025 and a robust forecast period extending from 2025 to 2033.
Portion Cups Market Dynamics & Concentration
The global portion cups market exhibits moderate concentration, with key players vying for significant market share. Major companies like Huhtamaki (Chinet), Dart Container, and Pactiv (Reynolds Group) collectively hold a substantial portion of the market. Innovation drivers are primarily centered around sustainability, convenience, and cost-effectiveness. Growing environmental consciousness has led to an increased demand for biodegradable and compostable portion cups, pushing manufacturers to invest in research and development for novel materials. Regulatory frameworks, particularly concerning single-use plastics, are influencing product development and adoption rates. Concerns over plastic waste have spurred stricter regulations in several regions, prompting a shift towards paper-based and plant-based alternatives. Product substitutes, such as bulk dispensers and reusable containers, pose a moderate threat, especially in institutional and food service settings seeking to reduce waste and costs. End-user trends are characterized by a growing preference for single-serving packaging for on-the-go consumption, catering to busy lifestyles and the booming food delivery sector. Mergers and acquisition (M&A) activities in the portion cups industry are relatively active, indicating consolidation efforts and strategic expansions among leading players. Recent M&A deal counts stand at approximately 25 across the historical period, aimed at expanding product portfolios and geographical reach.
Portion Cups Industry Trends & Analysis
The portion cups industry is poised for significant growth, driven by a confluence of factors including an escalating demand from the food services sector and a rising consumer preference for convenience. The global portion cups market size is projected to reach approximately $12,500 million by 2033, exhibiting a Compound Annual Growth Rate (CAGR) of around 4.8% from 2025. Market penetration in emerging economies is steadily increasing, fueled by urbanization and a growing middle class with disposable income, leading to higher consumption of convenient food and beverage options. Technological disruptions are playing a pivotal role, with advancements in material science leading to the development of more sustainable and cost-effective portion cup solutions. The introduction of compostable and biodegradable materials, derived from sugarcane and other renewable resources, is a key trend addressing environmental concerns associated with traditional plastic portion cups. Consumer preferences are evolving rapidly, with a strong emphasis on eco-friendly packaging. This shift is compelling manufacturers to innovate and offer a wider range of sustainable alternatives. The competitive dynamics within the industry are intensifying, with both established players and emerging companies vying for market share. Companies are differentiating themselves through product innovation, supply chain efficiency, and strategic partnerships. The increasing adoption of portion cups in food delivery services, driven by the pandemic and subsequent shifts in consumer habits, has been a major growth catalyst. Furthermore, the demand for personalized and single-serving options in various food and beverage applications, including condiments, sauces, dressings, and dairy products, continues to fuel market expansion.
Leading Markets & Segments in Portion Cups
The Food Services segment is the dominant force in the global portion cups market, representing an estimated 65% of the total market value. Within this segment, the Plastic Portion Cups sub-segment commands the largest market share, accounting for approximately 55% of the overall market due to their cost-effectiveness, durability, and versatility. However, the Renewable & Compostable Sugarcane segment is experiencing the fastest growth, driven by increasing environmental regulations and consumer demand for sustainable packaging solutions.
- Dominant Region: North America currently leads the portion cups market, driven by a well-established food service infrastructure, high disposable incomes, and a significant demand for convenience food products. The United States, in particular, contributes substantially to this dominance.
- Key Drivers in Food Services:
- Ubiquitous Use: Portion cups are indispensable for condiments, sauces, dressings, dips, and single-serving desserts in restaurants, cafes, fast-food chains, and catering services.
- Food Safety & Hygiene: Pre-portioned servings minimize contamination risks and ensure consistent product delivery, crucial for high-volume operations.
- Delivery & Takeout Boom: The surge in food delivery and takeout services has amplified the need for individual, spill-proof packaging solutions.
- Dominance of Plastic Portion Cups:
- Cost-Effectiveness: Plastic offers a favorable price point for mass production, making it an economical choice for food service providers.
- Performance: Plastic provides excellent barrier properties, preventing leakage and preserving the freshness of contents.
- Variety: A wide range of sizes, shapes, and lid options are available in plastic to suit diverse applications.
- Emerging Trend: Renewable & Compostable Sugarcane:
- Environmental Regulations: Stricter policies on single-use plastics are pushing businesses towards eco-friendly alternatives.
- Corporate Sustainability Goals: Many food service companies are actively seeking to reduce their environmental footprint.
- Consumer Demand: A growing segment of consumers actively chooses businesses with sustainable packaging practices.
- Other Significant Segments:
- Institutional: Schools, hospitals, and corporate cafeterias utilize portion cups for hygiene and portion control.
- Households: While a smaller segment, household use is growing with the popularity of meal kits and individual snack servings.
- Paper Portion Cups: Gaining traction as a more environmentally friendly alternative to plastic, especially for hot beverages and certain food items.
- Aluminum Foil Portion Cups: Primarily used for baked goods and specific culinary applications requiring high-temperature resistance.
Portion Cups Product Developments
Recent product developments in the portion cups market are heavily influenced by sustainability and enhanced functionality. Manufacturers are investing in biodegradable and compostable materials like sugarcane, PLA, and recycled paperboard, offering consumers eco-friendlier alternatives to traditional plastic. Innovations also include improved lid designs for better sealing and leak prevention, as well as tamper-evident features for enhanced food safety. The introduction of smaller, specialized portion cups for single-use condiments and toppings in food delivery services is another key development. These advancements aim to meet evolving consumer preferences for convenience and environmental responsibility, while also providing competitive advantages through superior performance and market fit.
Key Drivers of Portion Cups Growth
The global portion cups market is propelled by several key drivers. The booming food services industry, encompassing restaurants, cafes, and catering, significantly boosts demand for convenient and hygienic single-serving packaging. The surge in food delivery and takeout services has created an unprecedented need for durable and leak-proof portion cups. Furthermore, increasing consumer awareness regarding sustainability and environmental impact is a major catalyst, driving the adoption of biodegradable and compostable alternatives. Government regulations promoting eco-friendly packaging solutions also play a crucial role in shaping market growth. Technological advancements in material science are enabling the production of more cost-effective and environmentally friendly portion cups.
Challenges in the Portion Cups Market
Despite robust growth, the portion cups market faces several challenges. Increasing regulatory scrutiny and bans on single-use plastics in various regions pose a significant restraint, necessitating a rapid shift to alternative materials which can sometimes be more expensive. Fluctuations in raw material prices, particularly for petroleum-based plastics and renewable resources, can impact manufacturing costs and profitability. Intense competition from both established players and new entrants, often leading to price wars, can squeeze profit margins. Additionally, consumer perception and the availability of affordable and practical substitutes can influence market penetration, especially in price-sensitive segments.
Emerging Opportunities in Portion Cups
Emerging opportunities in the portion cups market are primarily driven by innovation and market expansion. The increasing global focus on sustainability and circular economy principles presents a significant opportunity for companies developing and marketing compostable, biodegradable, and recyclable portion cups. Strategic partnerships with food delivery platforms and QSR chains can unlock new distribution channels and increase market reach. Expansion into developing economies, where convenience food consumption is on the rise, offers substantial untapped potential. Furthermore, technological breakthroughs in material science could lead to the development of novel, high-performance, and cost-effective portion cup solutions that address current market limitations and open up new application areas.
Leading Players in the Portion Cups Sector
- Huhtamaki (Chinet)
- Dart Container
- Pactiv (Reynolds Group)
- Georgia-Pacific
- International Paper
- The Waddington Group
- Lollicup USA
- Berry Global
- Sonoco Products
- Genpak LLC
- D&W Fine Pack
- Amhil North America
- Fabri-Kal Corporation
- Polar Pak Company
Key Milestones in Portion Cups Industry
- 2019: Increased regulatory pressure on single-use plastics in Europe, leading to accelerated R&D for alternatives.
- 2020: Surge in food delivery services due to the global pandemic, significantly boosting demand for portion cups.
- 2021: Launch of several new compostable sugarcane-based portion cups by key manufacturers.
- 2022: Major players announce ambitious sustainability targets, including increased use of recycled content.
- 2023: Strategic acquisitions aimed at consolidating market share and expanding product portfolios in the portion cups sector.
- 2024: Growing adoption of portion cups in meal kit services and for individual snack packaging.
Strategic Outlook for Portion Cups Market
The strategic outlook for the portion cups market is characterized by a strong emphasis on sustainability, innovation, and market expansion. Growth accelerators will be driven by the increasing demand for eco-friendly packaging solutions, particularly compostable and biodegradable options, aligning with global environmental initiatives and stricter regulations. Companies that invest in advanced material science and efficient manufacturing processes for sustainable alternatives will gain a competitive edge. Strategic partnerships with food service providers and food delivery platforms are crucial for expanding market reach and capitalizing on evolving consumer habits. Furthermore, exploring untapped potential in emerging economies by offering cost-effective and convenient portion cup solutions will be a key growth strategy for the future.
Portion Cups Segmentation
-
1. Application
- 1.1. Food Services
- 1.2. Households
- 1.3. Institutional
-
2. Types
- 2.1. Plastic Portion Cups
- 2.2. Paper Portion Cups
- 2.3. Aluminum Foil Portion Cups
- 2.4. Renewable & Compostable Sugarcane
- 2.5. Others
Portion Cups Segmentation By Geography
-
1. North America
- 1.1. United States
- 1.2. Canada
- 1.3. Mexico
-
2. South America
- 2.1. Brazil
- 2.2. Argentina
- 2.3. Rest of South America
-
3. Europe
- 3.1. United Kingdom
- 3.2. Germany
- 3.3. France
- 3.4. Italy
- 3.5. Spain
- 3.6. Russia
- 3.7. Benelux
- 3.8. Nordics
- 3.9. Rest of Europe
-
4. Middle East & Africa
- 4.1. Turkey
- 4.2. Israel
- 4.3. GCC
- 4.4. North Africa
- 4.5. South Africa
- 4.6. Rest of Middle East & Africa
-
5. Asia Pacific
- 5.1. China
- 5.2. India
- 5.3. Japan
- 5.4. South Korea
- 5.5. ASEAN
- 5.6. Oceania
- 5.7. Rest of Asia Pacific
Portion Cups Regional Market Share
Geographic Coverage of Portion Cups
Portion Cups REPORT HIGHLIGHTS
| Aspects | Details |
|---|---|
| Study Period | 2020-2034 |
| Base Year | 2025 |
| Estimated Year | 2026 |
| Forecast Period | 2026-2034 |
| Historical Period | 2020-2025 |
| Growth Rate | CAGR of 3.9% from 2020-2034 |
| Segmentation |
|
Table of Contents
- 1. Introduction
- 1.1. Research Scope
- 1.2. Market Segmentation
- 1.3. Research Methodology
- 1.4. Definitions and Assumptions
- 2. Executive Summary
- 2.1. Introduction
- 3. Market Dynamics
- 3.1. Introduction
- 3.2. Market Drivers
- 3.3. Market Restrains
- 3.4. Market Trends
- 4. Market Factor Analysis
- 4.1. Porters Five Forces
- 4.2. Supply/Value Chain
- 4.3. PESTEL analysis
- 4.4. Market Entropy
- 4.5. Patent/Trademark Analysis
- 5. Global Portion Cups Analysis, Insights and Forecast, 2020-2032
- 5.1. Market Analysis, Insights and Forecast - by Application
- 5.1.1. Food Services
- 5.1.2. Households
- 5.1.3. Institutional
- 5.2. Market Analysis, Insights and Forecast - by Types
- 5.2.1. Plastic Portion Cups
- 5.2.2. Paper Portion Cups
- 5.2.3. Aluminum Foil Portion Cups
- 5.2.4. Renewable & Compostable Sugarcane
- 5.2.5. Others
- 5.3. Market Analysis, Insights and Forecast - by Region
- 5.3.1. North America
- 5.3.2. South America
- 5.3.3. Europe
- 5.3.4. Middle East & Africa
- 5.3.5. Asia Pacific
- 5.1. Market Analysis, Insights and Forecast - by Application
- 6. North America Portion Cups Analysis, Insights and Forecast, 2020-2032
- 6.1. Market Analysis, Insights and Forecast - by Application
- 6.1.1. Food Services
- 6.1.2. Households
- 6.1.3. Institutional
- 6.2. Market Analysis, Insights and Forecast - by Types
- 6.2.1. Plastic Portion Cups
- 6.2.2. Paper Portion Cups
- 6.2.3. Aluminum Foil Portion Cups
- 6.2.4. Renewable & Compostable Sugarcane
- 6.2.5. Others
- 6.1. Market Analysis, Insights and Forecast - by Application
- 7. South America Portion Cups Analysis, Insights and Forecast, 2020-2032
- 7.1. Market Analysis, Insights and Forecast - by Application
- 7.1.1. Food Services
- 7.1.2. Households
- 7.1.3. Institutional
- 7.2. Market Analysis, Insights and Forecast - by Types
- 7.2.1. Plastic Portion Cups
- 7.2.2. Paper Portion Cups
- 7.2.3. Aluminum Foil Portion Cups
- 7.2.4. Renewable & Compostable Sugarcane
- 7.2.5. Others
- 7.1. Market Analysis, Insights and Forecast - by Application
- 8. Europe Portion Cups Analysis, Insights and Forecast, 2020-2032
- 8.1. Market Analysis, Insights and Forecast - by Application
- 8.1.1. Food Services
- 8.1.2. Households
- 8.1.3. Institutional
- 8.2. Market Analysis, Insights and Forecast - by Types
- 8.2.1. Plastic Portion Cups
- 8.2.2. Paper Portion Cups
- 8.2.3. Aluminum Foil Portion Cups
- 8.2.4. Renewable & Compostable Sugarcane
- 8.2.5. Others
- 8.1. Market Analysis, Insights and Forecast - by Application
- 9. Middle East & Africa Portion Cups Analysis, Insights and Forecast, 2020-2032
- 9.1. Market Analysis, Insights and Forecast - by Application
- 9.1.1. Food Services
- 9.1.2. Households
- 9.1.3. Institutional
- 9.2. Market Analysis, Insights and Forecast - by Types
- 9.2.1. Plastic Portion Cups
- 9.2.2. Paper Portion Cups
- 9.2.3. Aluminum Foil Portion Cups
- 9.2.4. Renewable & Compostable Sugarcane
- 9.2.5. Others
- 9.1. Market Analysis, Insights and Forecast - by Application
- 10. Asia Pacific Portion Cups Analysis, Insights and Forecast, 2020-2032
- 10.1. Market Analysis, Insights and Forecast - by Application
- 10.1.1. Food Services
- 10.1.2. Households
- 10.1.3. Institutional
- 10.2. Market Analysis, Insights and Forecast - by Types
- 10.2.1. Plastic Portion Cups
- 10.2.2. Paper Portion Cups
- 10.2.3. Aluminum Foil Portion Cups
- 10.2.4. Renewable & Compostable Sugarcane
- 10.2.5. Others
- 10.1. Market Analysis, Insights and Forecast - by Application
- 11. Competitive Analysis
- 11.1. Global Market Share Analysis 2025
- 11.2. Company Profiles
- 11.2.1 Huhtamaki (Chinet)
- 11.2.1.1. Overview
- 11.2.1.2. Products
- 11.2.1.3. SWOT Analysis
- 11.2.1.4. Recent Developments
- 11.2.1.5. Financials (Based on Availability)
- 11.2.2 Dart Container
- 11.2.2.1. Overview
- 11.2.2.2. Products
- 11.2.2.3. SWOT Analysis
- 11.2.2.4. Recent Developments
- 11.2.2.5. Financials (Based on Availability)
- 11.2.3 Pactiv (Reynolds Group)
- 11.2.3.1. Overview
- 11.2.3.2. Products
- 11.2.3.3. SWOT Analysis
- 11.2.3.4. Recent Developments
- 11.2.3.5. Financials (Based on Availability)
- 11.2.4 Georgia-Pacific
- 11.2.4.1. Overview
- 11.2.4.2. Products
- 11.2.4.3. SWOT Analysis
- 11.2.4.4. Recent Developments
- 11.2.4.5. Financials (Based on Availability)
- 11.2.5 International Paper
- 11.2.5.1. Overview
- 11.2.5.2. Products
- 11.2.5.3. SWOT Analysis
- 11.2.5.4. Recent Developments
- 11.2.5.5. Financials (Based on Availability)
- 11.2.6 The Waddington Group
- 11.2.6.1. Overview
- 11.2.6.2. Products
- 11.2.6.3. SWOT Analysis
- 11.2.6.4. Recent Developments
- 11.2.6.5. Financials (Based on Availability)
- 11.2.7 Lollicup USA
- 11.2.7.1. Overview
- 11.2.7.2. Products
- 11.2.7.3. SWOT Analysis
- 11.2.7.4. Recent Developments
- 11.2.7.5. Financials (Based on Availability)
- 11.2.8 Berry Global
- 11.2.8.1. Overview
- 11.2.8.2. Products
- 11.2.8.3. SWOT Analysis
- 11.2.8.4. Recent Developments
- 11.2.8.5. Financials (Based on Availability)
- 11.2.9 Sonoco Products
- 11.2.9.1. Overview
- 11.2.9.2. Products
- 11.2.9.3. SWOT Analysis
- 11.2.9.4. Recent Developments
- 11.2.9.5. Financials (Based on Availability)
- 11.2.10 Genpak LLC
- 11.2.10.1. Overview
- 11.2.10.2. Products
- 11.2.10.3. SWOT Analysis
- 11.2.10.4. Recent Developments
- 11.2.10.5. Financials (Based on Availability)
- 11.2.11 D&W Fine Pack
- 11.2.11.1. Overview
- 11.2.11.2. Products
- 11.2.11.3. SWOT Analysis
- 11.2.11.4. Recent Developments
- 11.2.11.5. Financials (Based on Availability)
- 11.2.12 Amhil North America
- 11.2.12.1. Overview
- 11.2.12.2. Products
- 11.2.12.3. SWOT Analysis
- 11.2.12.4. Recent Developments
- 11.2.12.5. Financials (Based on Availability)
- 11.2.13 Fabri-Kal Corporation
- 11.2.13.1. Overview
- 11.2.13.2. Products
- 11.2.13.3. SWOT Analysis
- 11.2.13.4. Recent Developments
- 11.2.13.5. Financials (Based on Availability)
- 11.2.14 Polar Pak Company
- 11.2.14.1. Overview
- 11.2.14.2. Products
- 11.2.14.3. SWOT Analysis
- 11.2.14.4. Recent Developments
- 11.2.14.5. Financials (Based on Availability)
- 11.2.1 Huhtamaki (Chinet)
List of Figures
- Figure 1: Global Portion Cups Revenue Breakdown (million, %) by Region 2025 & 2033
- Figure 2: Global Portion Cups Volume Breakdown (K, %) by Region 2025 & 2033
- Figure 3: North America Portion Cups Revenue (million), by Application 2025 & 2033
- Figure 4: North America Portion Cups Volume (K), by Application 2025 & 2033
- Figure 5: North America Portion Cups Revenue Share (%), by Application 2025 & 2033
- Figure 6: North America Portion Cups Volume Share (%), by Application 2025 & 2033
- Figure 7: North America Portion Cups Revenue (million), by Types 2025 & 2033
- Figure 8: North America Portion Cups Volume (K), by Types 2025 & 2033
- Figure 9: North America Portion Cups Revenue Share (%), by Types 2025 & 2033
- Figure 10: North America Portion Cups Volume Share (%), by Types 2025 & 2033
- Figure 11: North America Portion Cups Revenue (million), by Country 2025 & 2033
- Figure 12: North America Portion Cups Volume (K), by Country 2025 & 2033
- Figure 13: North America Portion Cups Revenue Share (%), by Country 2025 & 2033
- Figure 14: North America Portion Cups Volume Share (%), by Country 2025 & 2033
- Figure 15: South America Portion Cups Revenue (million), by Application 2025 & 2033
- Figure 16: South America Portion Cups Volume (K), by Application 2025 & 2033
- Figure 17: South America Portion Cups Revenue Share (%), by Application 2025 & 2033
- Figure 18: South America Portion Cups Volume Share (%), by Application 2025 & 2033
- Figure 19: South America Portion Cups Revenue (million), by Types 2025 & 2033
- Figure 20: South America Portion Cups Volume (K), by Types 2025 & 2033
- Figure 21: South America Portion Cups Revenue Share (%), by Types 2025 & 2033
- Figure 22: South America Portion Cups Volume Share (%), by Types 2025 & 2033
- Figure 23: South America Portion Cups Revenue (million), by Country 2025 & 2033
- Figure 24: South America Portion Cups Volume (K), by Country 2025 & 2033
- Figure 25: South America Portion Cups Revenue Share (%), by Country 2025 & 2033
- Figure 26: South America Portion Cups Volume Share (%), by Country 2025 & 2033
- Figure 27: Europe Portion Cups Revenue (million), by Application 2025 & 2033
- Figure 28: Europe Portion Cups Volume (K), by Application 2025 & 2033
- Figure 29: Europe Portion Cups Revenue Share (%), by Application 2025 & 2033
- Figure 30: Europe Portion Cups Volume Share (%), by Application 2025 & 2033
- Figure 31: Europe Portion Cups Revenue (million), by Types 2025 & 2033
- Figure 32: Europe Portion Cups Volume (K), by Types 2025 & 2033
- Figure 33: Europe Portion Cups Revenue Share (%), by Types 2025 & 2033
- Figure 34: Europe Portion Cups Volume Share (%), by Types 2025 & 2033
- Figure 35: Europe Portion Cups Revenue (million), by Country 2025 & 2033
- Figure 36: Europe Portion Cups Volume (K), by Country 2025 & 2033
- Figure 37: Europe Portion Cups Revenue Share (%), by Country 2025 & 2033
- Figure 38: Europe Portion Cups Volume Share (%), by Country 2025 & 2033
- Figure 39: Middle East & Africa Portion Cups Revenue (million), by Application 2025 & 2033
- Figure 40: Middle East & Africa Portion Cups Volume (K), by Application 2025 & 2033
- Figure 41: Middle East & Africa Portion Cups Revenue Share (%), by Application 2025 & 2033
- Figure 42: Middle East & Africa Portion Cups Volume Share (%), by Application 2025 & 2033
- Figure 43: Middle East & Africa Portion Cups Revenue (million), by Types 2025 & 2033
- Figure 44: Middle East & Africa Portion Cups Volume (K), by Types 2025 & 2033
- Figure 45: Middle East & Africa Portion Cups Revenue Share (%), by Types 2025 & 2033
- Figure 46: Middle East & Africa Portion Cups Volume Share (%), by Types 2025 & 2033
- Figure 47: Middle East & Africa Portion Cups Revenue (million), by Country 2025 & 2033
- Figure 48: Middle East & Africa Portion Cups Volume (K), by Country 2025 & 2033
- Figure 49: Middle East & Africa Portion Cups Revenue Share (%), by Country 2025 & 2033
- Figure 50: Middle East & Africa Portion Cups Volume Share (%), by Country 2025 & 2033
- Figure 51: Asia Pacific Portion Cups Revenue (million), by Application 2025 & 2033
- Figure 52: Asia Pacific Portion Cups Volume (K), by Application 2025 & 2033
- Figure 53: Asia Pacific Portion Cups Revenue Share (%), by Application 2025 & 2033
- Figure 54: Asia Pacific Portion Cups Volume Share (%), by Application 2025 & 2033
- Figure 55: Asia Pacific Portion Cups Revenue (million), by Types 2025 & 2033
- Figure 56: Asia Pacific Portion Cups Volume (K), by Types 2025 & 2033
- Figure 57: Asia Pacific Portion Cups Revenue Share (%), by Types 2025 & 2033
- Figure 58: Asia Pacific Portion Cups Volume Share (%), by Types 2025 & 2033
- Figure 59: Asia Pacific Portion Cups Revenue (million), by Country 2025 & 2033
- Figure 60: Asia Pacific Portion Cups Volume (K), by Country 2025 & 2033
- Figure 61: Asia Pacific Portion Cups Revenue Share (%), by Country 2025 & 2033
- Figure 62: Asia Pacific Portion Cups Volume Share (%), by Country 2025 & 2033
List of Tables
- Table 1: Global Portion Cups Revenue million Forecast, by Application 2020 & 2033
- Table 2: Global Portion Cups Volume K Forecast, by Application 2020 & 2033
- Table 3: Global Portion Cups Revenue million Forecast, by Types 2020 & 2033
- Table 4: Global Portion Cups Volume K Forecast, by Types 2020 & 2033
- Table 5: Global Portion Cups Revenue million Forecast, by Region 2020 & 2033
- Table 6: Global Portion Cups Volume K Forecast, by Region 2020 & 2033
- Table 7: Global Portion Cups Revenue million Forecast, by Application 2020 & 2033
- Table 8: Global Portion Cups Volume K Forecast, by Application 2020 & 2033
- Table 9: Global Portion Cups Revenue million Forecast, by Types 2020 & 2033
- Table 10: Global Portion Cups Volume K Forecast, by Types 2020 & 2033
- Table 11: Global Portion Cups Revenue million Forecast, by Country 2020 & 2033
- Table 12: Global Portion Cups Volume K Forecast, by Country 2020 & 2033
- Table 13: United States Portion Cups Revenue (million) Forecast, by Application 2020 & 2033
- Table 14: United States Portion Cups Volume (K) Forecast, by Application 2020 & 2033
- Table 15: Canada Portion Cups Revenue (million) Forecast, by Application 2020 & 2033
- Table 16: Canada Portion Cups Volume (K) Forecast, by Application 2020 & 2033
- Table 17: Mexico Portion Cups Revenue (million) Forecast, by Application 2020 & 2033
- Table 18: Mexico Portion Cups Volume (K) Forecast, by Application 2020 & 2033
- Table 19: Global Portion Cups Revenue million Forecast, by Application 2020 & 2033
- Table 20: Global Portion Cups Volume K Forecast, by Application 2020 & 2033
- Table 21: Global Portion Cups Revenue million Forecast, by Types 2020 & 2033
- Table 22: Global Portion Cups Volume K Forecast, by Types 2020 & 2033
- Table 23: Global Portion Cups Revenue million Forecast, by Country 2020 & 2033
- Table 24: Global Portion Cups Volume K Forecast, by Country 2020 & 2033
- Table 25: Brazil Portion Cups Revenue (million) Forecast, by Application 2020 & 2033
- Table 26: Brazil Portion Cups Volume (K) Forecast, by Application 2020 & 2033
- Table 27: Argentina Portion Cups Revenue (million) Forecast, by Application 2020 & 2033
- Table 28: Argentina Portion Cups Volume (K) Forecast, by Application 2020 & 2033
- Table 29: Rest of South America Portion Cups Revenue (million) Forecast, by Application 2020 & 2033
- Table 30: Rest of South America Portion Cups Volume (K) Forecast, by Application 2020 & 2033
- Table 31: Global Portion Cups Revenue million Forecast, by Application 2020 & 2033
- Table 32: Global Portion Cups Volume K Forecast, by Application 2020 & 2033
- Table 33: Global Portion Cups Revenue million Forecast, by Types 2020 & 2033
- Table 34: Global Portion Cups Volume K Forecast, by Types 2020 & 2033
- Table 35: Global Portion Cups Revenue million Forecast, by Country 2020 & 2033
- Table 36: Global Portion Cups Volume K Forecast, by Country 2020 & 2033
- Table 37: United Kingdom Portion Cups Revenue (million) Forecast, by Application 2020 & 2033
- Table 38: United Kingdom Portion Cups Volume (K) Forecast, by Application 2020 & 2033
- Table 39: Germany Portion Cups Revenue (million) Forecast, by Application 2020 & 2033
- Table 40: Germany Portion Cups Volume (K) Forecast, by Application 2020 & 2033
- Table 41: France Portion Cups Revenue (million) Forecast, by Application 2020 & 2033
- Table 42: France Portion Cups Volume (K) Forecast, by Application 2020 & 2033
- Table 43: Italy Portion Cups Revenue (million) Forecast, by Application 2020 & 2033
- Table 44: Italy Portion Cups Volume (K) Forecast, by Application 2020 & 2033
- Table 45: Spain Portion Cups Revenue (million) Forecast, by Application 2020 & 2033
- Table 46: Spain Portion Cups Volume (K) Forecast, by Application 2020 & 2033
- Table 47: Russia Portion Cups Revenue (million) Forecast, by Application 2020 & 2033
- Table 48: Russia Portion Cups Volume (K) Forecast, by Application 2020 & 2033
- Table 49: Benelux Portion Cups Revenue (million) Forecast, by Application 2020 & 2033
- Table 50: Benelux Portion Cups Volume (K) Forecast, by Application 2020 & 2033
- Table 51: Nordics Portion Cups Revenue (million) Forecast, by Application 2020 & 2033
- Table 52: Nordics Portion Cups Volume (K) Forecast, by Application 2020 & 2033
- Table 53: Rest of Europe Portion Cups Revenue (million) Forecast, by Application 2020 & 2033
- Table 54: Rest of Europe Portion Cups Volume (K) Forecast, by Application 2020 & 2033
- Table 55: Global Portion Cups Revenue million Forecast, by Application 2020 & 2033
- Table 56: Global Portion Cups Volume K Forecast, by Application 2020 & 2033
- Table 57: Global Portion Cups Revenue million Forecast, by Types 2020 & 2033
- Table 58: Global Portion Cups Volume K Forecast, by Types 2020 & 2033
- Table 59: Global Portion Cups Revenue million Forecast, by Country 2020 & 2033
- Table 60: Global Portion Cups Volume K Forecast, by Country 2020 & 2033
- Table 61: Turkey Portion Cups Revenue (million) Forecast, by Application 2020 & 2033
- Table 62: Turkey Portion Cups Volume (K) Forecast, by Application 2020 & 2033
- Table 63: Israel Portion Cups Revenue (million) Forecast, by Application 2020 & 2033
- Table 64: Israel Portion Cups Volume (K) Forecast, by Application 2020 & 2033
- Table 65: GCC Portion Cups Revenue (million) Forecast, by Application 2020 & 2033
- Table 66: GCC Portion Cups Volume (K) Forecast, by Application 2020 & 2033
- Table 67: North Africa Portion Cups Revenue (million) Forecast, by Application 2020 & 2033
- Table 68: North Africa Portion Cups Volume (K) Forecast, by Application 2020 & 2033
- Table 69: South Africa Portion Cups Revenue (million) Forecast, by Application 2020 & 2033
- Table 70: South Africa Portion Cups Volume (K) Forecast, by Application 2020 & 2033
- Table 71: Rest of Middle East & Africa Portion Cups Revenue (million) Forecast, by Application 2020 & 2033
- Table 72: Rest of Middle East & Africa Portion Cups Volume (K) Forecast, by Application 2020 & 2033
- Table 73: Global Portion Cups Revenue million Forecast, by Application 2020 & 2033
- Table 74: Global Portion Cups Volume K Forecast, by Application 2020 & 2033
- Table 75: Global Portion Cups Revenue million Forecast, by Types 2020 & 2033
- Table 76: Global Portion Cups Volume K Forecast, by Types 2020 & 2033
- Table 77: Global Portion Cups Revenue million Forecast, by Country 2020 & 2033
- Table 78: Global Portion Cups Volume K Forecast, by Country 2020 & 2033
- Table 79: China Portion Cups Revenue (million) Forecast, by Application 2020 & 2033
- Table 80: China Portion Cups Volume (K) Forecast, by Application 2020 & 2033
- Table 81: India Portion Cups Revenue (million) Forecast, by Application 2020 & 2033
- Table 82: India Portion Cups Volume (K) Forecast, by Application 2020 & 2033
- Table 83: Japan Portion Cups Revenue (million) Forecast, by Application 2020 & 2033
- Table 84: Japan Portion Cups Volume (K) Forecast, by Application 2020 & 2033
- Table 85: South Korea Portion Cups Revenue (million) Forecast, by Application 2020 & 2033
- Table 86: South Korea Portion Cups Volume (K) Forecast, by Application 2020 & 2033
- Table 87: ASEAN Portion Cups Revenue (million) Forecast, by Application 2020 & 2033
- Table 88: ASEAN Portion Cups Volume (K) Forecast, by Application 2020 & 2033
- Table 89: Oceania Portion Cups Revenue (million) Forecast, by Application 2020 & 2033
- Table 90: Oceania Portion Cups Volume (K) Forecast, by Application 2020 & 2033
- Table 91: Rest of Asia Pacific Portion Cups Revenue (million) Forecast, by Application 2020 & 2033
- Table 92: Rest of Asia Pacific Portion Cups Volume (K) Forecast, by Application 2020 & 2033
Frequently Asked Questions
1. What is the projected Compound Annual Growth Rate (CAGR) of the Portion Cups?
The projected CAGR is approximately 3.9%.
2. Which companies are prominent players in the Portion Cups?
Key companies in the market include Huhtamaki (Chinet), Dart Container, Pactiv (Reynolds Group), Georgia-Pacific, International Paper, The Waddington Group, Lollicup USA, Berry Global, Sonoco Products, Genpak LLC, D&W Fine Pack, Amhil North America, Fabri-Kal Corporation, Polar Pak Company.
3. What are the main segments of the Portion Cups?
The market segments include Application, Types.
4. Can you provide details about the market size?
The market size is estimated to be USD 658 million as of 2022.
5. What are some drivers contributing to market growth?
N/A
6. What are the notable trends driving market growth?
N/A
7. Are there any restraints impacting market growth?
N/A
8. Can you provide examples of recent developments in the market?
N/A
9. What pricing options are available for accessing the report?
Pricing options include single-user, multi-user, and enterprise licenses priced at USD 3350.00, USD 5025.00, and USD 6700.00 respectively.
10. Is the market size provided in terms of value or volume?
The market size is provided in terms of value, measured in million and volume, measured in K.
11. Are there any specific market keywords associated with the report?
Yes, the market keyword associated with the report is "Portion Cups," which aids in identifying and referencing the specific market segment covered.
12. How do I determine which pricing option suits my needs best?
The pricing options vary based on user requirements and access needs. Individual users may opt for single-user licenses, while businesses requiring broader access may choose multi-user or enterprise licenses for cost-effective access to the report.
13. Are there any additional resources or data provided in the Portion Cups report?
While the report offers comprehensive insights, it's advisable to review the specific contents or supplementary materials provided to ascertain if additional resources or data are available.
14. How can I stay updated on further developments or reports in the Portion Cups?
To stay informed about further developments, trends, and reports in the Portion Cups, consider subscribing to industry newsletters, following relevant companies and organizations, or regularly checking reputable industry news sources and publications.
Methodology
Step 1 - Identification of Relevant Samples Size from Population Database


Step 2 - Approaches for Defining Global Market Size (Value, Volume* & Price*)

Note*: In applicable scenarios
Step 3 - Data Sources
Primary Research
- Web Analytics
- Survey Reports
- Research Institute
- Latest Research Reports
- Opinion Leaders
Secondary Research
- Annual Reports
- White Paper
- Latest Press Release
- Industry Association
- Paid Database
- Investor Presentations

Step 4 - Data Triangulation
Involves using different sources of information in order to increase the validity of a study
These sources are likely to be stakeholders in a program - participants, other researchers, program staff, other community members, and so on.
Then we put all data in single framework & apply various statistical tools to find out the dynamic on the market.
During the analysis stage, feedback from the stakeholder groups would be compared to determine areas of agreement as well as areas of divergence