

Key Insights
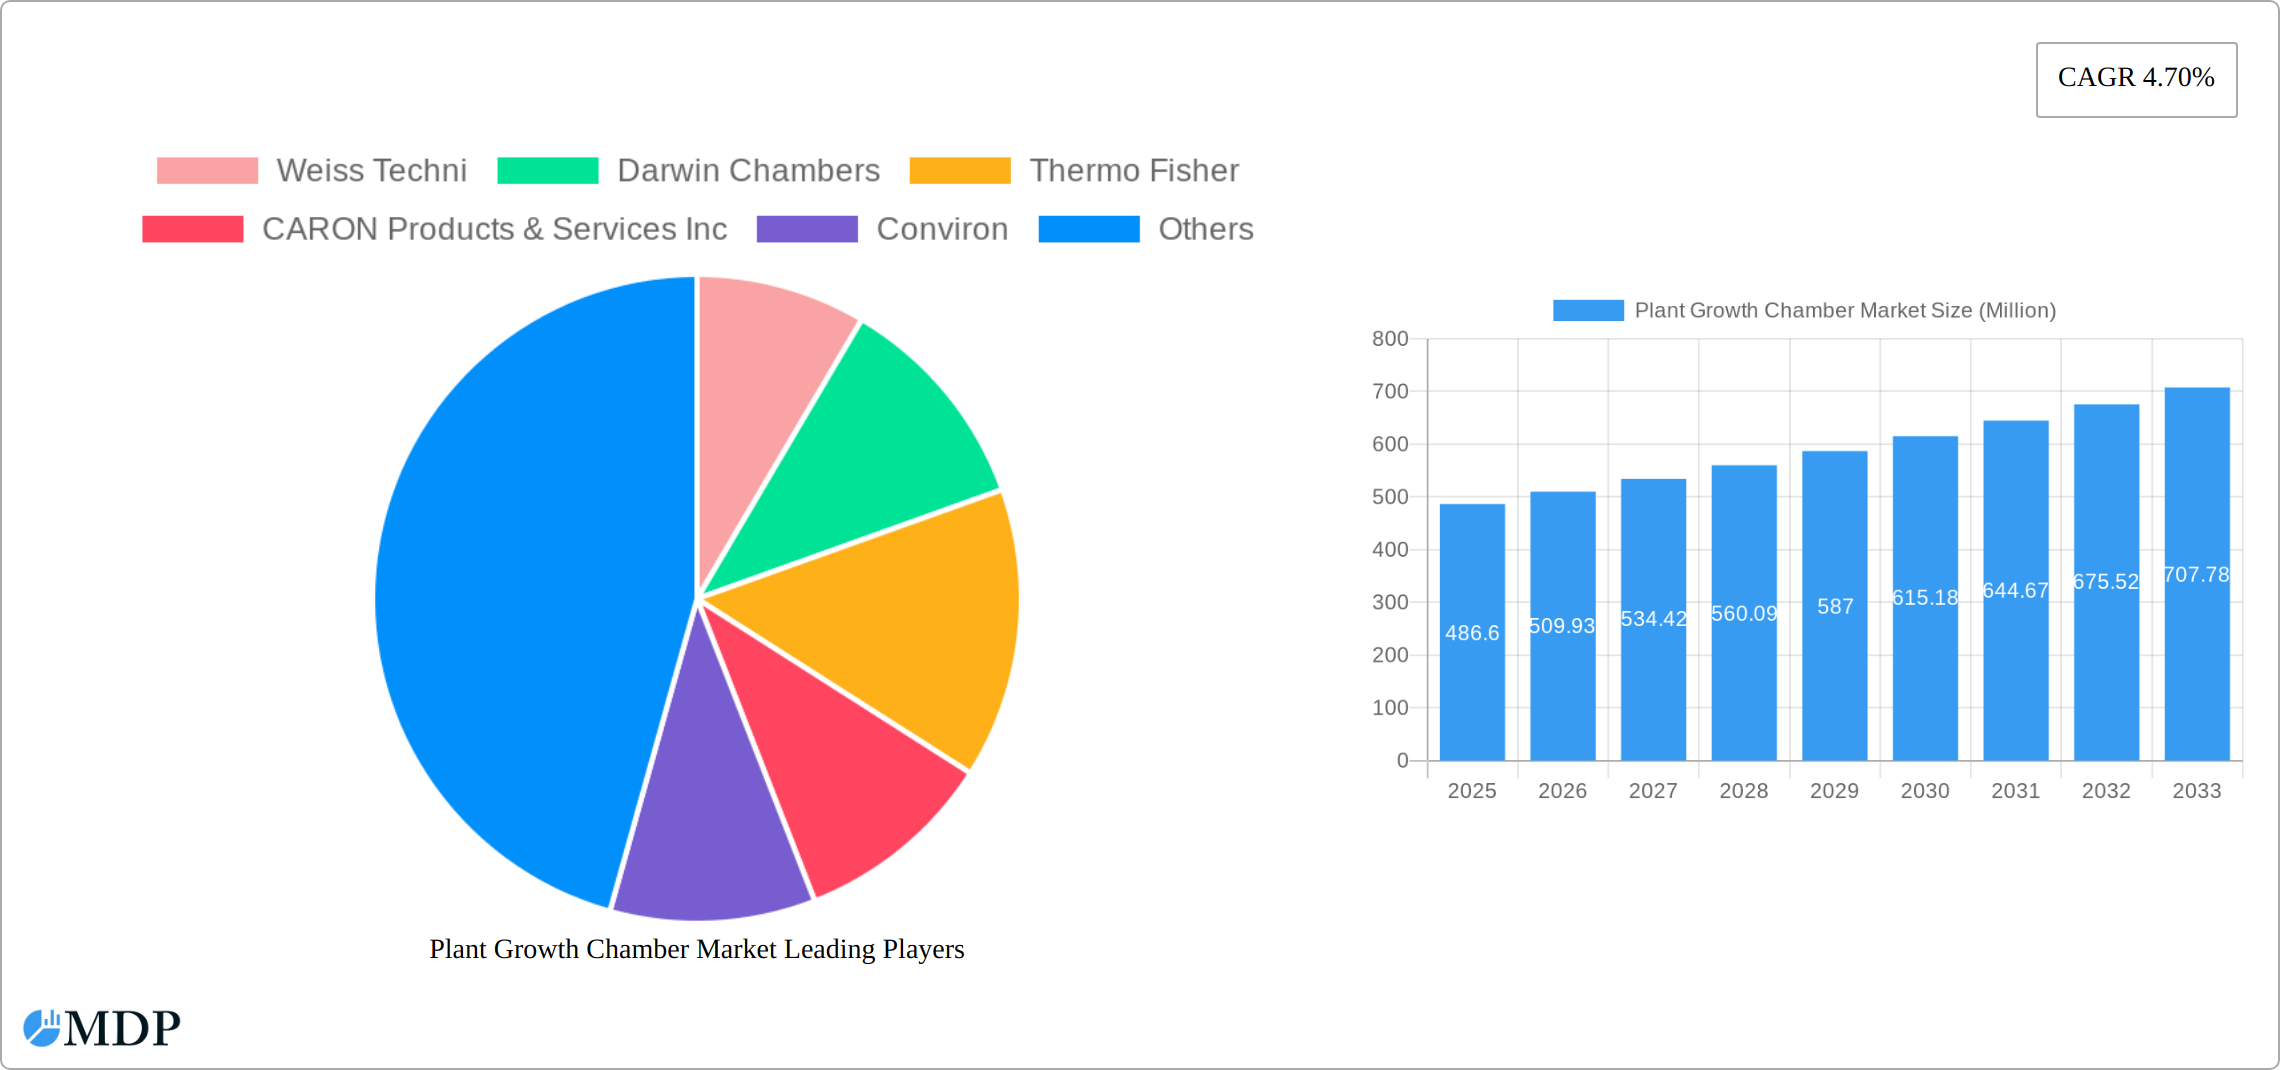
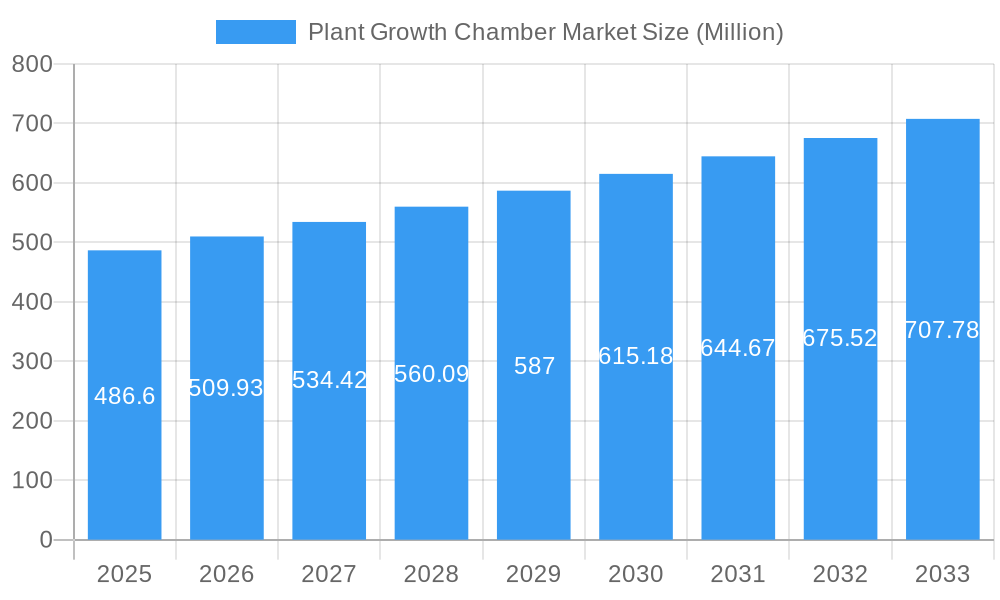
The global Plant Growth Chamber market, valued at $486.60 million in 2025, is projected to experience robust growth, driven by advancements in agricultural technology and increasing demand for controlled-environment agriculture (CEA). The market's Compound Annual Growth Rate (CAGR) of 4.70% from 2025 to 2033 signifies a steady expansion, fueled by several key factors. The rising adoption of plant growth chambers in research institutions, universities, and pharmaceutical companies for controlled experiments and tissue culture is a significant driver. Furthermore, the growing awareness of sustainable agriculture and the need for year-round crop production, particularly in regions with limited arable land or harsh climates, is boosting market demand. Segmentation reveals strong growth potential across various equipment types (reach-in and walk-in chambers), applications (short and tall plants), and functions (plant growth, seed germination, environment optimization, and tissue culture). The market is witnessing increased adoption of technologically advanced chambers with features like precise climate control, automated monitoring systems, and energy-efficient designs. Competitive landscape analysis indicates the presence of both established players and emerging companies vying for market share through innovation and strategic partnerships.
Plant Growth Chamber Market Market Size (In Million)
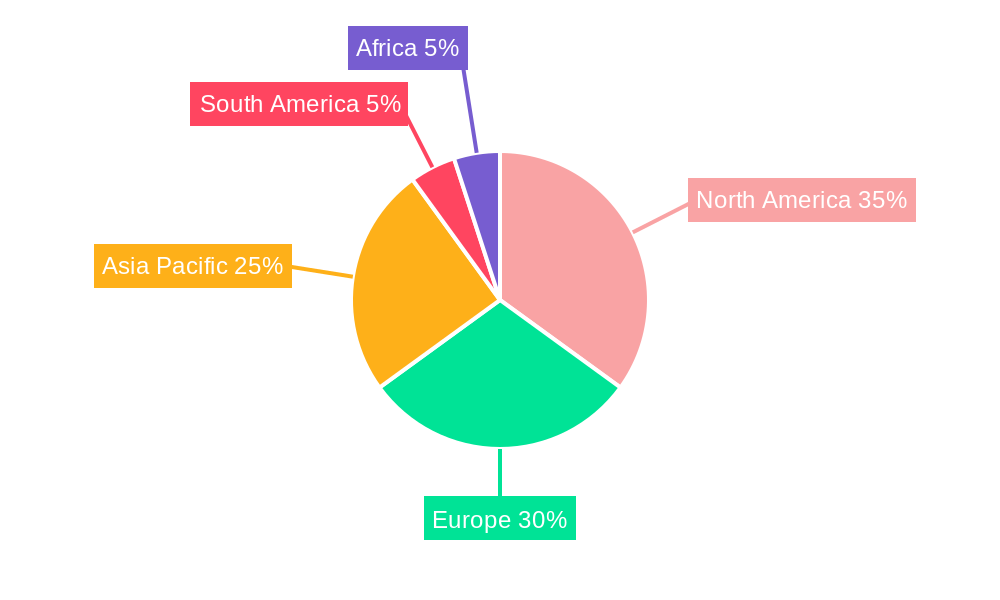
Geographical analysis suggests North America and Europe currently hold significant market shares due to established research infrastructure and high adoption rates. However, the Asia-Pacific region is expected to witness substantial growth over the forecast period, driven by increasing investments in agricultural research and development and the rising demand for high-quality agricultural produce. Constraints such as the high initial investment cost of plant growth chambers and the need for specialized technical expertise might hinder market growth to some extent. However, ongoing technological advancements and the development of cost-effective solutions are mitigating these challenges. The market's trajectory suggests continued expansion, propelled by technological progress, a growing global population needing food security, and increased interest in sustainable agricultural practices.
Plant Growth Chamber Market Company Market Share
Plant Growth Chamber Market Report: 2019-2033
This comprehensive report provides a detailed analysis of the Plant Growth Chamber Market, offering invaluable insights for industry stakeholders, investors, and researchers. Covering the period 2019-2033, with a focus on 2025, this report unveils market dynamics, trends, leading players, and future opportunities within this rapidly evolving sector. The global market is projected to reach xx Million by 2033.
Plant Growth Chamber Market Market Dynamics & Concentration
The Plant Growth Chamber market is characterized by a moderately concentrated landscape, with a few dominant players controlling a significant portion of the global market share. Key companies such as Weiss Techni, Darwin Chambers, Thermo Fisher, Caron Products & Services Inc, Conviron, Aralab, Percival Scientific Inc, Brs Bvba, Binder GmbH, Hettich Benelux BV, Saveer Biotech Limited, and Freezers India are instrumental in shaping market trends and competition. Projections for 2025 indicate that the top five leading companies are expected to collectively command approximately [Insert Specific Percentage]% of the global market. Growth within this sector is largely propelled by continuous innovation in crucial areas, including the integration of advanced LED lighting systems for optimized plant photobiology, sophisticated environmental control technologies for precise climate management, and the increasing adoption of automation for enhanced efficiency and reduced labor. Furthermore, the market is significantly influenced by evolving regulatory frameworks that emphasize energy efficiency and stringent safety standards, driving manufacturers towards more sustainable and compliant product development. The competitive environment is also shaped by the presence of substitute technologies, notably controlled-environment greenhouses, which offer alternative solutions for plant cultivation. Shifting end-user trends, particularly the escalating demand from research and development institutions, the burgeoning agricultural sector focused on precision farming, and the pharmaceutical industry's need for controlled experimental conditions, are vital determinants of market demand. The sector has also witnessed notable mergers and acquisitions (M&A) activity, exemplified by the significant May 2021 merger of Weiss Umwelttechnik GmbH and Vötsch Industrietechnik GmbH. This consolidation trend signals an intensifying competitive environment and strategic realignments within the industry. Over the study period spanning from 2019 to 2024, approximately [Insert Specific Number] M&A deals were recorded, underscoring a sustained, moderate level of industry consolidation.
- Market Concentration: Moderately concentrated, with the top 5 players estimated to hold around [Insert Specific Percentage]% of the global market share in 2025.
- Key Innovation Drivers: Advancements in energy-efficient LED lighting, sophisticated environmental control systems, and integration of automation technologies.
- Influential Regulatory Frameworks: Emphasis on energy efficiency standards and rigorous safety regulations are shaping product design and market entry.
- Competitive Landscape: Market dynamics are influenced by the availability of substitute technologies, most notably controlled-environment greenhouses.
- End-User Demand Drivers: Strong and growing demand from the research and development sectors, advancements in modern agriculture, and the specific requirements of the pharmaceutical industry.
- Mergers & Acquisitions: Approximately [Insert Specific Number] M&A deals were completed between 2019 and 2024, indicating a trend towards consolidation and strategic partnerships.
Plant Growth Chamber Market Industry Trends & Analysis
The Plant Growth Chamber market is experiencing robust growth, driven by several key factors. The market registered a CAGR of xx% during the historical period (2019-2024) and is projected to maintain a CAGR of xx% during the forecast period (2025-2033). Technological disruptions, such as the introduction of more energy-efficient LED lighting and advanced environmental control systems, are transforming the market. Consumer preferences are shifting towards sophisticated chambers offering greater precision and ease of use. Intense competitive dynamics, characterized by product innovation, strategic partnerships, and M&A activities, are reshaping the market landscape. Market penetration of advanced features such as remote monitoring and data analytics is increasing, driven by the need for enhanced efficiency and data-driven insights. The rising demand for controlled experiments in various sectors including pharmaceuticals and agricultural research is a key growth driver. Growing awareness about the importance of controlled environment for plant growth and increasing investments in research sectors contribute to this market growth. The global market size is estimated to be xx Million in 2025, indicating significant market potential.
Leading Markets & Segments in Plant Growth Chamber Market
The North American region currently holds the largest market share in the Plant Growth Chamber market, followed by Europe and Asia-Pacific. Within the market segmentation:
- Equipment Type: Reach-in chambers dominate the market due to their cost-effectiveness and suitability for smaller research settings. However, Walk-in chambers are gaining traction due to their capacity to handle larger-scale experiments.
- Application: The demand for plant growth chambers across various applications is expanding, with short plants and tall plants both driving substantial market segments. The pharmaceutical and agricultural industries form crucial end-user segments.
- Function: Plant growth, seed germination, environment optimization, and tissue culture are major functionalities that dictate market demand.
Key Drivers for Dominant Regions:
- North America: Strong R&D investments, advanced technological infrastructure, robust regulatory frameworks.
- Europe: Significant agricultural sector, presence of major industry players, supportive government initiatives.
- Asia-Pacific: Rapidly growing economies, rising agricultural productivity needs, increased investments in research.
Plant Growth Chamber Market Product Developments
Recent product developments focus on enhancing energy efficiency, improving environmental control precision, and incorporating advanced automation features. New chamber designs offer improved spatial uniformity of light and environmental parameters. The integration of sophisticated data analytics and remote monitoring capabilities is also becoming increasingly common, allowing for optimized experimental control and data management. This aligns with the overall industry trend toward automation and data-driven decision-making.
Key Drivers of Plant Growth Chamber Market Growth
The expansion of the Plant Growth Chamber market is underpinned by a confluence of potent growth drivers:
- Technological Advancements: Continuous innovation is a primary catalyst. This includes the development and integration of highly energy-efficient LED lighting solutions tailored for specific plant photobiology, the implementation of increasingly sophisticated and precise environmental control systems (e.g., for temperature, humidity, CO2, and light spectrum), and the incorporation of advanced automation technologies to streamline operations and improve experimental reproducibility.
- Economic Growth and Investment: Robust economic growth fuels increased investments across key end-user industries. Significant capital allocation towards agricultural research and development (R&D), particularly in areas like crop improvement and sustainable farming practices, alongside substantial R&D investments in the pharmaceutical sector for drug discovery and testing, and the expanding market for plant-based products, all contribute to a higher demand for controlled growth environments.
- Supportive Regulatory Factors and Government Initiatives: Stringent environmental regulations globally are pushing industries towards more sustainable practices, creating a favorable environment for energy-efficient growth chambers. Additionally, various government support programs and grants aimed at promoting sustainable agriculture, food security, and life sciences research further stimulate market growth.
Challenges in the Plant Growth Chamber Market
Despite its growth trajectory, the Plant Growth Chamber market encounters several significant challenges:
- High Initial Investment Costs: The acquisition of advanced, feature-rich plant growth chambers can represent a substantial capital expenditure. This high upfront cost can act as a barrier to entry, particularly for smaller research facilities, academic institutions with limited budgets, or emerging companies.
- Supply Chain Vulnerabilities and Disruptions: The globalized nature of component sourcing makes the market susceptible to supply chain disruptions. Geopolitical events, logistical challenges, and unforeseen crises can impact the availability and cost of essential parts, potentially leading to production delays and increased manufacturing expenses.
- Intense Market Competition and Margin Pressure: The Plant Growth Chamber market is characterized by a competitive landscape with numerous established players and new entrants vying for market share. This intense competition often translates into price wars and a strong emphasis on innovation, which can put significant pressure on profit margins for manufacturers.
Emerging Opportunities in Plant Growth Chamber Market
Several opportunities exist for growth in the Plant Growth Chamber market:
- Development of more energy-efficient and sustainable chambers.
- Expansion into emerging markets with growing demand for agricultural technology.
- Strategic partnerships and collaborations between manufacturers, research institutions, and agricultural businesses.
Leading Players in the Plant Growth Chamber Market Sector
The Plant Growth Chamber market is shaped by a diverse range of leading companies, each contributing to the sector's innovation and global reach:
- Weiss Techni
- Darwin Chambers
- Thermo Fisher Scientific
- CARON Products & Services Inc
- Conviron
- Aralab
- Percival Scientific Inc
- Brs Bvba
- BINDER GmbH
- Hettich Benelux BV
- Saveer Biotech Limited
- Freezers India
Key Milestones in Plant Growth Chamber Market Industry
Significant strategic moves and product developments mark the evolution of the Plant Growth Chamber market:
- January 2022: Conviron significantly enhanced its product portfolio by launching its new EVO series of plant growth chambers. This series is distinguished by its comprehensive range of light intensities and superior spatial uniformity, directly addressing the nuanced requirements of advanced plant research and strengthening Conviron's competitive standing.
- August 2021: Caron strategically expanded its market presence and product offerings through the acquisition of Bigneat. This move broadened Caron's reach into the laboratory equipment sector and solidified its position within the broader life sciences market, offering a more comprehensive suite of solutions to its clientele.
- May 2021: A major consolidation occurred with the merger of Weiss Umwelttechnik GmbH and Vötsch Industrietechnik GmbH. This strategic alliance created a more formidable entity with enhanced expertise and capabilities in environmental simulation and plant growth chamber technologies, thereby increasing its market influence and competitive capacity.
Strategic Outlook for Plant Growth Chamber Market
The Plant Growth Chamber market presents significant growth potential driven by technological advancements, rising demand from various sectors, and increased focus on sustainable agriculture. Strategic partnerships, focused R&D investments, and expansion into new markets are crucial for future success. Companies focusing on energy efficiency, automation, and data analytics are poised to gain a competitive advantage. The overall market is expected to experience continued growth, driven by a global focus on sustainability, precision agriculture, and scientific research.
Plant Growth Chamber Market Segmentation
- 1. Production Analysis
- 2. Consumption Analysis
- 3. Import Market Analysis (Value & Volume)
- 4. Export Market Analysis (Value & Volume)
- 5. Price Trend Analysis
Plant Growth Chamber Market Segmentation By Geography
-
1. North America
- 1.1. United States
- 1.2. Canada
- 1.3. Mexico
-
2. South America
- 2.1. Brazil
- 2.2. Argentina
- 2.3. Rest of South America
-
3. Europe
- 3.1. United Kingdom
- 3.2. Germany
- 3.3. France
- 3.4. Italy
- 3.5. Spain
- 3.6. Russia
- 3.7. Benelux
- 3.8. Nordics
- 3.9. Rest of Europe
-
4. Middle East & Africa
- 4.1. Turkey
- 4.2. Israel
- 4.3. GCC
- 4.4. North Africa
- 4.5. South Africa
- 4.6. Rest of Middle East & Africa
-
5. Asia Pacific
- 5.1. China
- 5.2. India
- 5.3. Japan
- 5.4. South Korea
- 5.5. ASEAN
- 5.6. Oceania
- 5.7. Rest of Asia Pacific
Plant Growth Chamber Market Regional Market Share
Geographic Coverage of Plant Growth Chamber Market
Plant Growth Chamber Market REPORT HIGHLIGHTS
| Aspects | Details |
|---|---|
| Study Period | 2020-2034 |
| Base Year | 2025 |
| Estimated Year | 2026 |
| Forecast Period | 2026-2034 |
| Historical Period | 2020-2025 |
| Growth Rate | CAGR of 4.70% from 2020-2034 |
| Segmentation |
|
Table of Contents
- 1. Introduction
- 1.1. Research Scope
- 1.2. Market Segmentation
- 1.3. Research Methodology
- 1.4. Definitions and Assumptions
- 2. Executive Summary
- 2.1. Introduction
- 3. Market Dynamics
- 3.1. Introduction
- 3.2. Market Drivers
- 3.2.1. Seed Treatment As A Solution To Enhance Yield; Growing Awareness For Seed Treatment Among The Farmers; Rising Trend Of Organic Farming
- 3.3. Market Restrains
- 3.3.1. Limitations Across Farm-Level Seed Treatment; Rising Environmental Concerns
- 3.4. Market Trends
- 3.4.1. Increasing Demand for Food and Decreasing Arable Land
- 4. Market Factor Analysis
- 4.1. Porters Five Forces
- 4.2. Supply/Value Chain
- 4.3. PESTEL analysis
- 4.4. Market Entropy
- 4.5. Patent/Trademark Analysis
- 5. Global Plant Growth Chamber Market Analysis, Insights and Forecast, 2020-2032
- 5.1. Market Analysis, Insights and Forecast - by Production Analysis
- 5.2. Market Analysis, Insights and Forecast - by Consumption Analysis
- 5.3. Market Analysis, Insights and Forecast - by Import Market Analysis (Value & Volume)
- 5.4. Market Analysis, Insights and Forecast - by Export Market Analysis (Value & Volume)
- 5.5. Market Analysis, Insights and Forecast - by Price Trend Analysis
- 5.6. Market Analysis, Insights and Forecast - by Region
- 5.6.1. North America
- 5.6.2. South America
- 5.6.3. Europe
- 5.6.4. Middle East & Africa
- 5.6.5. Asia Pacific
- 5.1. Market Analysis, Insights and Forecast - by Production Analysis
- 6. North America Plant Growth Chamber Market Analysis, Insights and Forecast, 2020-2032
- 6.1. Market Analysis, Insights and Forecast - by Production Analysis
- 6.2. Market Analysis, Insights and Forecast - by Consumption Analysis
- 6.3. Market Analysis, Insights and Forecast - by Import Market Analysis (Value & Volume)
- 6.4. Market Analysis, Insights and Forecast - by Export Market Analysis (Value & Volume)
- 6.5. Market Analysis, Insights and Forecast - by Price Trend Analysis
- 6.1. Market Analysis, Insights and Forecast - by Production Analysis
- 7. South America Plant Growth Chamber Market Analysis, Insights and Forecast, 2020-2032
- 7.1. Market Analysis, Insights and Forecast - by Production Analysis
- 7.2. Market Analysis, Insights and Forecast - by Consumption Analysis
- 7.3. Market Analysis, Insights and Forecast - by Import Market Analysis (Value & Volume)
- 7.4. Market Analysis, Insights and Forecast - by Export Market Analysis (Value & Volume)
- 7.5. Market Analysis, Insights and Forecast - by Price Trend Analysis
- 7.1. Market Analysis, Insights and Forecast - by Production Analysis
- 8. Europe Plant Growth Chamber Market Analysis, Insights and Forecast, 2020-2032
- 8.1. Market Analysis, Insights and Forecast - by Production Analysis
- 8.2. Market Analysis, Insights and Forecast - by Consumption Analysis
- 8.3. Market Analysis, Insights and Forecast - by Import Market Analysis (Value & Volume)
- 8.4. Market Analysis, Insights and Forecast - by Export Market Analysis (Value & Volume)
- 8.5. Market Analysis, Insights and Forecast - by Price Trend Analysis
- 8.1. Market Analysis, Insights and Forecast - by Production Analysis
- 9. Middle East & Africa Plant Growth Chamber Market Analysis, Insights and Forecast, 2020-2032
- 9.1. Market Analysis, Insights and Forecast - by Production Analysis
- 9.2. Market Analysis, Insights and Forecast - by Consumption Analysis
- 9.3. Market Analysis, Insights and Forecast - by Import Market Analysis (Value & Volume)
- 9.4. Market Analysis, Insights and Forecast - by Export Market Analysis (Value & Volume)
- 9.5. Market Analysis, Insights and Forecast - by Price Trend Analysis
- 9.1. Market Analysis, Insights and Forecast - by Production Analysis
- 10. Asia Pacific Plant Growth Chamber Market Analysis, Insights and Forecast, 2020-2032
- 10.1. Market Analysis, Insights and Forecast - by Production Analysis
- 10.2. Market Analysis, Insights and Forecast - by Consumption Analysis
- 10.3. Market Analysis, Insights and Forecast - by Import Market Analysis (Value & Volume)
- 10.4. Market Analysis, Insights and Forecast - by Export Market Analysis (Value & Volume)
- 10.5. Market Analysis, Insights and Forecast - by Price Trend Analysis
- 10.1. Market Analysis, Insights and Forecast - by Production Analysis
- 11. Competitive Analysis
- 11.1. Global Market Share Analysis 2025
- 11.2. Company Profiles
- 11.2.1 Weiss Techni
- 11.2.1.1. Overview
- 11.2.1.2. Products
- 11.2.1.3. SWOT Analysis
- 11.2.1.4. Recent Developments
- 11.2.1.5. Financials (Based on Availability)
- 11.2.2 Darwin Chambers
- 11.2.2.1. Overview
- 11.2.2.2. Products
- 11.2.2.3. SWOT Analysis
- 11.2.2.4. Recent Developments
- 11.2.2.5. Financials (Based on Availability)
- 11.2.3 Thermo Fisher
- 11.2.3.1. Overview
- 11.2.3.2. Products
- 11.2.3.3. SWOT Analysis
- 11.2.3.4. Recent Developments
- 11.2.3.5. Financials (Based on Availability)
- 11.2.4 CARON Products & Services Inc
- 11.2.4.1. Overview
- 11.2.4.2. Products
- 11.2.4.3. SWOT Analysis
- 11.2.4.4. Recent Developments
- 11.2.4.5. Financials (Based on Availability)
- 11.2.5 Conviron
- 11.2.5.1. Overview
- 11.2.5.2. Products
- 11.2.5.3. SWOT Analysis
- 11.2.5.4. Recent Developments
- 11.2.5.5. Financials (Based on Availability)
- 11.2.6 Aralab
- 11.2.6.1. Overview
- 11.2.6.2. Products
- 11.2.6.3. SWOT Analysis
- 11.2.6.4. Recent Developments
- 11.2.6.5. Financials (Based on Availability)
- 11.2.7 Percival Scientific Inc
- 11.2.7.1. Overview
- 11.2.7.2. Products
- 11.2.7.3. SWOT Analysis
- 11.2.7.4. Recent Developments
- 11.2.7.5. Financials (Based on Availability)
- 11.2.8 Brs Bvba
- 11.2.8.1. Overview
- 11.2.8.2. Products
- 11.2.8.3. SWOT Analysis
- 11.2.8.4. Recent Developments
- 11.2.8.5. Financials (Based on Availability)
- 11.2.9 BINDER GmbH
- 11.2.9.1. Overview
- 11.2.9.2. Products
- 11.2.9.3. SWOT Analysis
- 11.2.9.4. Recent Developments
- 11.2.9.5. Financials (Based on Availability)
- 11.2.10 Hettich Benelux BV
- 11.2.10.1. Overview
- 11.2.10.2. Products
- 11.2.10.3. SWOT Analysis
- 11.2.10.4. Recent Developments
- 11.2.10.5. Financials (Based on Availability)
- 11.2.11 Saveer Biotech Limited
- 11.2.11.1. Overview
- 11.2.11.2. Products
- 11.2.11.3. SWOT Analysis
- 11.2.11.4. Recent Developments
- 11.2.11.5. Financials (Based on Availability)
- 11.2.12 Freezers India
- 11.2.12.1. Overview
- 11.2.12.2. Products
- 11.2.12.3. SWOT Analysis
- 11.2.12.4. Recent Developments
- 11.2.12.5. Financials (Based on Availability)
- 11.2.1 Weiss Techni
List of Figures
- Figure 1: Global Plant Growth Chamber Market Revenue Breakdown (Million, %) by Region 2025 & 2033
- Figure 2: North America Plant Growth Chamber Market Revenue (Million), by Production Analysis 2025 & 2033
- Figure 3: North America Plant Growth Chamber Market Revenue Share (%), by Production Analysis 2025 & 2033
- Figure 4: North America Plant Growth Chamber Market Revenue (Million), by Consumption Analysis 2025 & 2033
- Figure 5: North America Plant Growth Chamber Market Revenue Share (%), by Consumption Analysis 2025 & 2033
- Figure 6: North America Plant Growth Chamber Market Revenue (Million), by Import Market Analysis (Value & Volume) 2025 & 2033
- Figure 7: North America Plant Growth Chamber Market Revenue Share (%), by Import Market Analysis (Value & Volume) 2025 & 2033
- Figure 8: North America Plant Growth Chamber Market Revenue (Million), by Export Market Analysis (Value & Volume) 2025 & 2033
- Figure 9: North America Plant Growth Chamber Market Revenue Share (%), by Export Market Analysis (Value & Volume) 2025 & 2033
- Figure 10: North America Plant Growth Chamber Market Revenue (Million), by Price Trend Analysis 2025 & 2033
- Figure 11: North America Plant Growth Chamber Market Revenue Share (%), by Price Trend Analysis 2025 & 2033
- Figure 12: North America Plant Growth Chamber Market Revenue (Million), by Country 2025 & 2033
- Figure 13: North America Plant Growth Chamber Market Revenue Share (%), by Country 2025 & 2033
- Figure 14: South America Plant Growth Chamber Market Revenue (Million), by Production Analysis 2025 & 2033
- Figure 15: South America Plant Growth Chamber Market Revenue Share (%), by Production Analysis 2025 & 2033
- Figure 16: South America Plant Growth Chamber Market Revenue (Million), by Consumption Analysis 2025 & 2033
- Figure 17: South America Plant Growth Chamber Market Revenue Share (%), by Consumption Analysis 2025 & 2033
- Figure 18: South America Plant Growth Chamber Market Revenue (Million), by Import Market Analysis (Value & Volume) 2025 & 2033
- Figure 19: South America Plant Growth Chamber Market Revenue Share (%), by Import Market Analysis (Value & Volume) 2025 & 2033
- Figure 20: South America Plant Growth Chamber Market Revenue (Million), by Export Market Analysis (Value & Volume) 2025 & 2033
- Figure 21: South America Plant Growth Chamber Market Revenue Share (%), by Export Market Analysis (Value & Volume) 2025 & 2033
- Figure 22: South America Plant Growth Chamber Market Revenue (Million), by Price Trend Analysis 2025 & 2033
- Figure 23: South America Plant Growth Chamber Market Revenue Share (%), by Price Trend Analysis 2025 & 2033
- Figure 24: South America Plant Growth Chamber Market Revenue (Million), by Country 2025 & 2033
- Figure 25: South America Plant Growth Chamber Market Revenue Share (%), by Country 2025 & 2033
- Figure 26: Europe Plant Growth Chamber Market Revenue (Million), by Production Analysis 2025 & 2033
- Figure 27: Europe Plant Growth Chamber Market Revenue Share (%), by Production Analysis 2025 & 2033
- Figure 28: Europe Plant Growth Chamber Market Revenue (Million), by Consumption Analysis 2025 & 2033
- Figure 29: Europe Plant Growth Chamber Market Revenue Share (%), by Consumption Analysis 2025 & 2033
- Figure 30: Europe Plant Growth Chamber Market Revenue (Million), by Import Market Analysis (Value & Volume) 2025 & 2033
- Figure 31: Europe Plant Growth Chamber Market Revenue Share (%), by Import Market Analysis (Value & Volume) 2025 & 2033
- Figure 32: Europe Plant Growth Chamber Market Revenue (Million), by Export Market Analysis (Value & Volume) 2025 & 2033
- Figure 33: Europe Plant Growth Chamber Market Revenue Share (%), by Export Market Analysis (Value & Volume) 2025 & 2033
- Figure 34: Europe Plant Growth Chamber Market Revenue (Million), by Price Trend Analysis 2025 & 2033
- Figure 35: Europe Plant Growth Chamber Market Revenue Share (%), by Price Trend Analysis 2025 & 2033
- Figure 36: Europe Plant Growth Chamber Market Revenue (Million), by Country 2025 & 2033
- Figure 37: Europe Plant Growth Chamber Market Revenue Share (%), by Country 2025 & 2033
- Figure 38: Middle East & Africa Plant Growth Chamber Market Revenue (Million), by Production Analysis 2025 & 2033
- Figure 39: Middle East & Africa Plant Growth Chamber Market Revenue Share (%), by Production Analysis 2025 & 2033
- Figure 40: Middle East & Africa Plant Growth Chamber Market Revenue (Million), by Consumption Analysis 2025 & 2033
- Figure 41: Middle East & Africa Plant Growth Chamber Market Revenue Share (%), by Consumption Analysis 2025 & 2033
- Figure 42: Middle East & Africa Plant Growth Chamber Market Revenue (Million), by Import Market Analysis (Value & Volume) 2025 & 2033
- Figure 43: Middle East & Africa Plant Growth Chamber Market Revenue Share (%), by Import Market Analysis (Value & Volume) 2025 & 2033
- Figure 44: Middle East & Africa Plant Growth Chamber Market Revenue (Million), by Export Market Analysis (Value & Volume) 2025 & 2033
- Figure 45: Middle East & Africa Plant Growth Chamber Market Revenue Share (%), by Export Market Analysis (Value & Volume) 2025 & 2033
- Figure 46: Middle East & Africa Plant Growth Chamber Market Revenue (Million), by Price Trend Analysis 2025 & 2033
- Figure 47: Middle East & Africa Plant Growth Chamber Market Revenue Share (%), by Price Trend Analysis 2025 & 2033
- Figure 48: Middle East & Africa Plant Growth Chamber Market Revenue (Million), by Country 2025 & 2033
- Figure 49: Middle East & Africa Plant Growth Chamber Market Revenue Share (%), by Country 2025 & 2033
- Figure 50: Asia Pacific Plant Growth Chamber Market Revenue (Million), by Production Analysis 2025 & 2033
- Figure 51: Asia Pacific Plant Growth Chamber Market Revenue Share (%), by Production Analysis 2025 & 2033
- Figure 52: Asia Pacific Plant Growth Chamber Market Revenue (Million), by Consumption Analysis 2025 & 2033
- Figure 53: Asia Pacific Plant Growth Chamber Market Revenue Share (%), by Consumption Analysis 2025 & 2033
- Figure 54: Asia Pacific Plant Growth Chamber Market Revenue (Million), by Import Market Analysis (Value & Volume) 2025 & 2033
- Figure 55: Asia Pacific Plant Growth Chamber Market Revenue Share (%), by Import Market Analysis (Value & Volume) 2025 & 2033
- Figure 56: Asia Pacific Plant Growth Chamber Market Revenue (Million), by Export Market Analysis (Value & Volume) 2025 & 2033
- Figure 57: Asia Pacific Plant Growth Chamber Market Revenue Share (%), by Export Market Analysis (Value & Volume) 2025 & 2033
- Figure 58: Asia Pacific Plant Growth Chamber Market Revenue (Million), by Price Trend Analysis 2025 & 2033
- Figure 59: Asia Pacific Plant Growth Chamber Market Revenue Share (%), by Price Trend Analysis 2025 & 2033
- Figure 60: Asia Pacific Plant Growth Chamber Market Revenue (Million), by Country 2025 & 2033
- Figure 61: Asia Pacific Plant Growth Chamber Market Revenue Share (%), by Country 2025 & 2033
List of Tables
- Table 1: Global Plant Growth Chamber Market Revenue Million Forecast, by Production Analysis 2020 & 2033
- Table 2: Global Plant Growth Chamber Market Revenue Million Forecast, by Consumption Analysis 2020 & 2033
- Table 3: Global Plant Growth Chamber Market Revenue Million Forecast, by Import Market Analysis (Value & Volume) 2020 & 2033
- Table 4: Global Plant Growth Chamber Market Revenue Million Forecast, by Export Market Analysis (Value & Volume) 2020 & 2033
- Table 5: Global Plant Growth Chamber Market Revenue Million Forecast, by Price Trend Analysis 2020 & 2033
- Table 6: Global Plant Growth Chamber Market Revenue Million Forecast, by Region 2020 & 2033
- Table 7: Global Plant Growth Chamber Market Revenue Million Forecast, by Production Analysis 2020 & 2033
- Table 8: Global Plant Growth Chamber Market Revenue Million Forecast, by Consumption Analysis 2020 & 2033
- Table 9: Global Plant Growth Chamber Market Revenue Million Forecast, by Import Market Analysis (Value & Volume) 2020 & 2033
- Table 10: Global Plant Growth Chamber Market Revenue Million Forecast, by Export Market Analysis (Value & Volume) 2020 & 2033
- Table 11: Global Plant Growth Chamber Market Revenue Million Forecast, by Price Trend Analysis 2020 & 2033
- Table 12: Global Plant Growth Chamber Market Revenue Million Forecast, by Country 2020 & 2033
- Table 13: United States Plant Growth Chamber Market Revenue (Million) Forecast, by Application 2020 & 2033
- Table 14: Canada Plant Growth Chamber Market Revenue (Million) Forecast, by Application 2020 & 2033
- Table 15: Mexico Plant Growth Chamber Market Revenue (Million) Forecast, by Application 2020 & 2033
- Table 16: Global Plant Growth Chamber Market Revenue Million Forecast, by Production Analysis 2020 & 2033
- Table 17: Global Plant Growth Chamber Market Revenue Million Forecast, by Consumption Analysis 2020 & 2033
- Table 18: Global Plant Growth Chamber Market Revenue Million Forecast, by Import Market Analysis (Value & Volume) 2020 & 2033
- Table 19: Global Plant Growth Chamber Market Revenue Million Forecast, by Export Market Analysis (Value & Volume) 2020 & 2033
- Table 20: Global Plant Growth Chamber Market Revenue Million Forecast, by Price Trend Analysis 2020 & 2033
- Table 21: Global Plant Growth Chamber Market Revenue Million Forecast, by Country 2020 & 2033
- Table 22: Brazil Plant Growth Chamber Market Revenue (Million) Forecast, by Application 2020 & 2033
- Table 23: Argentina Plant Growth Chamber Market Revenue (Million) Forecast, by Application 2020 & 2033
- Table 24: Rest of South America Plant Growth Chamber Market Revenue (Million) Forecast, by Application 2020 & 2033
- Table 25: Global Plant Growth Chamber Market Revenue Million Forecast, by Production Analysis 2020 & 2033
- Table 26: Global Plant Growth Chamber Market Revenue Million Forecast, by Consumption Analysis 2020 & 2033
- Table 27: Global Plant Growth Chamber Market Revenue Million Forecast, by Import Market Analysis (Value & Volume) 2020 & 2033
- Table 28: Global Plant Growth Chamber Market Revenue Million Forecast, by Export Market Analysis (Value & Volume) 2020 & 2033
- Table 29: Global Plant Growth Chamber Market Revenue Million Forecast, by Price Trend Analysis 2020 & 2033
- Table 30: Global Plant Growth Chamber Market Revenue Million Forecast, by Country 2020 & 2033
- Table 31: United Kingdom Plant Growth Chamber Market Revenue (Million) Forecast, by Application 2020 & 2033
- Table 32: Germany Plant Growth Chamber Market Revenue (Million) Forecast, by Application 2020 & 2033
- Table 33: France Plant Growth Chamber Market Revenue (Million) Forecast, by Application 2020 & 2033
- Table 34: Italy Plant Growth Chamber Market Revenue (Million) Forecast, by Application 2020 & 2033
- Table 35: Spain Plant Growth Chamber Market Revenue (Million) Forecast, by Application 2020 & 2033
- Table 36: Russia Plant Growth Chamber Market Revenue (Million) Forecast, by Application 2020 & 2033
- Table 37: Benelux Plant Growth Chamber Market Revenue (Million) Forecast, by Application 2020 & 2033
- Table 38: Nordics Plant Growth Chamber Market Revenue (Million) Forecast, by Application 2020 & 2033
- Table 39: Rest of Europe Plant Growth Chamber Market Revenue (Million) Forecast, by Application 2020 & 2033
- Table 40: Global Plant Growth Chamber Market Revenue Million Forecast, by Production Analysis 2020 & 2033
- Table 41: Global Plant Growth Chamber Market Revenue Million Forecast, by Consumption Analysis 2020 & 2033
- Table 42: Global Plant Growth Chamber Market Revenue Million Forecast, by Import Market Analysis (Value & Volume) 2020 & 2033
- Table 43: Global Plant Growth Chamber Market Revenue Million Forecast, by Export Market Analysis (Value & Volume) 2020 & 2033
- Table 44: Global Plant Growth Chamber Market Revenue Million Forecast, by Price Trend Analysis 2020 & 2033
- Table 45: Global Plant Growth Chamber Market Revenue Million Forecast, by Country 2020 & 2033
- Table 46: Turkey Plant Growth Chamber Market Revenue (Million) Forecast, by Application 2020 & 2033
- Table 47: Israel Plant Growth Chamber Market Revenue (Million) Forecast, by Application 2020 & 2033
- Table 48: GCC Plant Growth Chamber Market Revenue (Million) Forecast, by Application 2020 & 2033
- Table 49: North Africa Plant Growth Chamber Market Revenue (Million) Forecast, by Application 2020 & 2033
- Table 50: South Africa Plant Growth Chamber Market Revenue (Million) Forecast, by Application 2020 & 2033
- Table 51: Rest of Middle East & Africa Plant Growth Chamber Market Revenue (Million) Forecast, by Application 2020 & 2033
- Table 52: Global Plant Growth Chamber Market Revenue Million Forecast, by Production Analysis 2020 & 2033
- Table 53: Global Plant Growth Chamber Market Revenue Million Forecast, by Consumption Analysis 2020 & 2033
- Table 54: Global Plant Growth Chamber Market Revenue Million Forecast, by Import Market Analysis (Value & Volume) 2020 & 2033
- Table 55: Global Plant Growth Chamber Market Revenue Million Forecast, by Export Market Analysis (Value & Volume) 2020 & 2033
- Table 56: Global Plant Growth Chamber Market Revenue Million Forecast, by Price Trend Analysis 2020 & 2033
- Table 57: Global Plant Growth Chamber Market Revenue Million Forecast, by Country 2020 & 2033
- Table 58: China Plant Growth Chamber Market Revenue (Million) Forecast, by Application 2020 & 2033
- Table 59: India Plant Growth Chamber Market Revenue (Million) Forecast, by Application 2020 & 2033
- Table 60: Japan Plant Growth Chamber Market Revenue (Million) Forecast, by Application 2020 & 2033
- Table 61: South Korea Plant Growth Chamber Market Revenue (Million) Forecast, by Application 2020 & 2033
- Table 62: ASEAN Plant Growth Chamber Market Revenue (Million) Forecast, by Application 2020 & 2033
- Table 63: Oceania Plant Growth Chamber Market Revenue (Million) Forecast, by Application 2020 & 2033
- Table 64: Rest of Asia Pacific Plant Growth Chamber Market Revenue (Million) Forecast, by Application 2020 & 2033
Frequently Asked Questions
1. What is the projected Compound Annual Growth Rate (CAGR) of the Plant Growth Chamber Market?
The projected CAGR is approximately 4.70%.
2. Which companies are prominent players in the Plant Growth Chamber Market?
Key companies in the market include Weiss Techni, Darwin Chambers, Thermo Fisher, CARON Products & Services Inc, Conviron, Aralab, Percival Scientific Inc, Brs Bvba, BINDER GmbH, Hettich Benelux BV, Saveer Biotech Limited, Freezers India.
3. What are the main segments of the Plant Growth Chamber Market?
The market segments include Production Analysis, Consumption Analysis, Import Market Analysis (Value & Volume), Export Market Analysis (Value & Volume), Price Trend Analysis.
4. Can you provide details about the market size?
The market size is estimated to be USD 486.60 Million as of 2022.
5. What are some drivers contributing to market growth?
Seed Treatment As A Solution To Enhance Yield; Growing Awareness For Seed Treatment Among The Farmers; Rising Trend Of Organic Farming.
6. What are the notable trends driving market growth?
Increasing Demand for Food and Decreasing Arable Land.
7. Are there any restraints impacting market growth?
Limitations Across Farm-Level Seed Treatment; Rising Environmental Concerns.
8. Can you provide examples of recent developments in the market?
January 2022: Conviron launched a new EVO series of plant growth chambers, featuring a range of LE intensities, delivering a high degree of spatial uniformity for plant growth suitable for both short, medium, and tall plants.
9. What pricing options are available for accessing the report?
Pricing options include single-user, multi-user, and enterprise licenses priced at USD 4750, USD 5250, and USD 8750 respectively.
10. Is the market size provided in terms of value or volume?
The market size is provided in terms of value, measured in Million.
11. Are there any specific market keywords associated with the report?
Yes, the market keyword associated with the report is "Plant Growth Chamber Market," which aids in identifying and referencing the specific market segment covered.
12. How do I determine which pricing option suits my needs best?
The pricing options vary based on user requirements and access needs. Individual users may opt for single-user licenses, while businesses requiring broader access may choose multi-user or enterprise licenses for cost-effective access to the report.
13. Are there any additional resources or data provided in the Plant Growth Chamber Market report?
While the report offers comprehensive insights, it's advisable to review the specific contents or supplementary materials provided to ascertain if additional resources or data are available.
14. How can I stay updated on further developments or reports in the Plant Growth Chamber Market?
To stay informed about further developments, trends, and reports in the Plant Growth Chamber Market, consider subscribing to industry newsletters, following relevant companies and organizations, or regularly checking reputable industry news sources and publications.
Methodology
Step 1 - Identification of Relevant Samples Size from Population Database


Step 2 - Approaches for Defining Global Market Size (Value, Volume* & Price*)

Note*: In applicable scenarios
Step 3 - Data Sources
Primary Research
- Web Analytics
- Survey Reports
- Research Institute
- Latest Research Reports
- Opinion Leaders
Secondary Research
- Annual Reports
- White Paper
- Latest Press Release
- Industry Association
- Paid Database
- Investor Presentations

Step 4 - Data Triangulation
Involves using different sources of information in order to increase the validity of a study
These sources are likely to be stakeholders in a program - participants, other researchers, program staff, other community members, and so on.
Then we put all data in single framework & apply various statistical tools to find out the dynamic on the market.
During the analysis stage, feedback from the stakeholder groups would be compared to determine areas of agreement as well as areas of divergence