

Key Insights
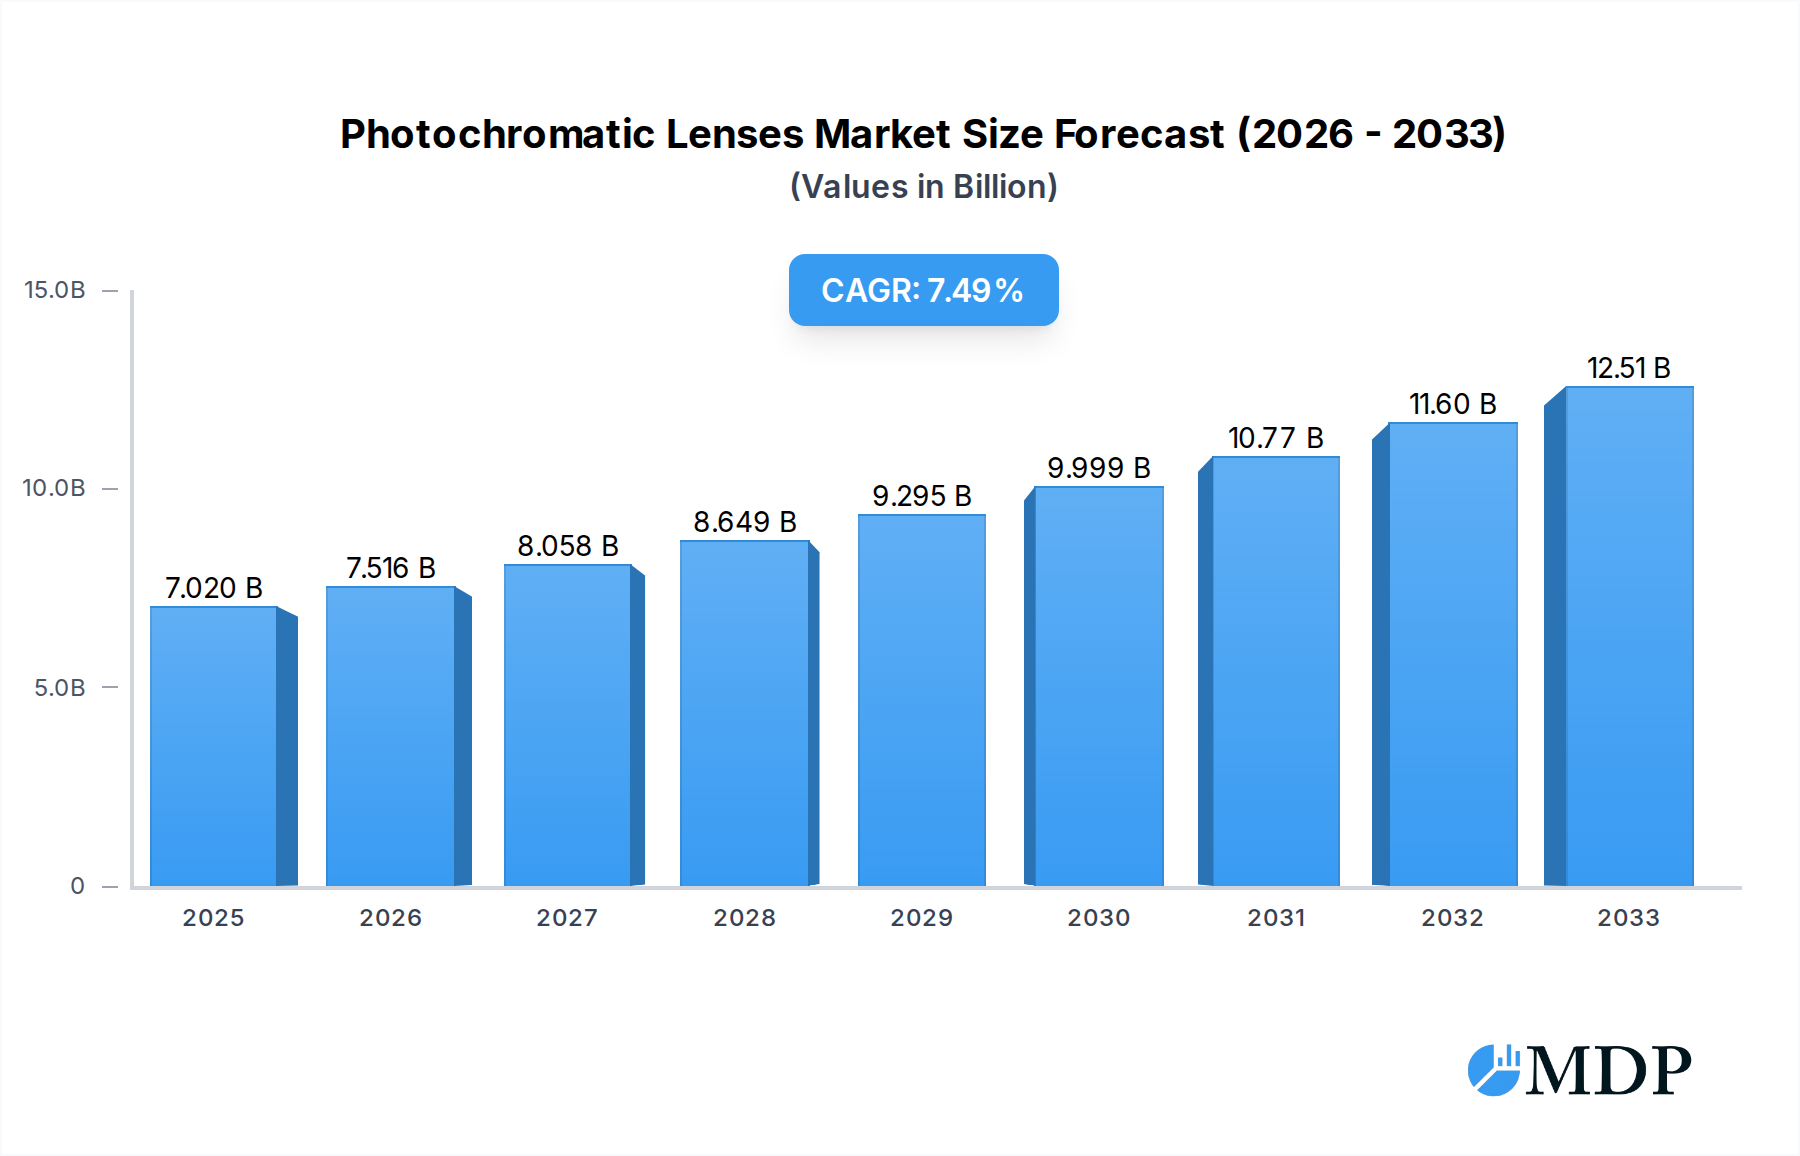
The global photochromic lenses market is poised for robust expansion, projected to reach USD 7.02 billion in 2025 and experience a significant Compound Annual Growth Rate (CAGR) of 7.2%. This dynamic growth is fueled by an increasing awareness of eye health, a rising prevalence of eye conditions, and a growing demand for convenient and comfortable eyewear solutions that adapt to varying light conditions. Technological advancements in lens materials and coatings are continuously enhancing the performance of photochromic lenses, offering faster activation and deactivation times, as well as improved clarity and color consistency. The market is experiencing a notable shift towards online sales channels, driven by the convenience of e-commerce and the ability for consumers to access a wider variety of products and brands. This digital transformation, coupled with increasing disposable incomes and a focus on personal well-being, further propels the market's upward trajectory.

Photochromatic Lenses Market Size (In Billion)
Despite the optimistic outlook, the market faces certain restraints, including the relatively higher cost of photochromic lenses compared to conventional ones, which can be a barrier for price-sensitive consumers. Additionally, varying performance across different temperature ranges and UV exposure levels can sometimes impact consumer satisfaction. However, these challenges are being actively addressed through ongoing research and development aimed at improving cost-effectiveness and performance consistency. The market segmentation reveals a diverse range of lens types catering to specific visual needs and preferences, with applications spanning both online and offline sales channels. Key players are actively investing in innovation and strategic collaborations to expand their market reach and capitalize on emerging opportunities in both developed and developing economies, particularly in the Asia Pacific region, which is showing substantial growth potential.
Photochromatic Lenses Company Market Share
Comprehensive Analysis of the Global Photochromic Lenses Market: Trends, Opportunities, and Strategic Outlook (2019-2033)
This in-depth report offers a definitive exploration of the global photochromic lenses market, providing critical insights for industry stakeholders, investors, and strategic planners. Spanning from 2019 to 2033, with a base year of 2025, this comprehensive analysis delves into market dynamics, emerging trends, leading segments, and future growth trajectories. Leveraging high-traffic keywords such as "photochromic lenses market," "adaptive lenses," "variable tint lenses," "smart eyewear technology," and "ophthalmic lens industry," this report is meticulously crafted for maximum search visibility and actionable intelligence.
Photochromatic Lenses Market Dynamics & Concentration
The photochromic lenses market is characterized by a moderate to high level of concentration, with a few key players dominating a significant portion of the global market share, estimated at over 70 billion USD. Innovation is a primary driver, fueled by ongoing research and development into faster darkening and fading times, enhanced UV protection, and compatibility with digital devices. Regulatory frameworks, while generally supportive of eye health, can introduce complexities in terms of product approvals and material standards, impacting market entry for new entrants. Product substitutes, such as prescription sunglasses and separate UV-blocking coatings, pose a constant competitive pressure. End-user trends are shifting towards convenience and personalization, with increasing demand for lenses that adapt seamlessly to varying light conditions and offer comprehensive eye protection. Merger and acquisition (M&A) activities have been a notable feature, with approximately 5 major M&A deals valued at over 2 billion USD recorded within the historical period, aimed at consolidating market share, acquiring innovative technologies, and expanding global distribution networks.
Photochromatic Lenses Industry Trends & Analysis
The photochromic lenses industry is poised for robust growth, projected to achieve a Compound Annual Growth Rate (CAGR) of approximately 8.5% over the forecast period. This expansion is predominantly driven by increasing awareness of eye health and the detrimental effects of UV radiation, coupled with a rising disposable income globally, enabling consumers to invest in premium ophthalmic solutions. Technological advancements are at the forefront of industry evolution. Innovations such as the integration of photochromic properties into a wider range of lens materials, including high-index and polycarbonate, alongside the development of faster-reacting and more durable photochromic dyes, are significantly enhancing product performance and consumer appeal. The growing prevalence of digital eye strain has also spurred demand for lenses offering superior blue light filtering capabilities in conjunction with photochromic technology. Consumer preferences are increasingly leaning towards convenience and multifuncionality. Photochromic lenses offer a compelling solution by eliminating the need to switch between prescription glasses and sunglasses. This trend is further amplified by a growing young demographic and a proactive approach to eye care across all age groups. Competitive dynamics within the market are intense, with established players investing heavily in R&D and marketing to differentiate their offerings. Emerging markets, particularly in Asia-Pacific, represent a significant growth frontier, driven by rapid urbanization and increasing access to healthcare and vision correction services. The market penetration of photochromic lenses, while substantial in developed economies, still holds significant untapped potential in developing regions, offering substantial opportunities for market expansion.
Leading Markets & Segments in Photochromatic Lenses
The dominance within the photochromic lenses market is largely dictated by regional economic strength, healthcare infrastructure, and consumer spending power. North America and Europe currently hold the leading market positions, driven by high per capita income, well-established optical retail networks, and a well-informed consumer base prioritizing advanced vision care solutions. The Offline Sales segment continues to be the dominant application, accounting for an estimated 85% of the total market revenue, due to the reliance on opticians for precise fitting, consultation, and personalized recommendations. However, the Online Sales segment is experiencing a rapid growth trajectory, projected to capture a market share of over 20 billion USD by 2033, fueled by the convenience, competitive pricing, and accessibility offered by e-commerce platforms.
Within the Types segment, lenses with a prescription range of -6.00~+6.00 represent the largest and most mature market. This is attributed to the high prevalence of common refractive errors falling within this range, making them the most widely prescribed and purchased photochromic lenses. The market for -8.00~+6.00 and -10.00~+6.00 is also significant and is projected to witness substantial growth as advancements in lens manufacturing allow for thinner and lighter lenses even with higher prescriptions, addressing the needs of a growing population with moderate to high myopia. The -15.00~+6.00 segment, while niche, is also expected to see steady growth, driven by specialized lens designs and the increasing availability of custom-made solutions for individuals with severe refractive errors. Key drivers for dominance in these segments include:
- Economic Policies: Favorable healthcare policies and disposable income levels directly influence consumer purchasing power for premium ophthalmic products.
- Infrastructure: The extensive network of optical retail stores and dispensing opticians in developed regions facilitates the widespread adoption of photochromic lenses.
- Consumer Education: Increased awareness campaigns by health organizations and manufacturers regarding the benefits of UV protection and adaptive eyewear drive demand.
- Technological Advancements: Continuous improvements in lens materials and photochromic technology cater to a broader range of prescription needs and enhance product performance.
- Aging Population: The global demographic shift towards an aging population, often experiencing presbyopia and other vision ailments, contributes to the demand for multifocal and adaptive lens solutions.
Photochromatic Lenses Product Developments
Recent product developments in photochromic lenses are revolutionizing the ophthalmic industry. Innovations focus on accelerated darkening and fading speeds, enhanced responsiveness to different light sources (including indoor artificial light), and improved durability against scratches and environmental factors. Furthermore, the integration of photochromic technology with blue-light filtering capabilities is a significant trend, offering comprehensive eye protection against digital screen strain and UV radiation. Competitive advantages are being carved out through material science advancements, leading to thinner, lighter, and more aesthetically pleasing lenses across a wider range of prescriptions, including higher diopter values.
Key Drivers of Photochromatic Lenses Growth
The growth of the photochromic lenses market is propelled by several key drivers. Technologically, ongoing advancements in photochromic dye chemistry and encapsulation techniques are leading to lenses that are faster, more consistent, and more reliable. Economically, rising disposable incomes globally, particularly in emerging economies, are making premium eyewear solutions more accessible. Regulatory support for eye health initiatives and increasing mandates for UV protection also contribute to market expansion. The growing awareness among consumers about the long-term benefits of protecting their eyes from harmful UV radiation and the convenience offered by adaptive lenses are significant market catalysts.
Challenges in the Photochromatic Lenses Market
Despite its growth potential, the photochromic lenses market faces several challenges. Regulatory hurdles in certain regions regarding material approvals and labeling can slow down market entry. Supply chain disruptions, as seen in recent global events, can impact the availability and cost of raw materials and finished products. Intense competitive pressures from manufacturers of conventional lenses and lower-cost alternatives can also restrain market growth. Furthermore, a segment of the consumer base remains price-sensitive, requiring continuous efforts to demonstrate the long-term value and benefits of investing in photochromic technology.
Emerging Opportunities in Photochromatic Lenses
Emerging opportunities in the photochromic lenses market are largely driven by technological breakthroughs and strategic market expansion. The development of "smart" photochromic lenses, capable of adapting to personalized light preferences or integrating with wearable technology, presents a significant future growth avenue. Strategic partnerships between lens manufacturers and eyewear brands are fostering innovation and expanding consumer reach. Furthermore, significant untapped potential exists in emerging markets, where increasing healthcare awareness and rising disposable incomes are creating a burgeoning demand for advanced vision correction solutions.
Leading Players in the Photochromatic Lenses Sector
- WeeTect
- VISION EASE
- Jiangsu Aogang Optical Glasses Co.,Ltd.
- Danyang Boris Optical Co.,Ltd
- Hopesun
- OPTICOM
- Transitions Optical,Inc.
- Bod Lenses
- Younger Optics
- Zhenjiang Kingway Optical Company
Key Milestones in Photochromatic Lenses Industry
- 2019: Introduction of next-generation photochromic dyes offering faster fading and darkening in specific product lines.
- 2020: Increased focus on integrating blue-light filtering with photochromic technology driven by growing screen time.
- 2021: Major players announce strategic investments in R&D for enhanced photochromic performance and broader prescription compatibility.
- 2022: Rise in online sales channels for photochromic lenses, expanding accessibility for consumers globally.
- 2023: Launch of new photochromic lens materials offering superior scratch resistance and enhanced clarity.
Strategic Outlook for Photochromatic Lenses Market
The strategic outlook for the photochromic lenses market is highly optimistic, driven by continuous innovation and increasing consumer demand for advanced vision care. Key growth accelerators include the ongoing development of more sophisticated photochromic technologies that offer enhanced responsiveness and personalization. Strategic opportunities lie in expanding market penetration in developing economies, forging partnerships with technology companies for smart eyewear integration, and educating consumers about the comprehensive eye health benefits of adaptive lenses, promising substantial future market potential.
Photochromatic Lenses Segmentation
-
1. Application
- 1.1. Online Sales
- 1.2. Offline Sales
-
2. Types
- 2.1. -6.00~+6.00
- 2.2. -8.00~+6.00
- 2.3. 10.00~+6.00
- 2.4. -15.00~+6.00
Photochromatic Lenses Segmentation By Geography
-
1. North America
- 1.1. United States
- 1.2. Canada
- 1.3. Mexico
-
2. South America
- 2.1. Brazil
- 2.2. Argentina
- 2.3. Rest of South America
-
3. Europe
- 3.1. United Kingdom
- 3.2. Germany
- 3.3. France
- 3.4. Italy
- 3.5. Spain
- 3.6. Russia
- 3.7. Benelux
- 3.8. Nordics
- 3.9. Rest of Europe
-
4. Middle East & Africa
- 4.1. Turkey
- 4.2. Israel
- 4.3. GCC
- 4.4. North Africa
- 4.5. South Africa
- 4.6. Rest of Middle East & Africa
-
5. Asia Pacific
- 5.1. China
- 5.2. India
- 5.3. Japan
- 5.4. South Korea
- 5.5. ASEAN
- 5.6. Oceania
- 5.7. Rest of Asia Pacific
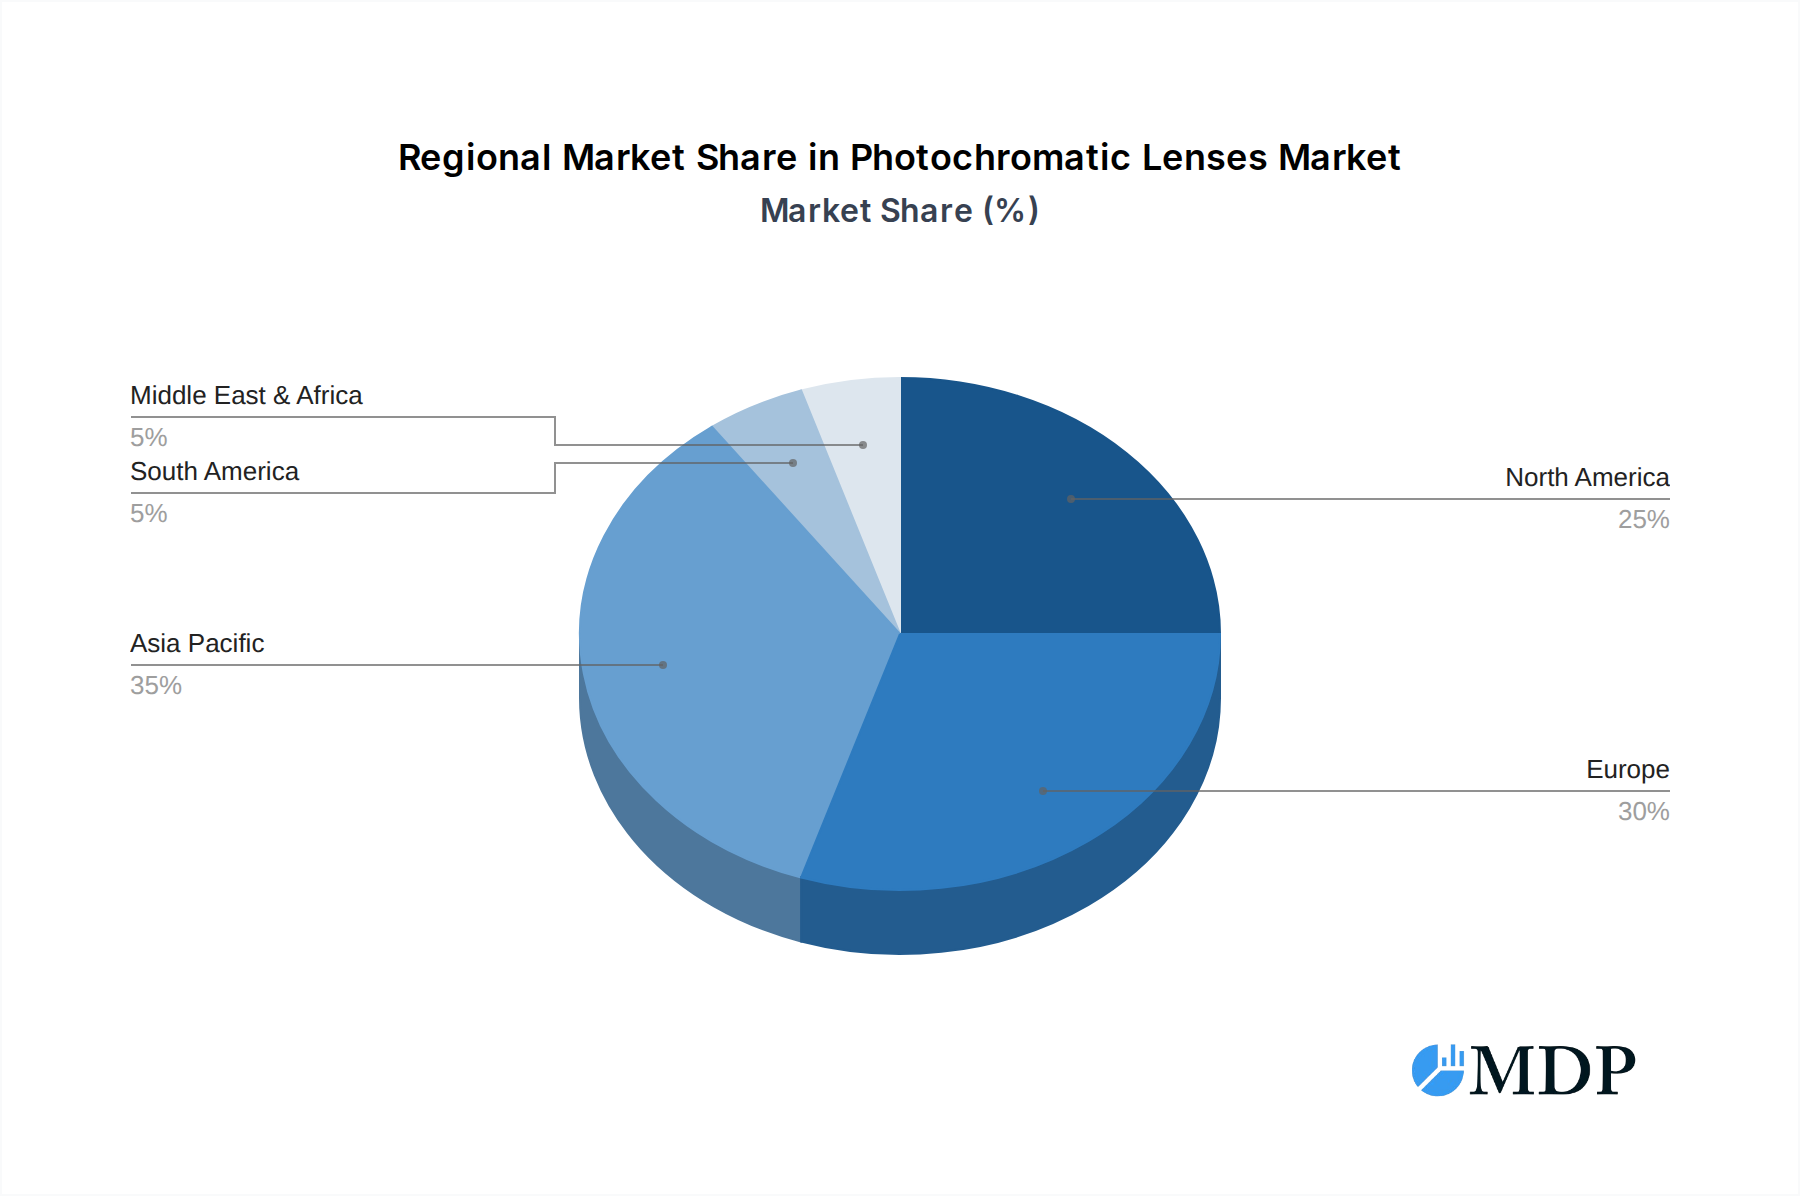
Photochromatic Lenses Regional Market Share
Geographic Coverage of Photochromatic Lenses
Photochromatic Lenses REPORT HIGHLIGHTS
| Aspects | Details |
|---|---|
| Study Period | 2020-2034 |
| Base Year | 2025 |
| Estimated Year | 2026 |
| Forecast Period | 2026-2034 |
| Historical Period | 2020-2025 |
| Growth Rate | CAGR of 7.6% from 2020-2034 |
| Segmentation |
|
Table of Contents
- 1. Introduction
- 1.1. Research Scope
- 1.2. Market Segmentation
- 1.3. Research Objective
- 1.4. Definitions and Assumptions
- 2. Executive Summary
- 2.1. Market Snapshot
- 3. Market Dynamics
- 3.1. Market Drivers
- 3.2. Market Restrains
- 3.3. Market Trends
- 3.4. Market Opportunities
- 4. Market Factor Analysis
- 4.1. Porters Five Forces
- 4.1.1. Bargaining Power of Suppliers
- 4.1.2. Bargaining Power of Buyers
- 4.1.3. Threat of New Entrants
- 4.1.4. Threat of Substitutes
- 4.1.5. Competitive Rivalry
- 4.2. PESTEL analysis
- 4.3. BCG Analysis
- 4.3.1. Stars (High Growth, High Market Share)
- 4.3.2. Cash Cows (Low Growth, High Market Share)
- 4.3.3. Question Mark (High Growth, Low Market Share)
- 4.3.4. Dogs (Low Growth, Low Market Share)
- 4.4. Ansoff Matrix Analysis
- 4.5. Supply Chain Analysis
- 4.6. Regulatory Landscape
- 4.7. Current Market Potential and Opportunity Assessment (TAM–SAM–SOM Framework)
- 4.8. MDP Analyst Note
- 4.1. Porters Five Forces
- 5. Market Analysis, Insights and Forecast 2021-2033
- 5.1. Market Analysis, Insights and Forecast - by Application
- 5.1.1. Online Sales
- 5.1.2. Offline Sales
- 5.2. Market Analysis, Insights and Forecast - by Types
- 5.2.1. -6.00~+6.00
- 5.2.2. -8.00~+6.00
- 5.2.3. 10.00~+6.00
- 5.2.4. -15.00~+6.00
- 5.3. Market Analysis, Insights and Forecast - by Region
- 5.3.1. North America
- 5.3.2. South America
- 5.3.3. Europe
- 5.3.4. Middle East & Africa
- 5.3.5. Asia Pacific
- 5.1. Market Analysis, Insights and Forecast - by Application
- 6. Global Photochromatic Lenses Analysis, Insights and Forecast, 2021-2033
- 6.1. Market Analysis, Insights and Forecast - by Application
- 6.1.1. Online Sales
- 6.1.2. Offline Sales
- 6.2. Market Analysis, Insights and Forecast - by Types
- 6.2.1. -6.00~+6.00
- 6.2.2. -8.00~+6.00
- 6.2.3. 10.00~+6.00
- 6.2.4. -15.00~+6.00
- 6.1. Market Analysis, Insights and Forecast - by Application
- 7. North America Photochromatic Lenses Analysis, Insights and Forecast, 2020-2032
- 7.1. Market Analysis, Insights and Forecast - by Application
- 7.1.1. Online Sales
- 7.1.2. Offline Sales
- 7.2. Market Analysis, Insights and Forecast - by Types
- 7.2.1. -6.00~+6.00
- 7.2.2. -8.00~+6.00
- 7.2.3. 10.00~+6.00
- 7.2.4. -15.00~+6.00
- 7.1. Market Analysis, Insights and Forecast - by Application
- 8. South America Photochromatic Lenses Analysis, Insights and Forecast, 2020-2032
- 8.1. Market Analysis, Insights and Forecast - by Application
- 8.1.1. Online Sales
- 8.1.2. Offline Sales
- 8.2. Market Analysis, Insights and Forecast - by Types
- 8.2.1. -6.00~+6.00
- 8.2.2. -8.00~+6.00
- 8.2.3. 10.00~+6.00
- 8.2.4. -15.00~+6.00
- 8.1. Market Analysis, Insights and Forecast - by Application
- 9. Europe Photochromatic Lenses Analysis, Insights and Forecast, 2020-2032
- 9.1. Market Analysis, Insights and Forecast - by Application
- 9.1.1. Online Sales
- 9.1.2. Offline Sales
- 9.2. Market Analysis, Insights and Forecast - by Types
- 9.2.1. -6.00~+6.00
- 9.2.2. -8.00~+6.00
- 9.2.3. 10.00~+6.00
- 9.2.4. -15.00~+6.00
- 9.1. Market Analysis, Insights and Forecast - by Application
- 10. Middle East & Africa Photochromatic Lenses Analysis, Insights and Forecast, 2020-2032
- 10.1. Market Analysis, Insights and Forecast - by Application
- 10.1.1. Online Sales
- 10.1.2. Offline Sales
- 10.2. Market Analysis, Insights and Forecast - by Types
- 10.2.1. -6.00~+6.00
- 10.2.2. -8.00~+6.00
- 10.2.3. 10.00~+6.00
- 10.2.4. -15.00~+6.00
- 10.1. Market Analysis, Insights and Forecast - by Application
- 11. Asia Pacific Photochromatic Lenses Analysis, Insights and Forecast, 2020-2032
- 11.1. Market Analysis, Insights and Forecast - by Application
- 11.1.1. Online Sales
- 11.1.2. Offline Sales
- 11.2. Market Analysis, Insights and Forecast - by Types
- 11.2.1. -6.00~+6.00
- 11.2.2. -8.00~+6.00
- 11.2.3. 10.00~+6.00
- 11.2.4. -15.00~+6.00
- 11.1. Market Analysis, Insights and Forecast - by Application
- 12. Competitive Analysis
- 12.1. Company Profiles
- 12.1.1 WeeTect
- 12.1.1.1. Company Overview
- 12.1.1.2. Products
- 12.1.1.3. Company Financials
- 12.1.1.4. SWOT Analysis
- 12.1.2 VISION EASE
- 12.1.2.1. Company Overview
- 12.1.2.2. Products
- 12.1.2.3. Company Financials
- 12.1.2.4. SWOT Analysis
- 12.1.3 Jiangsu Aogang Optical Glasses Co.
- 12.1.3.1. Company Overview
- 12.1.3.2. Products
- 12.1.3.3. Company Financials
- 12.1.3.4. SWOT Analysis
- 12.1.4 Ltd.
- 12.1.4.1. Company Overview
- 12.1.4.2. Products
- 12.1.4.3. Company Financials
- 12.1.4.4. SWOT Analysis
- 12.1.5 Danyang Boris Optical Co.
- 12.1.5.1. Company Overview
- 12.1.5.2. Products
- 12.1.5.3. Company Financials
- 12.1.5.4. SWOT Analysis
- 12.1.6 Ltd
- 12.1.6.1. Company Overview
- 12.1.6.2. Products
- 12.1.6.3. Company Financials
- 12.1.6.4. SWOT Analysis
- 12.1.7 Hopesun
- 12.1.7.1. Company Overview
- 12.1.7.2. Products
- 12.1.7.3. Company Financials
- 12.1.7.4. SWOT Analysis
- 12.1.8 OPTICOM
- 12.1.8.1. Company Overview
- 12.1.8.2. Products
- 12.1.8.3. Company Financials
- 12.1.8.4. SWOT Analysis
- 12.1.9 Transitions Optical
- 12.1.9.1. Company Overview
- 12.1.9.2. Products
- 12.1.9.3. Company Financials
- 12.1.9.4. SWOT Analysis
- 12.1.10 Inc.
- 12.1.10.1. Company Overview
- 12.1.10.2. Products
- 12.1.10.3. Company Financials
- 12.1.10.4. SWOT Analysis
- 12.1.11 Bod Lenses
- 12.1.11.1. Company Overview
- 12.1.11.2. Products
- 12.1.11.3. Company Financials
- 12.1.11.4. SWOT Analysis
- 12.1.12 Younger Optics
- 12.1.12.1. Company Overview
- 12.1.12.2. Products
- 12.1.12.3. Company Financials
- 12.1.12.4. SWOT Analysis
- 12.1.13 Zhenjiang Kingway Optical Company
- 12.1.13.1. Company Overview
- 12.1.13.2. Products
- 12.1.13.3. Company Financials
- 12.1.13.4. SWOT Analysis
- 12.1.1 WeeTect
- 12.2. Market Entropy
- 12.2.1 Company's Key Areas Served
- 12.2.2 Recent Developments
- 12.3. Company Market Share Analysis 2025
- 12.3.1 Top 5 Companies Market Share Analysis
- 12.3.2 Top 3 Companies Market Share Analysis
- 12.4. List of Potential Customers
- 13. Research Methodology
List of Figures
- Figure 1: Global Photochromatic Lenses Revenue Breakdown (million, %) by Region 2025 & 2033
- Figure 2: Global Photochromatic Lenses Volume Breakdown (K, %) by Region 2025 & 2033
- Figure 3: North America Photochromatic Lenses Revenue (million), by Application 2025 & 2033
- Figure 4: North America Photochromatic Lenses Volume (K), by Application 2025 & 2033
- Figure 5: North America Photochromatic Lenses Revenue Share (%), by Application 2025 & 2033
- Figure 6: North America Photochromatic Lenses Volume Share (%), by Application 2025 & 2033
- Figure 7: North America Photochromatic Lenses Revenue (million), by Types 2025 & 2033
- Figure 8: North America Photochromatic Lenses Volume (K), by Types 2025 & 2033
- Figure 9: North America Photochromatic Lenses Revenue Share (%), by Types 2025 & 2033
- Figure 10: North America Photochromatic Lenses Volume Share (%), by Types 2025 & 2033
- Figure 11: North America Photochromatic Lenses Revenue (million), by Country 2025 & 2033
- Figure 12: North America Photochromatic Lenses Volume (K), by Country 2025 & 2033
- Figure 13: North America Photochromatic Lenses Revenue Share (%), by Country 2025 & 2033
- Figure 14: North America Photochromatic Lenses Volume Share (%), by Country 2025 & 2033
- Figure 15: South America Photochromatic Lenses Revenue (million), by Application 2025 & 2033
- Figure 16: South America Photochromatic Lenses Volume (K), by Application 2025 & 2033
- Figure 17: South America Photochromatic Lenses Revenue Share (%), by Application 2025 & 2033
- Figure 18: South America Photochromatic Lenses Volume Share (%), by Application 2025 & 2033
- Figure 19: South America Photochromatic Lenses Revenue (million), by Types 2025 & 2033
- Figure 20: South America Photochromatic Lenses Volume (K), by Types 2025 & 2033
- Figure 21: South America Photochromatic Lenses Revenue Share (%), by Types 2025 & 2033
- Figure 22: South America Photochromatic Lenses Volume Share (%), by Types 2025 & 2033
- Figure 23: South America Photochromatic Lenses Revenue (million), by Country 2025 & 2033
- Figure 24: South America Photochromatic Lenses Volume (K), by Country 2025 & 2033
- Figure 25: South America Photochromatic Lenses Revenue Share (%), by Country 2025 & 2033
- Figure 26: South America Photochromatic Lenses Volume Share (%), by Country 2025 & 2033
- Figure 27: Europe Photochromatic Lenses Revenue (million), by Application 2025 & 2033
- Figure 28: Europe Photochromatic Lenses Volume (K), by Application 2025 & 2033
- Figure 29: Europe Photochromatic Lenses Revenue Share (%), by Application 2025 & 2033
- Figure 30: Europe Photochromatic Lenses Volume Share (%), by Application 2025 & 2033
- Figure 31: Europe Photochromatic Lenses Revenue (million), by Types 2025 & 2033
- Figure 32: Europe Photochromatic Lenses Volume (K), by Types 2025 & 2033
- Figure 33: Europe Photochromatic Lenses Revenue Share (%), by Types 2025 & 2033
- Figure 34: Europe Photochromatic Lenses Volume Share (%), by Types 2025 & 2033
- Figure 35: Europe Photochromatic Lenses Revenue (million), by Country 2025 & 2033
- Figure 36: Europe Photochromatic Lenses Volume (K), by Country 2025 & 2033
- Figure 37: Europe Photochromatic Lenses Revenue Share (%), by Country 2025 & 2033
- Figure 38: Europe Photochromatic Lenses Volume Share (%), by Country 2025 & 2033
- Figure 39: Middle East & Africa Photochromatic Lenses Revenue (million), by Application 2025 & 2033
- Figure 40: Middle East & Africa Photochromatic Lenses Volume (K), by Application 2025 & 2033
- Figure 41: Middle East & Africa Photochromatic Lenses Revenue Share (%), by Application 2025 & 2033
- Figure 42: Middle East & Africa Photochromatic Lenses Volume Share (%), by Application 2025 & 2033
- Figure 43: Middle East & Africa Photochromatic Lenses Revenue (million), by Types 2025 & 2033
- Figure 44: Middle East & Africa Photochromatic Lenses Volume (K), by Types 2025 & 2033
- Figure 45: Middle East & Africa Photochromatic Lenses Revenue Share (%), by Types 2025 & 2033
- Figure 46: Middle East & Africa Photochromatic Lenses Volume Share (%), by Types 2025 & 2033
- Figure 47: Middle East & Africa Photochromatic Lenses Revenue (million), by Country 2025 & 2033
- Figure 48: Middle East & Africa Photochromatic Lenses Volume (K), by Country 2025 & 2033
- Figure 49: Middle East & Africa Photochromatic Lenses Revenue Share (%), by Country 2025 & 2033
- Figure 50: Middle East & Africa Photochromatic Lenses Volume Share (%), by Country 2025 & 2033
- Figure 51: Asia Pacific Photochromatic Lenses Revenue (million), by Application 2025 & 2033
- Figure 52: Asia Pacific Photochromatic Lenses Volume (K), by Application 2025 & 2033
- Figure 53: Asia Pacific Photochromatic Lenses Revenue Share (%), by Application 2025 & 2033
- Figure 54: Asia Pacific Photochromatic Lenses Volume Share (%), by Application 2025 & 2033
- Figure 55: Asia Pacific Photochromatic Lenses Revenue (million), by Types 2025 & 2033
- Figure 56: Asia Pacific Photochromatic Lenses Volume (K), by Types 2025 & 2033
- Figure 57: Asia Pacific Photochromatic Lenses Revenue Share (%), by Types 2025 & 2033
- Figure 58: Asia Pacific Photochromatic Lenses Volume Share (%), by Types 2025 & 2033
- Figure 59: Asia Pacific Photochromatic Lenses Revenue (million), by Country 2025 & 2033
- Figure 60: Asia Pacific Photochromatic Lenses Volume (K), by Country 2025 & 2033
- Figure 61: Asia Pacific Photochromatic Lenses Revenue Share (%), by Country 2025 & 2033
- Figure 62: Asia Pacific Photochromatic Lenses Volume Share (%), by Country 2025 & 2033
List of Tables
- Table 1: Global Photochromatic Lenses Revenue million Forecast, by Application 2020 & 2033
- Table 2: Global Photochromatic Lenses Volume K Forecast, by Application 2020 & 2033
- Table 3: Global Photochromatic Lenses Revenue million Forecast, by Types 2020 & 2033
- Table 4: Global Photochromatic Lenses Volume K Forecast, by Types 2020 & 2033
- Table 5: Global Photochromatic Lenses Revenue million Forecast, by Region 2020 & 2033
- Table 6: Global Photochromatic Lenses Volume K Forecast, by Region 2020 & 2033
- Table 7: Global Photochromatic Lenses Revenue million Forecast, by Application 2020 & 2033
- Table 8: Global Photochromatic Lenses Volume K Forecast, by Application 2020 & 2033
- Table 9: Global Photochromatic Lenses Revenue million Forecast, by Types 2020 & 2033
- Table 10: Global Photochromatic Lenses Volume K Forecast, by Types 2020 & 2033
- Table 11: Global Photochromatic Lenses Revenue million Forecast, by Country 2020 & 2033
- Table 12: Global Photochromatic Lenses Volume K Forecast, by Country 2020 & 2033
- Table 13: United States Photochromatic Lenses Revenue (million) Forecast, by Application 2020 & 2033
- Table 14: United States Photochromatic Lenses Volume (K) Forecast, by Application 2020 & 2033
- Table 15: Canada Photochromatic Lenses Revenue (million) Forecast, by Application 2020 & 2033
- Table 16: Canada Photochromatic Lenses Volume (K) Forecast, by Application 2020 & 2033
- Table 17: Mexico Photochromatic Lenses Revenue (million) Forecast, by Application 2020 & 2033
- Table 18: Mexico Photochromatic Lenses Volume (K) Forecast, by Application 2020 & 2033
- Table 19: Global Photochromatic Lenses Revenue million Forecast, by Application 2020 & 2033
- Table 20: Global Photochromatic Lenses Volume K Forecast, by Application 2020 & 2033
- Table 21: Global Photochromatic Lenses Revenue million Forecast, by Types 2020 & 2033
- Table 22: Global Photochromatic Lenses Volume K Forecast, by Types 2020 & 2033
- Table 23: Global Photochromatic Lenses Revenue million Forecast, by Country 2020 & 2033
- Table 24: Global Photochromatic Lenses Volume K Forecast, by Country 2020 & 2033
- Table 25: Brazil Photochromatic Lenses Revenue (million) Forecast, by Application 2020 & 2033
- Table 26: Brazil Photochromatic Lenses Volume (K) Forecast, by Application 2020 & 2033
- Table 27: Argentina Photochromatic Lenses Revenue (million) Forecast, by Application 2020 & 2033
- Table 28: Argentina Photochromatic Lenses Volume (K) Forecast, by Application 2020 & 2033
- Table 29: Rest of South America Photochromatic Lenses Revenue (million) Forecast, by Application 2020 & 2033
- Table 30: Rest of South America Photochromatic Lenses Volume (K) Forecast, by Application 2020 & 2033
- Table 31: Global Photochromatic Lenses Revenue million Forecast, by Application 2020 & 2033
- Table 32: Global Photochromatic Lenses Volume K Forecast, by Application 2020 & 2033
- Table 33: Global Photochromatic Lenses Revenue million Forecast, by Types 2020 & 2033
- Table 34: Global Photochromatic Lenses Volume K Forecast, by Types 2020 & 2033
- Table 35: Global Photochromatic Lenses Revenue million Forecast, by Country 2020 & 2033
- Table 36: Global Photochromatic Lenses Volume K Forecast, by Country 2020 & 2033
- Table 37: United Kingdom Photochromatic Lenses Revenue (million) Forecast, by Application 2020 & 2033
- Table 38: United Kingdom Photochromatic Lenses Volume (K) Forecast, by Application 2020 & 2033
- Table 39: Germany Photochromatic Lenses Revenue (million) Forecast, by Application 2020 & 2033
- Table 40: Germany Photochromatic Lenses Volume (K) Forecast, by Application 2020 & 2033
- Table 41: France Photochromatic Lenses Revenue (million) Forecast, by Application 2020 & 2033
- Table 42: France Photochromatic Lenses Volume (K) Forecast, by Application 2020 & 2033
- Table 43: Italy Photochromatic Lenses Revenue (million) Forecast, by Application 2020 & 2033
- Table 44: Italy Photochromatic Lenses Volume (K) Forecast, by Application 2020 & 2033
- Table 45: Spain Photochromatic Lenses Revenue (million) Forecast, by Application 2020 & 2033
- Table 46: Spain Photochromatic Lenses Volume (K) Forecast, by Application 2020 & 2033
- Table 47: Russia Photochromatic Lenses Revenue (million) Forecast, by Application 2020 & 2033
- Table 48: Russia Photochromatic Lenses Volume (K) Forecast, by Application 2020 & 2033
- Table 49: Benelux Photochromatic Lenses Revenue (million) Forecast, by Application 2020 & 2033
- Table 50: Benelux Photochromatic Lenses Volume (K) Forecast, by Application 2020 & 2033
- Table 51: Nordics Photochromatic Lenses Revenue (million) Forecast, by Application 2020 & 2033
- Table 52: Nordics Photochromatic Lenses Volume (K) Forecast, by Application 2020 & 2033
- Table 53: Rest of Europe Photochromatic Lenses Revenue (million) Forecast, by Application 2020 & 2033
- Table 54: Rest of Europe Photochromatic Lenses Volume (K) Forecast, by Application 2020 & 2033
- Table 55: Global Photochromatic Lenses Revenue million Forecast, by Application 2020 & 2033
- Table 56: Global Photochromatic Lenses Volume K Forecast, by Application 2020 & 2033
- Table 57: Global Photochromatic Lenses Revenue million Forecast, by Types 2020 & 2033
- Table 58: Global Photochromatic Lenses Volume K Forecast, by Types 2020 & 2033
- Table 59: Global Photochromatic Lenses Revenue million Forecast, by Country 2020 & 2033
- Table 60: Global Photochromatic Lenses Volume K Forecast, by Country 2020 & 2033
- Table 61: Turkey Photochromatic Lenses Revenue (million) Forecast, by Application 2020 & 2033
- Table 62: Turkey Photochromatic Lenses Volume (K) Forecast, by Application 2020 & 2033
- Table 63: Israel Photochromatic Lenses Revenue (million) Forecast, by Application 2020 & 2033
- Table 64: Israel Photochromatic Lenses Volume (K) Forecast, by Application 2020 & 2033
- Table 65: GCC Photochromatic Lenses Revenue (million) Forecast, by Application 2020 & 2033
- Table 66: GCC Photochromatic Lenses Volume (K) Forecast, by Application 2020 & 2033
- Table 67: North Africa Photochromatic Lenses Revenue (million) Forecast, by Application 2020 & 2033
- Table 68: North Africa Photochromatic Lenses Volume (K) Forecast, by Application 2020 & 2033
- Table 69: South Africa Photochromatic Lenses Revenue (million) Forecast, by Application 2020 & 2033
- Table 70: South Africa Photochromatic Lenses Volume (K) Forecast, by Application 2020 & 2033
- Table 71: Rest of Middle East & Africa Photochromatic Lenses Revenue (million) Forecast, by Application 2020 & 2033
- Table 72: Rest of Middle East & Africa Photochromatic Lenses Volume (K) Forecast, by Application 2020 & 2033
- Table 73: Global Photochromatic Lenses Revenue million Forecast, by Application 2020 & 2033
- Table 74: Global Photochromatic Lenses Volume K Forecast, by Application 2020 & 2033
- Table 75: Global Photochromatic Lenses Revenue million Forecast, by Types 2020 & 2033
- Table 76: Global Photochromatic Lenses Volume K Forecast, by Types 2020 & 2033
- Table 77: Global Photochromatic Lenses Revenue million Forecast, by Country 2020 & 2033
- Table 78: Global Photochromatic Lenses Volume K Forecast, by Country 2020 & 2033
- Table 79: China Photochromatic Lenses Revenue (million) Forecast, by Application 2020 & 2033
- Table 80: China Photochromatic Lenses Volume (K) Forecast, by Application 2020 & 2033
- Table 81: India Photochromatic Lenses Revenue (million) Forecast, by Application 2020 & 2033
- Table 82: India Photochromatic Lenses Volume (K) Forecast, by Application 2020 & 2033
- Table 83: Japan Photochromatic Lenses Revenue (million) Forecast, by Application 2020 & 2033
- Table 84: Japan Photochromatic Lenses Volume (K) Forecast, by Application 2020 & 2033
- Table 85: South Korea Photochromatic Lenses Revenue (million) Forecast, by Application 2020 & 2033
- Table 86: South Korea Photochromatic Lenses Volume (K) Forecast, by Application 2020 & 2033
- Table 87: ASEAN Photochromatic Lenses Revenue (million) Forecast, by Application 2020 & 2033
- Table 88: ASEAN Photochromatic Lenses Volume (K) Forecast, by Application 2020 & 2033
- Table 89: Oceania Photochromatic Lenses Revenue (million) Forecast, by Application 2020 & 2033
- Table 90: Oceania Photochromatic Lenses Volume (K) Forecast, by Application 2020 & 2033
- Table 91: Rest of Asia Pacific Photochromatic Lenses Revenue (million) Forecast, by Application 2020 & 2033
- Table 92: Rest of Asia Pacific Photochromatic Lenses Volume (K) Forecast, by Application 2020 & 2033
Frequently Asked Questions
1. What is the projected Compound Annual Growth Rate (CAGR) of the Photochromatic Lenses?
The projected CAGR is approximately 7.6%.
2. Which companies are prominent players in the Photochromatic Lenses?
Key companies in the market include WeeTect, VISION EASE, Jiangsu Aogang Optical Glasses Co., Ltd., Danyang Boris Optical Co., Ltd, Hopesun, OPTICOM, Transitions Optical, Inc., Bod Lenses, Younger Optics, Zhenjiang Kingway Optical Company.
3. What are the main segments of the Photochromatic Lenses?
The market segments include Application, Types.
4. Can you provide details about the market size?
The market size is estimated to be USD 7995.91 million as of 2022.
5. What are some drivers contributing to market growth?
N/A
6. What are the notable trends driving market growth?
N/A
7. Are there any restraints impacting market growth?
N/A
8. Can you provide examples of recent developments in the market?
N/A
9. What pricing options are available for accessing the report?
Pricing options include single-user, multi-user, and enterprise licenses priced at USD 3350.00, USD 5025.00, and USD 6700.00 respectively.
10. Is the market size provided in terms of value or volume?
The market size is provided in terms of value, measured in million and volume, measured in K.
11. Are there any specific market keywords associated with the report?
Yes, the market keyword associated with the report is "Photochromatic Lenses," which aids in identifying and referencing the specific market segment covered.
12. How do I determine which pricing option suits my needs best?
The pricing options vary based on user requirements and access needs. Individual users may opt for single-user licenses, while businesses requiring broader access may choose multi-user or enterprise licenses for cost-effective access to the report.
13. Are there any additional resources or data provided in the Photochromatic Lenses report?
While the report offers comprehensive insights, it's advisable to review the specific contents or supplementary materials provided to ascertain if additional resources or data are available.
14. How can I stay updated on further developments or reports in the Photochromatic Lenses?
To stay informed about further developments, trends, and reports in the Photochromatic Lenses, consider subscribing to industry newsletters, following relevant companies and organizations, or regularly checking reputable industry news sources and publications.
Methodology
Step 1 - Identification of Relevant Samples Size from Population Database


Step 2 - Approaches for Defining Global Market Size (Value, Volume* & Price*)

Note*: In applicable scenarios
Step 3 - Data Sources
Primary Research
- Web Analytics
- Survey Reports
- Research Institute
- Latest Research Reports
- Opinion Leaders
Secondary Research
- Annual Reports
- White Paper
- Latest Press Release
- Industry Association
- Paid Database
- Investor Presentations

Step 4 - Data Triangulation
Involves using different sources of information in order to increase the validity of a study
These sources are likely to be stakeholders in a program - participants, other researchers, program staff, other community members, and so on.
Then we put all data in single framework & apply various statistical tools to find out the dynamic on the market.
During the analysis stage, feedback from the stakeholder groups would be compared to determine areas of agreement as well as areas of divergence