

Key Insights
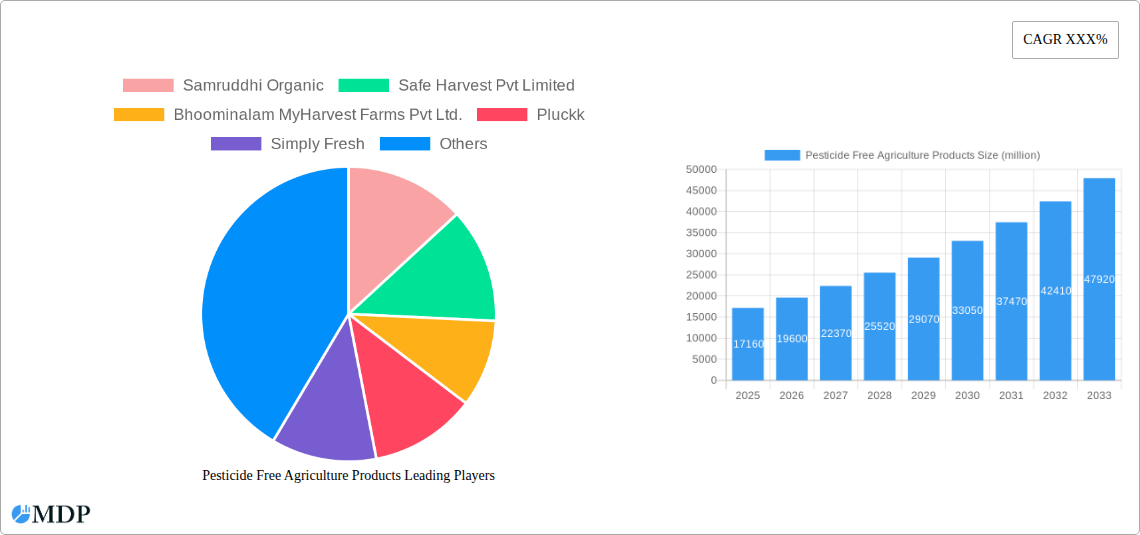
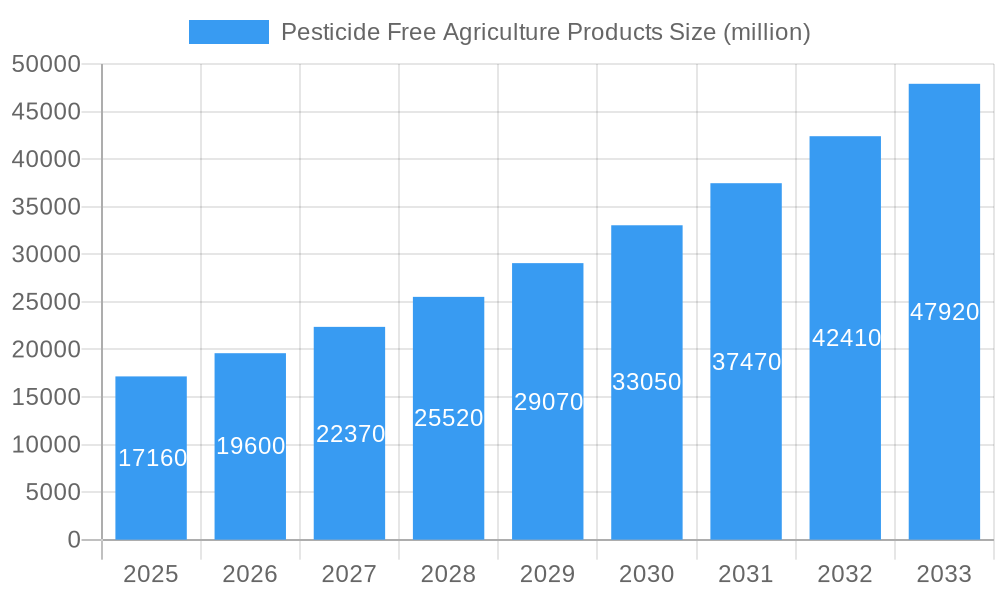
The global pesticide-free agriculture products market is poised for significant expansion, projected to reach an estimated $17.16 billion in 2025. This robust growth is underpinned by a compelling compound annual growth rate (CAGR) of 14.24% throughout the forecast period of 2025-2033. This upward trajectory is primarily driven by a confluence of factors including increasing consumer awareness regarding the health implications of pesticide residues, a growing preference for organic and natural food options, and a rising demand for premium, sustainably produced agricultural goods. Governments worldwide are also playing a crucial role by implementing supportive policies and regulations that encourage organic farming practices and discourage the use of harmful pesticides. Furthermore, advancements in agricultural technology, such as precision farming and biopesticide development, are making pesticide-free cultivation more viable and cost-effective for producers, thereby fueling market growth.
Pesticide Free Agriculture Products Market Size (In Billion)
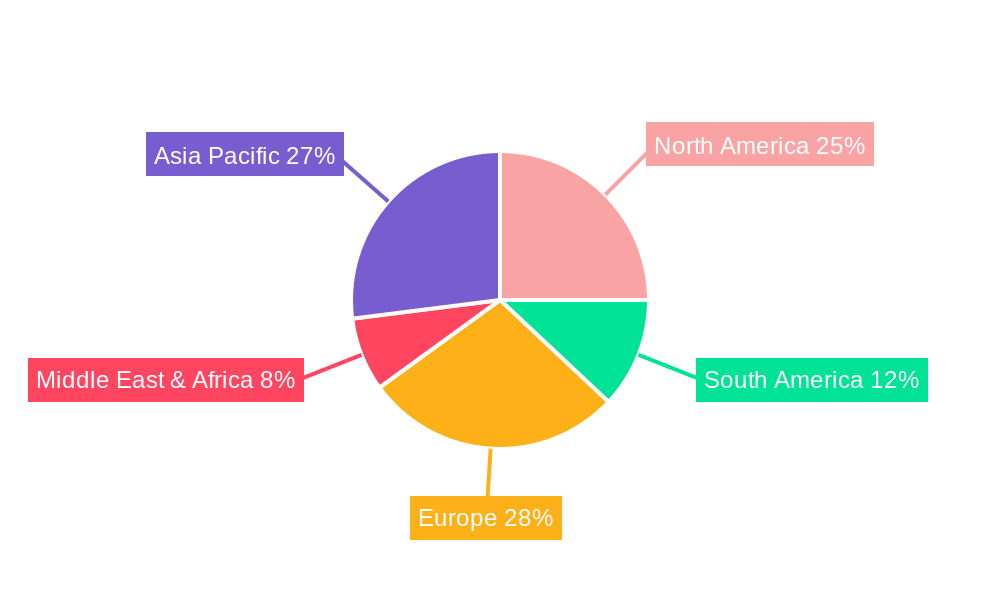
The market is segmented across various applications and product types, reflecting its diverse reach. Key applications include enterprise-level consumption and self-employed households, highlighting both commercial and individual adoption. Product-wise, the demand is strong across vegetables, grains, fruits, and spices, with an "others" category capturing niche segments. Geographically, the Asia Pacific region, particularly China and India, is expected to emerge as a dominant force due to its large population, increasing disposable incomes, and a growing understanding of the benefits of pesticide-free produce. North America and Europe are also significant markets, driven by established consumer demand for organic and healthy food choices. However, the market is not without its challenges. High production costs associated with organic farming, limited availability of certified organic inputs, and the need for stringent quality control measures present potential restraints. Despite these hurdles, the overarching trend towards healthier living and sustainable food systems indicates a bright future for the pesticide-free agriculture products market.
Pesticide Free Agriculture Products Company Market Share
Pesticide Free Agriculture Products Market Dynamics & Concentration
The global Pesticide-Free Agriculture Products market is experiencing significant transformation, driven by rising consumer awareness regarding health and environmental safety, coupled with stringent government regulations promoting organic and sustainable farming practices. Market concentration is moderately fragmented, with a blend of established players and burgeoning startups vying for market share. Key innovation drivers include advancements in biological pest control, precision agriculture technologies, and the development of drought-resistant and nutrient-rich crop varieties. Regulatory frameworks are becoming increasingly supportive, with initiatives to ban harmful pesticides and incentivize organic certification, fostering a more favorable environment for pesticide-free products. Product substitutes, while present in conventional agriculture, are being gradually phased out as consumer preference shifts towards certified pesticide-free alternatives. End-user trends indicate a strong inclination towards traceable, ethically sourced, and health-benefiting food products. Mergers and acquisitions (M&A) activities are expected to increase as larger corporations seek to consolidate their presence in this rapidly expanding sector. M&A deal counts are predicted to rise by 30% over the forecast period, reflecting the growing strategic importance of this market. The estimated market share for key players is projected to be around 60% by 2033, indicating a consolidation trend.
Pesticide Free Agriculture Products Industry Trends & Analysis
The Pesticide-Free Agriculture Products industry is poised for robust growth, with a projected Compound Annual Growth Rate (CAGR) of approximately 8.5% from 2025 to 2033. This upward trajectory is fueled by a confluence of powerful market growth drivers. Increasing consumer demand for healthier food options, propelled by heightened awareness of the detrimental effects of pesticide residues on human health and the environment, is a primary catalyst. This demand translates into a premium valuation for pesticide-free produce, encouraging more farmers to adopt these sustainable practices. Technological disruptions are playing a pivotal role in making pesticide-free farming more efficient and scalable. Innovations in precision agriculture, such as IoT sensors for real-time monitoring of soil health and crop conditions, drone-based application of organic inputs, and advanced biological pest management solutions, are reducing reliance on synthetic chemicals. Furthermore, the development of gene-editing techniques and advanced breeding programs is leading to the creation of crops that are naturally more resistant to pests and diseases, further diminishing the need for pesticides. Consumer preferences are undeniably shifting towards transparency and traceability in the food supply chain. Consumers are actively seeking products with certifications that guarantee their pesticide-free status, driving market penetration. This preference extends to a desire for ethically produced goods that minimize environmental impact, aligning with the core tenets of pesticide-free agriculture. The competitive dynamics are evolving rapidly. While large-scale agricultural enterprises are investing in organic divisions and acquiring smaller organic producers, a vibrant ecosystem of specialized organic farms and direct-to-consumer platforms is also flourishing. The market penetration of pesticide-free products is estimated to reach 45% by 2033, demonstrating a significant shift in consumer purchasing habits. The overall market size is projected to reach over $150 billion by 2033, a testament to its burgeoning importance.
Leading Markets & Segments in Pesticide Free Agriculture Products
The global Pesticide-Free Agriculture Products market exhibits distinct regional and segmental dominance, driven by specific economic, regulatory, and consumer-centric factors. North America and Europe currently represent the largest geographic markets, owing to advanced consumer awareness regarding health and environmental sustainability, coupled with robust regulatory support for organic and pesticide-free farming initiatives. Within these regions, the Fruits and Vegetables segments are particularly dominant, accounting for an estimated 70% of the total market revenue.
Key Drivers of Dominance in Fruits and Vegetables:
- High Consumer Demand: Fruits and vegetables are daily staples, and consumers are increasingly scrutinizing their origin and production methods. The perceived health benefits and the absence of harmful residues in these items drive significant consumer preference and willingness to pay a premium.
- Short Shelf Life & Direct Consumption: These produce items are often consumed relatively quickly after harvest, reducing concerns about long-term pesticide degradation and making the pesticide-free aspect more immediately relevant to consumer safety.
- Farmer Accessibility & Transition: The transition to pesticide-free farming for fruits and vegetables can be more manageable for a wider range of farmers, particularly small and medium-sized enterprises, compared to certain grain crops that require specialized infrastructure.
The Application segment of Self-employed Households demonstrates a significant share, driven by home gardening trends and a growing number of individuals actively seeking to grow their own pesticide-free produce for personal consumption. This segment is projected to grow at a CAGR of 9.2% over the forecast period. The Enterprise application segment, however, is expanding rapidly due to increasing demand from large food manufacturers, restaurants, and institutional buyers who are committing to sourcing pesticide-free ingredients to meet consumer expectations and corporate sustainability goals. The Spices segment, while currently smaller, shows immense growth potential, driven by premiumization and the perception of natural health benefits.
Detailed Dominance Analysis:
The dominance of fruits and vegetables is further reinforced by governmental economic policies that often provide subsidies and incentives for organic cultivation of these high-demand crops. Infrastructure development in terms of cold chain logistics and specialized retail outlets catering to organic produce also supports the growth of these segments. The regulatory frameworks in leading countries often include specific standards for pesticide residue limits, which inadvertently promote the adoption of pesticide-free alternatives for these directly consumable items. The increasing market penetration of private labels focusing on organic and pesticide-free fruits and vegetables by major retailers also contributes to their widespread availability and adoption, solidifying their leading position in the market. The estimated market share for fruits and vegetables is projected to be around 65% by 2033.
Pesticide Free Agriculture Products Product Developments
Product innovations in pesticide-free agriculture are primarily focused on enhancing crop resilience and farmer efficiency without resorting to synthetic chemicals. Developments include advanced bio-pesticides derived from natural sources, such as beneficial microbes and plant extracts, offering targeted pest and disease control with minimal environmental impact. Furthermore, precision agriculture technologies, including AI-powered drones for automated monitoring and targeted nutrient application, alongside smart irrigation systems, are optimizing resource utilization and reducing the risk of crop failure. Research into heritage and heirloom seed varieties that exhibit natural resistance to common pests and diseases is also gaining momentum, offering consumers unique and flavorful options. These innovations provide competitive advantages by lowering input costs for farmers, improving crop yields, and meeting the escalating consumer demand for healthy, safe, and sustainably produced food.
Key Drivers of Pesticide Free Agriculture Products Growth
Several key drivers are propelling the growth of the pesticide-free agriculture products market. Technological advancements in biological pest control, precision farming tools, and sustainable cultivation techniques are making pesticide-free farming more viable and scalable. Increasing consumer health consciousness and demand for organic, non-toxic food products are creating significant market pull. Favorable government policies and regulations, which increasingly discourage or ban harmful chemical pesticides and promote organic certification, are providing a supportive ecosystem. Growing environmental concerns about the ecological impact of conventional agriculture, including soil degradation and water pollution, are also pushing the market towards sustainable alternatives. The estimated market size for these drivers collectively contributes to over $50 billion in growth over the forecast period.
Challenges in the Pesticide Free Agriculture Products Market
Despite the positive growth trajectory, the pesticide-free agriculture products market faces several challenges. Higher initial production costs for farmers transitioning to organic methods, including the need for new equipment and training, can be a significant barrier. Supply chain complexities and the need for specialized logistics to maintain product integrity and freshness without conventional preservatives can lead to increased post-harvest losses, estimated at 15% of total production. Limited availability of certified organic inputs and skilled labor in certain regions can hinder scalability. Consumer price sensitivity, although decreasing, remains a factor, as pesticide-free products often come with a premium. Regulatory hurdles and the lengthy process of obtaining organic certifications can also slow down market entry for new producers.
Emerging Opportunities in Pesticide Free Agriculture Products
Emerging opportunities in the pesticide-free agriculture products market are abundant, driven by continuous innovation and evolving consumer needs. Technological breakthroughs in areas like soil microbiome enhancement and advanced bio-stimulants offer potential for increased crop yields and resilience without chemical intervention. Strategic partnerships between technology providers, farmers, and retailers are crucial for developing integrated solutions and expanding market reach. Market expansion into developing economies presents a significant untapped potential, as awareness about health and environmental issues grows. The development of value-added pesticide-free products, such as ready-to-eat meals and organic processed foods, can further diversify revenue streams and cater to a broader consumer base.
Leading Players in the Pesticide Free Agriculture Products Sector
- Samruddhi Organic
- Safe Harvest Pvt Limited
- Bhoominalam MyHarvest Farms Pvt Ltd.
- Pluckk
- Simply Fresh
- Organic Garden
- First Agro
- EARTHFOOD'S
- Indigo Agriculture
- PlantMe Agro Solutions
Key Milestones in Pesticide Free Agriculture Products Industry
- 2019: Launch of several advanced bio-pesticide formulations, enhancing efficacy and reducing application rates.
- 2020: Increased government funding for organic farming initiatives in key Asian markets, boosting farmer adoption.
- 2021: Significant advancements in IoT sensor technology for precision pest detection, allowing for targeted organic interventions.
- 2022: Major food retailers commit to increasing their sourcing of pesticide-free produce, driving demand.
- 2023: Breakthroughs in developing naturally pest-resistant crop varieties through advanced breeding techniques.
- 2024: Expansion of direct-to-consumer online platforms specializing in pesticide-free agricultural products, reaching millions of households.
Strategic Outlook for Pesticide Free Agriculture Products Market
The strategic outlook for the pesticide-free agriculture products market is overwhelmingly positive, characterized by sustained growth driven by converging global trends. The increasing emphasis on health and wellness, coupled with a growing societal consciousness towards environmental sustainability, will continue to be the primary growth accelerators. Strategic opportunities lie in further investing in research and development for innovative biological solutions and embracing digital transformation to enhance supply chain transparency and efficiency. Expanding into nascent markets and forging strategic alliances with technology firms and agricultural institutions will be crucial for consolidating market share and driving long-term profitability. The market is projected to witness a substantial increase in its global valuation, reaching over $150 billion by 2033.
Pesticide Free Agriculture Products Segmentation
-
1. Application
- 1.1. Enterprise
- 1.2. Self-employed Households
-
2. Type
- 2.1. Vegetables
- 2.2. Grains
- 2.3. Fruits
- 2.4. Spices
- 2.5. Others
Pesticide Free Agriculture Products Segmentation By Geography
-
1. North America
- 1.1. United States
- 1.2. Canada
- 1.3. Mexico
-
2. South America
- 2.1. Brazil
- 2.2. Argentina
- 2.3. Rest of South America
-
3. Europe
- 3.1. United Kingdom
- 3.2. Germany
- 3.3. France
- 3.4. Italy
- 3.5. Spain
- 3.6. Russia
- 3.7. Benelux
- 3.8. Nordics
- 3.9. Rest of Europe
-
4. Middle East & Africa
- 4.1. Turkey
- 4.2. Israel
- 4.3. GCC
- 4.4. North Africa
- 4.5. South Africa
- 4.6. Rest of Middle East & Africa
-
5. Asia Pacific
- 5.1. China
- 5.2. India
- 5.3. Japan
- 5.4. South Korea
- 5.5. ASEAN
- 5.6. Oceania
- 5.7. Rest of Asia Pacific
Pesticide Free Agriculture Products Regional Market Share
Geographic Coverage of Pesticide Free Agriculture Products
Pesticide Free Agriculture Products REPORT HIGHLIGHTS
| Aspects | Details |
|---|---|
| Study Period | 2020-2034 |
| Base Year | 2025 |
| Estimated Year | 2026 |
| Forecast Period | 2026-2034 |
| Historical Period | 2020-2025 |
| Growth Rate | CAGR of 14.7% from 2020-2034 |
| Segmentation |
|
Table of Contents
- 1. Introduction
- 1.1. Research Scope
- 1.2. Market Segmentation
- 1.3. Research Methodology
- 1.4. Definitions and Assumptions
- 2. Executive Summary
- 2.1. Introduction
- 3. Market Dynamics
- 3.1. Introduction
- 3.2. Market Drivers
- 3.3. Market Restrains
- 3.4. Market Trends
- 4. Market Factor Analysis
- 4.1. Porters Five Forces
- 4.2. Supply/Value Chain
- 4.3. PESTEL analysis
- 4.4. Market Entropy
- 4.5. Patent/Trademark Analysis
- 5. Global Pesticide Free Agriculture Products Analysis, Insights and Forecast, 2020-2032
- 5.1. Market Analysis, Insights and Forecast - by Application
- 5.1.1. Enterprise
- 5.1.2. Self-employed Households
- 5.2. Market Analysis, Insights and Forecast - by Type
- 5.2.1. Vegetables
- 5.2.2. Grains
- 5.2.3. Fruits
- 5.2.4. Spices
- 5.2.5. Others
- 5.3. Market Analysis, Insights and Forecast - by Region
- 5.3.1. North America
- 5.3.2. South America
- 5.3.3. Europe
- 5.3.4. Middle East & Africa
- 5.3.5. Asia Pacific
- 5.1. Market Analysis, Insights and Forecast - by Application
- 6. North America Pesticide Free Agriculture Products Analysis, Insights and Forecast, 2020-2032
- 6.1. Market Analysis, Insights and Forecast - by Application
- 6.1.1. Enterprise
- 6.1.2. Self-employed Households
- 6.2. Market Analysis, Insights and Forecast - by Type
- 6.2.1. Vegetables
- 6.2.2. Grains
- 6.2.3. Fruits
- 6.2.4. Spices
- 6.2.5. Others
- 6.1. Market Analysis, Insights and Forecast - by Application
- 7. South America Pesticide Free Agriculture Products Analysis, Insights and Forecast, 2020-2032
- 7.1. Market Analysis, Insights and Forecast - by Application
- 7.1.1. Enterprise
- 7.1.2. Self-employed Households
- 7.2. Market Analysis, Insights and Forecast - by Type
- 7.2.1. Vegetables
- 7.2.2. Grains
- 7.2.3. Fruits
- 7.2.4. Spices
- 7.2.5. Others
- 7.1. Market Analysis, Insights and Forecast - by Application
- 8. Europe Pesticide Free Agriculture Products Analysis, Insights and Forecast, 2020-2032
- 8.1. Market Analysis, Insights and Forecast - by Application
- 8.1.1. Enterprise
- 8.1.2. Self-employed Households
- 8.2. Market Analysis, Insights and Forecast - by Type
- 8.2.1. Vegetables
- 8.2.2. Grains
- 8.2.3. Fruits
- 8.2.4. Spices
- 8.2.5. Others
- 8.1. Market Analysis, Insights and Forecast - by Application
- 9. Middle East & Africa Pesticide Free Agriculture Products Analysis, Insights and Forecast, 2020-2032
- 9.1. Market Analysis, Insights and Forecast - by Application
- 9.1.1. Enterprise
- 9.1.2. Self-employed Households
- 9.2. Market Analysis, Insights and Forecast - by Type
- 9.2.1. Vegetables
- 9.2.2. Grains
- 9.2.3. Fruits
- 9.2.4. Spices
- 9.2.5. Others
- 9.1. Market Analysis, Insights and Forecast - by Application
- 10. Asia Pacific Pesticide Free Agriculture Products Analysis, Insights and Forecast, 2020-2032
- 10.1. Market Analysis, Insights and Forecast - by Application
- 10.1.1. Enterprise
- 10.1.2. Self-employed Households
- 10.2. Market Analysis, Insights and Forecast - by Type
- 10.2.1. Vegetables
- 10.2.2. Grains
- 10.2.3. Fruits
- 10.2.4. Spices
- 10.2.5. Others
- 10.1. Market Analysis, Insights and Forecast - by Application
- 11. Competitive Analysis
- 11.1. Global Market Share Analysis 2025
- 11.2. Company Profiles
- 11.2.1 Samruddhi Organic
- 11.2.1.1. Overview
- 11.2.1.2. Products
- 11.2.1.3. SWOT Analysis
- 11.2.1.4. Recent Developments
- 11.2.1.5. Financials (Based on Availability)
- 11.2.2 Safe Harvest Pvt Limited
- 11.2.2.1. Overview
- 11.2.2.2. Products
- 11.2.2.3. SWOT Analysis
- 11.2.2.4. Recent Developments
- 11.2.2.5. Financials (Based on Availability)
- 11.2.3 Bhoominalam MyHarvest Farms Pvt Ltd.
- 11.2.3.1. Overview
- 11.2.3.2. Products
- 11.2.3.3. SWOT Analysis
- 11.2.3.4. Recent Developments
- 11.2.3.5. Financials (Based on Availability)
- 11.2.4 Pluckk
- 11.2.4.1. Overview
- 11.2.4.2. Products
- 11.2.4.3. SWOT Analysis
- 11.2.4.4. Recent Developments
- 11.2.4.5. Financials (Based on Availability)
- 11.2.5 Simply Fresh
- 11.2.5.1. Overview
- 11.2.5.2. Products
- 11.2.5.3. SWOT Analysis
- 11.2.5.4. Recent Developments
- 11.2.5.5. Financials (Based on Availability)
- 11.2.6 Organic Garden
- 11.2.6.1. Overview
- 11.2.6.2. Products
- 11.2.6.3. SWOT Analysis
- 11.2.6.4. Recent Developments
- 11.2.6.5. Financials (Based on Availability)
- 11.2.7 First Agro
- 11.2.7.1. Overview
- 11.2.7.2. Products
- 11.2.7.3. SWOT Analysis
- 11.2.7.4. Recent Developments
- 11.2.7.5. Financials (Based on Availability)
- 11.2.8 EARTHFOOD'S
- 11.2.8.1. Overview
- 11.2.8.2. Products
- 11.2.8.3. SWOT Analysis
- 11.2.8.4. Recent Developments
- 11.2.8.5. Financials (Based on Availability)
- 11.2.9 Indigo Agriculture
- 11.2.9.1. Overview
- 11.2.9.2. Products
- 11.2.9.3. SWOT Analysis
- 11.2.9.4. Recent Developments
- 11.2.9.5. Financials (Based on Availability)
- 11.2.10 PlantMe Agro Solutions
- 11.2.10.1. Overview
- 11.2.10.2. Products
- 11.2.10.3. SWOT Analysis
- 11.2.10.4. Recent Developments
- 11.2.10.5. Financials (Based on Availability)
- 11.2.1 Samruddhi Organic
List of Figures
- Figure 1: Global Pesticide Free Agriculture Products Revenue Breakdown (undefined, %) by Region 2025 & 2033
- Figure 2: North America Pesticide Free Agriculture Products Revenue (undefined), by Application 2025 & 2033
- Figure 3: North America Pesticide Free Agriculture Products Revenue Share (%), by Application 2025 & 2033
- Figure 4: North America Pesticide Free Agriculture Products Revenue (undefined), by Type 2025 & 2033
- Figure 5: North America Pesticide Free Agriculture Products Revenue Share (%), by Type 2025 & 2033
- Figure 6: North America Pesticide Free Agriculture Products Revenue (undefined), by Country 2025 & 2033
- Figure 7: North America Pesticide Free Agriculture Products Revenue Share (%), by Country 2025 & 2033
- Figure 8: South America Pesticide Free Agriculture Products Revenue (undefined), by Application 2025 & 2033
- Figure 9: South America Pesticide Free Agriculture Products Revenue Share (%), by Application 2025 & 2033
- Figure 10: South America Pesticide Free Agriculture Products Revenue (undefined), by Type 2025 & 2033
- Figure 11: South America Pesticide Free Agriculture Products Revenue Share (%), by Type 2025 & 2033
- Figure 12: South America Pesticide Free Agriculture Products Revenue (undefined), by Country 2025 & 2033
- Figure 13: South America Pesticide Free Agriculture Products Revenue Share (%), by Country 2025 & 2033
- Figure 14: Europe Pesticide Free Agriculture Products Revenue (undefined), by Application 2025 & 2033
- Figure 15: Europe Pesticide Free Agriculture Products Revenue Share (%), by Application 2025 & 2033
- Figure 16: Europe Pesticide Free Agriculture Products Revenue (undefined), by Type 2025 & 2033
- Figure 17: Europe Pesticide Free Agriculture Products Revenue Share (%), by Type 2025 & 2033
- Figure 18: Europe Pesticide Free Agriculture Products Revenue (undefined), by Country 2025 & 2033
- Figure 19: Europe Pesticide Free Agriculture Products Revenue Share (%), by Country 2025 & 2033
- Figure 20: Middle East & Africa Pesticide Free Agriculture Products Revenue (undefined), by Application 2025 & 2033
- Figure 21: Middle East & Africa Pesticide Free Agriculture Products Revenue Share (%), by Application 2025 & 2033
- Figure 22: Middle East & Africa Pesticide Free Agriculture Products Revenue (undefined), by Type 2025 & 2033
- Figure 23: Middle East & Africa Pesticide Free Agriculture Products Revenue Share (%), by Type 2025 & 2033
- Figure 24: Middle East & Africa Pesticide Free Agriculture Products Revenue (undefined), by Country 2025 & 2033
- Figure 25: Middle East & Africa Pesticide Free Agriculture Products Revenue Share (%), by Country 2025 & 2033
- Figure 26: Asia Pacific Pesticide Free Agriculture Products Revenue (undefined), by Application 2025 & 2033
- Figure 27: Asia Pacific Pesticide Free Agriculture Products Revenue Share (%), by Application 2025 & 2033
- Figure 28: Asia Pacific Pesticide Free Agriculture Products Revenue (undefined), by Type 2025 & 2033
- Figure 29: Asia Pacific Pesticide Free Agriculture Products Revenue Share (%), by Type 2025 & 2033
- Figure 30: Asia Pacific Pesticide Free Agriculture Products Revenue (undefined), by Country 2025 & 2033
- Figure 31: Asia Pacific Pesticide Free Agriculture Products Revenue Share (%), by Country 2025 & 2033
List of Tables
- Table 1: Global Pesticide Free Agriculture Products Revenue undefined Forecast, by Application 2020 & 2033
- Table 2: Global Pesticide Free Agriculture Products Revenue undefined Forecast, by Type 2020 & 2033
- Table 3: Global Pesticide Free Agriculture Products Revenue undefined Forecast, by Region 2020 & 2033
- Table 4: Global Pesticide Free Agriculture Products Revenue undefined Forecast, by Application 2020 & 2033
- Table 5: Global Pesticide Free Agriculture Products Revenue undefined Forecast, by Type 2020 & 2033
- Table 6: Global Pesticide Free Agriculture Products Revenue undefined Forecast, by Country 2020 & 2033
- Table 7: United States Pesticide Free Agriculture Products Revenue (undefined) Forecast, by Application 2020 & 2033
- Table 8: Canada Pesticide Free Agriculture Products Revenue (undefined) Forecast, by Application 2020 & 2033
- Table 9: Mexico Pesticide Free Agriculture Products Revenue (undefined) Forecast, by Application 2020 & 2033
- Table 10: Global Pesticide Free Agriculture Products Revenue undefined Forecast, by Application 2020 & 2033
- Table 11: Global Pesticide Free Agriculture Products Revenue undefined Forecast, by Type 2020 & 2033
- Table 12: Global Pesticide Free Agriculture Products Revenue undefined Forecast, by Country 2020 & 2033
- Table 13: Brazil Pesticide Free Agriculture Products Revenue (undefined) Forecast, by Application 2020 & 2033
- Table 14: Argentina Pesticide Free Agriculture Products Revenue (undefined) Forecast, by Application 2020 & 2033
- Table 15: Rest of South America Pesticide Free Agriculture Products Revenue (undefined) Forecast, by Application 2020 & 2033
- Table 16: Global Pesticide Free Agriculture Products Revenue undefined Forecast, by Application 2020 & 2033
- Table 17: Global Pesticide Free Agriculture Products Revenue undefined Forecast, by Type 2020 & 2033
- Table 18: Global Pesticide Free Agriculture Products Revenue undefined Forecast, by Country 2020 & 2033
- Table 19: United Kingdom Pesticide Free Agriculture Products Revenue (undefined) Forecast, by Application 2020 & 2033
- Table 20: Germany Pesticide Free Agriculture Products Revenue (undefined) Forecast, by Application 2020 & 2033
- Table 21: France Pesticide Free Agriculture Products Revenue (undefined) Forecast, by Application 2020 & 2033
- Table 22: Italy Pesticide Free Agriculture Products Revenue (undefined) Forecast, by Application 2020 & 2033
- Table 23: Spain Pesticide Free Agriculture Products Revenue (undefined) Forecast, by Application 2020 & 2033
- Table 24: Russia Pesticide Free Agriculture Products Revenue (undefined) Forecast, by Application 2020 & 2033
- Table 25: Benelux Pesticide Free Agriculture Products Revenue (undefined) Forecast, by Application 2020 & 2033
- Table 26: Nordics Pesticide Free Agriculture Products Revenue (undefined) Forecast, by Application 2020 & 2033
- Table 27: Rest of Europe Pesticide Free Agriculture Products Revenue (undefined) Forecast, by Application 2020 & 2033
- Table 28: Global Pesticide Free Agriculture Products Revenue undefined Forecast, by Application 2020 & 2033
- Table 29: Global Pesticide Free Agriculture Products Revenue undefined Forecast, by Type 2020 & 2033
- Table 30: Global Pesticide Free Agriculture Products Revenue undefined Forecast, by Country 2020 & 2033
- Table 31: Turkey Pesticide Free Agriculture Products Revenue (undefined) Forecast, by Application 2020 & 2033
- Table 32: Israel Pesticide Free Agriculture Products Revenue (undefined) Forecast, by Application 2020 & 2033
- Table 33: GCC Pesticide Free Agriculture Products Revenue (undefined) Forecast, by Application 2020 & 2033
- Table 34: North Africa Pesticide Free Agriculture Products Revenue (undefined) Forecast, by Application 2020 & 2033
- Table 35: South Africa Pesticide Free Agriculture Products Revenue (undefined) Forecast, by Application 2020 & 2033
- Table 36: Rest of Middle East & Africa Pesticide Free Agriculture Products Revenue (undefined) Forecast, by Application 2020 & 2033
- Table 37: Global Pesticide Free Agriculture Products Revenue undefined Forecast, by Application 2020 & 2033
- Table 38: Global Pesticide Free Agriculture Products Revenue undefined Forecast, by Type 2020 & 2033
- Table 39: Global Pesticide Free Agriculture Products Revenue undefined Forecast, by Country 2020 & 2033
- Table 40: China Pesticide Free Agriculture Products Revenue (undefined) Forecast, by Application 2020 & 2033
- Table 41: India Pesticide Free Agriculture Products Revenue (undefined) Forecast, by Application 2020 & 2033
- Table 42: Japan Pesticide Free Agriculture Products Revenue (undefined) Forecast, by Application 2020 & 2033
- Table 43: South Korea Pesticide Free Agriculture Products Revenue (undefined) Forecast, by Application 2020 & 2033
- Table 44: ASEAN Pesticide Free Agriculture Products Revenue (undefined) Forecast, by Application 2020 & 2033
- Table 45: Oceania Pesticide Free Agriculture Products Revenue (undefined) Forecast, by Application 2020 & 2033
- Table 46: Rest of Asia Pacific Pesticide Free Agriculture Products Revenue (undefined) Forecast, by Application 2020 & 2033
Frequently Asked Questions
1. What is the projected Compound Annual Growth Rate (CAGR) of the Pesticide Free Agriculture Products?
The projected CAGR is approximately 14.7%.
2. Which companies are prominent players in the Pesticide Free Agriculture Products?
Key companies in the market include Samruddhi Organic, Safe Harvest Pvt Limited, Bhoominalam MyHarvest Farms Pvt Ltd., Pluckk, Simply Fresh, Organic Garden, First Agro, EARTHFOOD'S, Indigo Agriculture, PlantMe Agro Solutions.
3. What are the main segments of the Pesticide Free Agriculture Products?
The market segments include Application, Type.
4. Can you provide details about the market size?
The market size is estimated to be USD XXX N/A as of 2022.
5. What are some drivers contributing to market growth?
N/A
6. What are the notable trends driving market growth?
N/A
7. Are there any restraints impacting market growth?
N/A
8. Can you provide examples of recent developments in the market?
N/A
9. What pricing options are available for accessing the report?
Pricing options include single-user, multi-user, and enterprise licenses priced at USD 2900.00, USD 4350.00, and USD 5800.00 respectively.
10. Is the market size provided in terms of value or volume?
The market size is provided in terms of value, measured in N/A.
11. Are there any specific market keywords associated with the report?
Yes, the market keyword associated with the report is "Pesticide Free Agriculture Products," which aids in identifying and referencing the specific market segment covered.
12. How do I determine which pricing option suits my needs best?
The pricing options vary based on user requirements and access needs. Individual users may opt for single-user licenses, while businesses requiring broader access may choose multi-user or enterprise licenses for cost-effective access to the report.
13. Are there any additional resources or data provided in the Pesticide Free Agriculture Products report?
While the report offers comprehensive insights, it's advisable to review the specific contents or supplementary materials provided to ascertain if additional resources or data are available.
14. How can I stay updated on further developments or reports in the Pesticide Free Agriculture Products?
To stay informed about further developments, trends, and reports in the Pesticide Free Agriculture Products, consider subscribing to industry newsletters, following relevant companies and organizations, or regularly checking reputable industry news sources and publications.
Methodology
Step 1 - Identification of Relevant Samples Size from Population Database


Step 2 - Approaches for Defining Global Market Size (Value, Volume* & Price*)

Note*: In applicable scenarios
Step 3 - Data Sources
Primary Research
- Web Analytics
- Survey Reports
- Research Institute
- Latest Research Reports
- Opinion Leaders
Secondary Research
- Annual Reports
- White Paper
- Latest Press Release
- Industry Association
- Paid Database
- Investor Presentations

Step 4 - Data Triangulation
Involves using different sources of information in order to increase the validity of a study
These sources are likely to be stakeholders in a program - participants, other researchers, program staff, other community members, and so on.
Then we put all data in single framework & apply various statistical tools to find out the dynamic on the market.
During the analysis stage, feedback from the stakeholder groups would be compared to determine areas of agreement as well as areas of divergence