

Key Insights
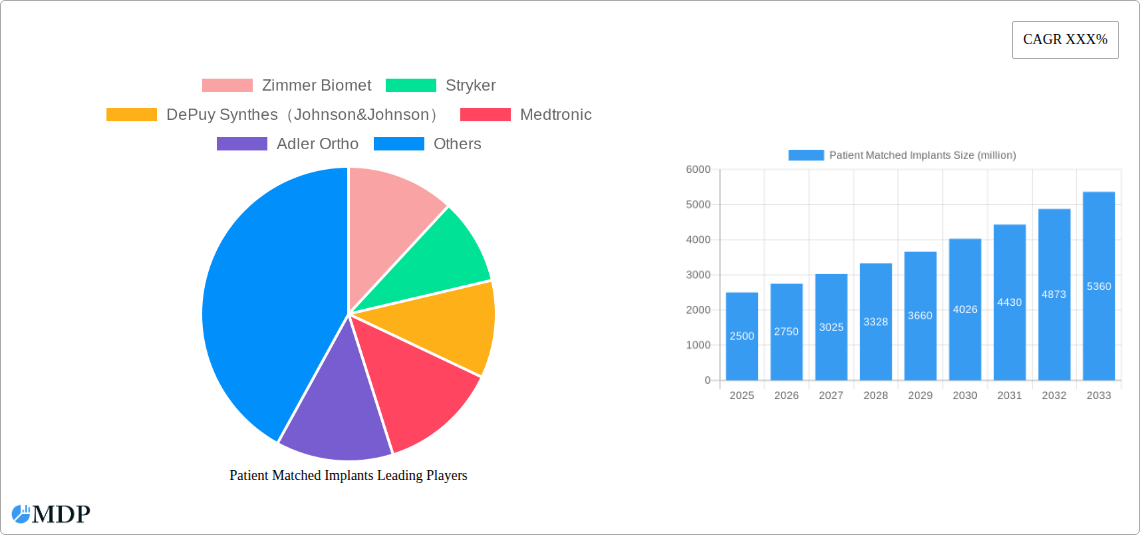
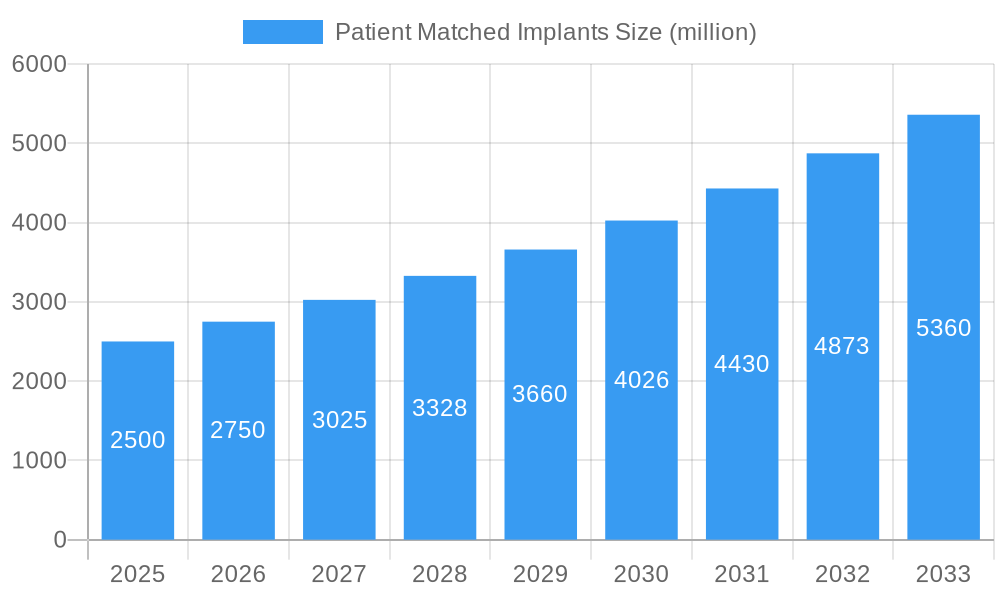
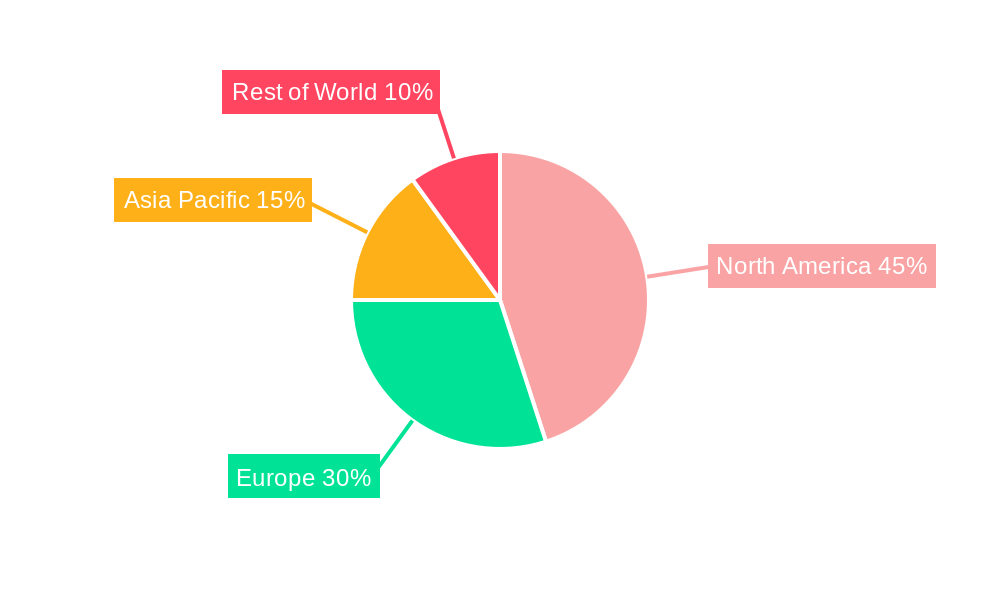
The global patient-matched implants market is experiencing robust growth, driven by the increasing prevalence of orthopedic conditions, advancements in 3D printing and imaging technologies, and a rising demand for personalized medicine. The market's size in 2025 is estimated at $2.5 billion, projecting a Compound Annual Growth Rate (CAGR) of 10% from 2025 to 2033. This expansion is fueled by several key factors. Firstly, the aging global population is leading to a surge in orthopedic surgeries, creating a larger pool of potential patients requiring personalized implants. Secondly, technological advancements, particularly in 3D printing and computer-aided design (CAD), allow for the creation of highly accurate and customized implants tailored to individual patient anatomy, leading to improved surgical outcomes and patient satisfaction. Finally, the shift towards value-based healthcare incentivizes the adoption of patient-matched implants due to their potential to reduce revision surgeries and improve long-term patient health, ultimately lowering healthcare costs. The market is segmented by application (hospital, ambulatory surgery centers, others), implant type (joint, spine, skull, others), and geography. While North America currently holds a significant market share, regions like Asia-Pacific are poised for substantial growth due to increasing healthcare expenditure and rising awareness of advanced surgical techniques.
Patient Matched Implants Market Size (In Billion)
Competitive pressures are also shaping the market landscape. Major players like Zimmer Biomet, Stryker, DePuy Synthes, Medtronic, and others are actively investing in research and development, expanding their product portfolios, and pursuing strategic partnerships to maintain a competitive edge. The increasing adoption of minimally invasive surgical techniques is further boosting the demand for patient-matched implants as they are frequently better suited to these procedures. However, high initial costs associated with the technology, coupled with regulatory hurdles in certain regions, pose challenges to market penetration. Nevertheless, the long-term benefits of improved patient outcomes and reduced healthcare costs are expected to outweigh these challenges, driving sustained growth in the patient-matched implants market over the forecast period.
Patient Matched Implants Company Market Share
Patient Matched Implants Market Report: A Comprehensive Analysis (2019-2033)
This comprehensive report provides an in-depth analysis of the global Patient Matched Implants market, projecting a market valuation of $XX billion by 2033. The study covers the period from 2019 to 2033, with a focus on the 2025-2033 forecast period and a base year of 2025. Key players such as Zimmer Biomet, Stryker, DePuy Synthes (Johnson & Johnson), Medtronic, Adler Ortho, Lima Corporation, Conformis, Smith & Nephew, Exactech, and Aikang Medical are analyzed, offering crucial insights for industry stakeholders. This report is essential for investors, manufacturers, and healthcare professionals seeking a robust understanding of this dynamic market.
Patient Matched Implants Market Dynamics & Concentration
The global Patient Matched Implants market exhibits a moderately consolidated structure, with the top five players holding approximately XX% of the market share in 2025. Market concentration is influenced by factors such as stringent regulatory approvals, high R&D investments, and the need for specialized manufacturing capabilities. Innovation is a key driver, with companies continually developing advanced materials and technologies to improve implant performance and patient outcomes. The regulatory landscape varies across regions, impacting market entry and product adoption. Substitutes, such as traditional implants or non-surgical treatments, exert competitive pressure. End-user trends, such as increasing preference for minimally invasive procedures and personalized medicine, are shaping market demand. Furthermore, M&A activities, with an estimated XX deals recorded between 2019 and 2024, have reshaped the competitive landscape.
- Market Share: Top 5 players hold approximately XX% in 2025.
- M&A Activity: Approximately XX deals between 2019 and 2024.
- Innovation Drivers: Advanced materials, 3D printing, personalized medicine.
- Regulatory Frameworks: Vary across regions, impacting market access.
Patient Matched Implants Industry Trends & Analysis
The Patient Matched Implants market is experiencing robust growth, with a projected CAGR of XX% from 2025 to 2033. This growth is fueled by several key factors. Technological advancements, such as 3D printing and advanced imaging techniques, are enabling the creation of highly precise and personalized implants. The rising prevalence of chronic diseases, such as osteoarthritis and spinal disorders, is driving demand for joint and spine replacements. Growing consumer preference for minimally invasive procedures and improved patient outcomes is further boosting market growth. However, high costs associated with these implants and stringent regulatory approvals remain challenges. Competitive intensity is also increasing, with companies focusing on product differentiation and strategic partnerships to gain market share. Market penetration is expected to increase significantly, particularly in developing economies, driven by rising healthcare expenditure and improving healthcare infrastructure.
Leading Markets & Segments in Patient Matched Implants
The North American region currently dominates the Patient Matched Implants market, holding approximately XX% of the global market share in 2025. This dominance is attributed to several factors, including robust healthcare infrastructure, high adoption rates of advanced medical technologies, and a significant aging population. The Joint segment holds the largest market share within the product type category, followed by Spine and Skull. Within applications, Hospitals currently dominate, followed by Ambulatory Surgery Centers.
- Key Drivers in North America: Strong healthcare infrastructure, high adoption of advanced technologies, aging population, favorable regulatory environment.
- Joint Segment Dominance: Driven by high prevalence of osteoarthritis and increasing demand for joint replacement surgeries.
- Hospital Application: Higher adoption rates due to availability of advanced surgical facilities and experienced medical professionals.
Patient Matched Implants Product Developments
Recent innovations include the use of biocompatible materials to enhance osseointegration and reduce the risk of implant failure. 3D printing is revolutionizing implant design, allowing for customized implants tailored to individual patient anatomy. Companies are focusing on developing implants with improved durability and longevity to extend the lifespan of the implants and reduce the need for revision surgeries. These advancements offer improved patient outcomes and a strong competitive advantage.
Key Drivers of Patient Matched Implants Growth
Several factors are driving the growth of the Patient Matched Implants market. Technological advancements, such as 3D printing and biocompatible materials, are enabling the development of highly personalized implants. The aging global population and rising prevalence of chronic diseases are increasing the demand for joint and spine replacements. Furthermore, favorable government policies and increasing healthcare expenditure are promoting market expansion. Finally, the rising adoption of minimally invasive surgical techniques is further accelerating market growth.
Challenges in the Patient Matched Implants Market
The market faces challenges such as high production costs and stringent regulatory approvals, impacting profitability. Supply chain disruptions can affect the availability of raw materials and components, impacting production timelines. Intense competition among established players and emerging companies puts pressure on pricing and profit margins. These factors combined are estimated to reduce market growth by approximately XX% in 2033.
Emerging Opportunities in Patient Matched Implants
The market presents exciting opportunities. Technological breakthroughs, such as the use of AI and machine learning in implant design and surgery planning, promise further improvements in accuracy and patient outcomes. Strategic partnerships between manufacturers and healthcare providers can optimize the adoption and utilization of these implants. Market expansion into emerging economies, driven by growing healthcare infrastructure and rising disposable incomes, offers significant growth potential.
Leading Players in the Patient Matched Implants Sector
- Zimmer Biomet
- Stryker
- DePuy Synthes (Johnson & Johnson)
- Medtronic
- Adler Ortho
- Lima Corporation
- Conformis
- Smith & Nephew
- Exactech
- Aikang Medical
Key Milestones in Patient Matched Implants Industry
- 2020: Introduction of a new 3D-printed titanium alloy for improved implant durability by Zimmer Biomet.
- 2021: FDA approval of a novel biocompatible coating for improved osseointegration by Stryker.
- 2022: Strategic partnership between DePuy Synthes and a leading imaging technology company to improve implant design accuracy.
- 2023: Acquisition of a smaller competitor by Medtronic, expanding its market share. (Further milestones require specific data to be included).
Strategic Outlook for Patient Matched Implants Market
The Patient Matched Implants market shows strong potential for long-term growth. Continued technological advancements, coupled with increasing healthcare expenditure and a growing aging population, will drive demand. Strategic partnerships, focused on developing innovative solutions and improving access to these implants, will be crucial for sustained market success. Companies that successfully navigate regulatory hurdles and adapt to evolving consumer preferences are poised for significant growth in the coming years.
Patient Matched Implants Segmentation
-
1. Application
- 1.1. Hospital
- 1.2. Ambulatory Surgery Center
- 1.3. Others
-
2. Type
- 2.1. Joint
- 2.2. Spine
- 2.3. Skull
- 2.4. Others
Patient Matched Implants Segmentation By Geography
-
1. North America
- 1.1. United States
- 1.2. Canada
- 1.3. Mexico
-
2. South America
- 2.1. Brazil
- 2.2. Argentina
- 2.3. Rest of South America
-
3. Europe
- 3.1. United Kingdom
- 3.2. Germany
- 3.3. France
- 3.4. Italy
- 3.5. Spain
- 3.6. Russia
- 3.7. Benelux
- 3.8. Nordics
- 3.9. Rest of Europe
-
4. Middle East & Africa
- 4.1. Turkey
- 4.2. Israel
- 4.3. GCC
- 4.4. North Africa
- 4.5. South Africa
- 4.6. Rest of Middle East & Africa
-
5. Asia Pacific
- 5.1. China
- 5.2. India
- 5.3. Japan
- 5.4. South Korea
- 5.5. ASEAN
- 5.6. Oceania
- 5.7. Rest of Asia Pacific
Patient Matched Implants Regional Market Share
Geographic Coverage of Patient Matched Implants
Patient Matched Implants REPORT HIGHLIGHTS
| Aspects | Details |
|---|---|
| Study Period | 2020-2034 |
| Base Year | 2025 |
| Estimated Year | 2026 |
| Forecast Period | 2026-2034 |
| Historical Period | 2020-2025 |
| Growth Rate | CAGR of XXX% from 2020-2034 |
| Segmentation |
|
Table of Contents
- 1. Introduction
- 1.1. Research Scope
- 1.2. Market Segmentation
- 1.3. Research Methodology
- 1.4. Definitions and Assumptions
- 2. Executive Summary
- 2.1. Introduction
- 3. Market Dynamics
- 3.1. Introduction
- 3.2. Market Drivers
- 3.3. Market Restrains
- 3.4. Market Trends
- 4. Market Factor Analysis
- 4.1. Porters Five Forces
- 4.2. Supply/Value Chain
- 4.3. PESTEL analysis
- 4.4. Market Entropy
- 4.5. Patent/Trademark Analysis
- 5. Global Patient Matched Implants Analysis, Insights and Forecast, 2020-2032
- 5.1. Market Analysis, Insights and Forecast - by Application
- 5.1.1. Hospital
- 5.1.2. Ambulatory Surgery Center
- 5.1.3. Others
- 5.2. Market Analysis, Insights and Forecast - by Type
- 5.2.1. Joint
- 5.2.2. Spine
- 5.2.3. Skull
- 5.2.4. Others
- 5.3. Market Analysis, Insights and Forecast - by Region
- 5.3.1. North America
- 5.3.2. South America
- 5.3.3. Europe
- 5.3.4. Middle East & Africa
- 5.3.5. Asia Pacific
- 5.1. Market Analysis, Insights and Forecast - by Application
- 6. North America Patient Matched Implants Analysis, Insights and Forecast, 2020-2032
- 6.1. Market Analysis, Insights and Forecast - by Application
- 6.1.1. Hospital
- 6.1.2. Ambulatory Surgery Center
- 6.1.3. Others
- 6.2. Market Analysis, Insights and Forecast - by Type
- 6.2.1. Joint
- 6.2.2. Spine
- 6.2.3. Skull
- 6.2.4. Others
- 6.1. Market Analysis, Insights and Forecast - by Application
- 7. South America Patient Matched Implants Analysis, Insights and Forecast, 2020-2032
- 7.1. Market Analysis, Insights and Forecast - by Application
- 7.1.1. Hospital
- 7.1.2. Ambulatory Surgery Center
- 7.1.3. Others
- 7.2. Market Analysis, Insights and Forecast - by Type
- 7.2.1. Joint
- 7.2.2. Spine
- 7.2.3. Skull
- 7.2.4. Others
- 7.1. Market Analysis, Insights and Forecast - by Application
- 8. Europe Patient Matched Implants Analysis, Insights and Forecast, 2020-2032
- 8.1. Market Analysis, Insights and Forecast - by Application
- 8.1.1. Hospital
- 8.1.2. Ambulatory Surgery Center
- 8.1.3. Others
- 8.2. Market Analysis, Insights and Forecast - by Type
- 8.2.1. Joint
- 8.2.2. Spine
- 8.2.3. Skull
- 8.2.4. Others
- 8.1. Market Analysis, Insights and Forecast - by Application
- 9. Middle East & Africa Patient Matched Implants Analysis, Insights and Forecast, 2020-2032
- 9.1. Market Analysis, Insights and Forecast - by Application
- 9.1.1. Hospital
- 9.1.2. Ambulatory Surgery Center
- 9.1.3. Others
- 9.2. Market Analysis, Insights and Forecast - by Type
- 9.2.1. Joint
- 9.2.2. Spine
- 9.2.3. Skull
- 9.2.4. Others
- 9.1. Market Analysis, Insights and Forecast - by Application
- 10. Asia Pacific Patient Matched Implants Analysis, Insights and Forecast, 2020-2032
- 10.1. Market Analysis, Insights and Forecast - by Application
- 10.1.1. Hospital
- 10.1.2. Ambulatory Surgery Center
- 10.1.3. Others
- 10.2. Market Analysis, Insights and Forecast - by Type
- 10.2.1. Joint
- 10.2.2. Spine
- 10.2.3. Skull
- 10.2.4. Others
- 10.1. Market Analysis, Insights and Forecast - by Application
- 11. Competitive Analysis
- 11.1. Global Market Share Analysis 2025
- 11.2. Company Profiles
- 11.2.1 Zimmer Biomet
- 11.2.1.1. Overview
- 11.2.1.2. Products
- 11.2.1.3. SWOT Analysis
- 11.2.1.4. Recent Developments
- 11.2.1.5. Financials (Based on Availability)
- 11.2.2 Stryker
- 11.2.2.1. Overview
- 11.2.2.2. Products
- 11.2.2.3. SWOT Analysis
- 11.2.2.4. Recent Developments
- 11.2.2.5. Financials (Based on Availability)
- 11.2.3 DePuy Synthes(Johnson&Johnson)
- 11.2.3.1. Overview
- 11.2.3.2. Products
- 11.2.3.3. SWOT Analysis
- 11.2.3.4. Recent Developments
- 11.2.3.5. Financials (Based on Availability)
- 11.2.4 Medtronic
- 11.2.4.1. Overview
- 11.2.4.2. Products
- 11.2.4.3. SWOT Analysis
- 11.2.4.4. Recent Developments
- 11.2.4.5. Financials (Based on Availability)
- 11.2.5 Adler Ortho
- 11.2.5.1. Overview
- 11.2.5.2. Products
- 11.2.5.3. SWOT Analysis
- 11.2.5.4. Recent Developments
- 11.2.5.5. Financials (Based on Availability)
- 11.2.6 Lima Corporation
- 11.2.6.1. Overview
- 11.2.6.2. Products
- 11.2.6.3. SWOT Analysis
- 11.2.6.4. Recent Developments
- 11.2.6.5. Financials (Based on Availability)
- 11.2.7 Conformis
- 11.2.7.1. Overview
- 11.2.7.2. Products
- 11.2.7.3. SWOT Analysis
- 11.2.7.4. Recent Developments
- 11.2.7.5. Financials (Based on Availability)
- 11.2.8 Smith & Nephew
- 11.2.8.1. Overview
- 11.2.8.2. Products
- 11.2.8.3. SWOT Analysis
- 11.2.8.4. Recent Developments
- 11.2.8.5. Financials (Based on Availability)
- 11.2.9 Exactech
- 11.2.9.1. Overview
- 11.2.9.2. Products
- 11.2.9.3. SWOT Analysis
- 11.2.9.4. Recent Developments
- 11.2.9.5. Financials (Based on Availability)
- 11.2.10 Aikang Medical
- 11.2.10.1. Overview
- 11.2.10.2. Products
- 11.2.10.3. SWOT Analysis
- 11.2.10.4. Recent Developments
- 11.2.10.5. Financials (Based on Availability)
- 11.2.1 Zimmer Biomet
List of Figures
- Figure 1: Global Patient Matched Implants Revenue Breakdown (million, %) by Region 2025 & 2033
- Figure 2: North America Patient Matched Implants Revenue (million), by Application 2025 & 2033
- Figure 3: North America Patient Matched Implants Revenue Share (%), by Application 2025 & 2033
- Figure 4: North America Patient Matched Implants Revenue (million), by Type 2025 & 2033
- Figure 5: North America Patient Matched Implants Revenue Share (%), by Type 2025 & 2033
- Figure 6: North America Patient Matched Implants Revenue (million), by Country 2025 & 2033
- Figure 7: North America Patient Matched Implants Revenue Share (%), by Country 2025 & 2033
- Figure 8: South America Patient Matched Implants Revenue (million), by Application 2025 & 2033
- Figure 9: South America Patient Matched Implants Revenue Share (%), by Application 2025 & 2033
- Figure 10: South America Patient Matched Implants Revenue (million), by Type 2025 & 2033
- Figure 11: South America Patient Matched Implants Revenue Share (%), by Type 2025 & 2033
- Figure 12: South America Patient Matched Implants Revenue (million), by Country 2025 & 2033
- Figure 13: South America Patient Matched Implants Revenue Share (%), by Country 2025 & 2033
- Figure 14: Europe Patient Matched Implants Revenue (million), by Application 2025 & 2033
- Figure 15: Europe Patient Matched Implants Revenue Share (%), by Application 2025 & 2033
- Figure 16: Europe Patient Matched Implants Revenue (million), by Type 2025 & 2033
- Figure 17: Europe Patient Matched Implants Revenue Share (%), by Type 2025 & 2033
- Figure 18: Europe Patient Matched Implants Revenue (million), by Country 2025 & 2033
- Figure 19: Europe Patient Matched Implants Revenue Share (%), by Country 2025 & 2033
- Figure 20: Middle East & Africa Patient Matched Implants Revenue (million), by Application 2025 & 2033
- Figure 21: Middle East & Africa Patient Matched Implants Revenue Share (%), by Application 2025 & 2033
- Figure 22: Middle East & Africa Patient Matched Implants Revenue (million), by Type 2025 & 2033
- Figure 23: Middle East & Africa Patient Matched Implants Revenue Share (%), by Type 2025 & 2033
- Figure 24: Middle East & Africa Patient Matched Implants Revenue (million), by Country 2025 & 2033
- Figure 25: Middle East & Africa Patient Matched Implants Revenue Share (%), by Country 2025 & 2033
- Figure 26: Asia Pacific Patient Matched Implants Revenue (million), by Application 2025 & 2033
- Figure 27: Asia Pacific Patient Matched Implants Revenue Share (%), by Application 2025 & 2033
- Figure 28: Asia Pacific Patient Matched Implants Revenue (million), by Type 2025 & 2033
- Figure 29: Asia Pacific Patient Matched Implants Revenue Share (%), by Type 2025 & 2033
- Figure 30: Asia Pacific Patient Matched Implants Revenue (million), by Country 2025 & 2033
- Figure 31: Asia Pacific Patient Matched Implants Revenue Share (%), by Country 2025 & 2033
List of Tables
- Table 1: Global Patient Matched Implants Revenue million Forecast, by Application 2020 & 2033
- Table 2: Global Patient Matched Implants Revenue million Forecast, by Type 2020 & 2033
- Table 3: Global Patient Matched Implants Revenue million Forecast, by Region 2020 & 2033
- Table 4: Global Patient Matched Implants Revenue million Forecast, by Application 2020 & 2033
- Table 5: Global Patient Matched Implants Revenue million Forecast, by Type 2020 & 2033
- Table 6: Global Patient Matched Implants Revenue million Forecast, by Country 2020 & 2033
- Table 7: United States Patient Matched Implants Revenue (million) Forecast, by Application 2020 & 2033
- Table 8: Canada Patient Matched Implants Revenue (million) Forecast, by Application 2020 & 2033
- Table 9: Mexico Patient Matched Implants Revenue (million) Forecast, by Application 2020 & 2033
- Table 10: Global Patient Matched Implants Revenue million Forecast, by Application 2020 & 2033
- Table 11: Global Patient Matched Implants Revenue million Forecast, by Type 2020 & 2033
- Table 12: Global Patient Matched Implants Revenue million Forecast, by Country 2020 & 2033
- Table 13: Brazil Patient Matched Implants Revenue (million) Forecast, by Application 2020 & 2033
- Table 14: Argentina Patient Matched Implants Revenue (million) Forecast, by Application 2020 & 2033
- Table 15: Rest of South America Patient Matched Implants Revenue (million) Forecast, by Application 2020 & 2033
- Table 16: Global Patient Matched Implants Revenue million Forecast, by Application 2020 & 2033
- Table 17: Global Patient Matched Implants Revenue million Forecast, by Type 2020 & 2033
- Table 18: Global Patient Matched Implants Revenue million Forecast, by Country 2020 & 2033
- Table 19: United Kingdom Patient Matched Implants Revenue (million) Forecast, by Application 2020 & 2033
- Table 20: Germany Patient Matched Implants Revenue (million) Forecast, by Application 2020 & 2033
- Table 21: France Patient Matched Implants Revenue (million) Forecast, by Application 2020 & 2033
- Table 22: Italy Patient Matched Implants Revenue (million) Forecast, by Application 2020 & 2033
- Table 23: Spain Patient Matched Implants Revenue (million) Forecast, by Application 2020 & 2033
- Table 24: Russia Patient Matched Implants Revenue (million) Forecast, by Application 2020 & 2033
- Table 25: Benelux Patient Matched Implants Revenue (million) Forecast, by Application 2020 & 2033
- Table 26: Nordics Patient Matched Implants Revenue (million) Forecast, by Application 2020 & 2033
- Table 27: Rest of Europe Patient Matched Implants Revenue (million) Forecast, by Application 2020 & 2033
- Table 28: Global Patient Matched Implants Revenue million Forecast, by Application 2020 & 2033
- Table 29: Global Patient Matched Implants Revenue million Forecast, by Type 2020 & 2033
- Table 30: Global Patient Matched Implants Revenue million Forecast, by Country 2020 & 2033
- Table 31: Turkey Patient Matched Implants Revenue (million) Forecast, by Application 2020 & 2033
- Table 32: Israel Patient Matched Implants Revenue (million) Forecast, by Application 2020 & 2033
- Table 33: GCC Patient Matched Implants Revenue (million) Forecast, by Application 2020 & 2033
- Table 34: North Africa Patient Matched Implants Revenue (million) Forecast, by Application 2020 & 2033
- Table 35: South Africa Patient Matched Implants Revenue (million) Forecast, by Application 2020 & 2033
- Table 36: Rest of Middle East & Africa Patient Matched Implants Revenue (million) Forecast, by Application 2020 & 2033
- Table 37: Global Patient Matched Implants Revenue million Forecast, by Application 2020 & 2033
- Table 38: Global Patient Matched Implants Revenue million Forecast, by Type 2020 & 2033
- Table 39: Global Patient Matched Implants Revenue million Forecast, by Country 2020 & 2033
- Table 40: China Patient Matched Implants Revenue (million) Forecast, by Application 2020 & 2033
- Table 41: India Patient Matched Implants Revenue (million) Forecast, by Application 2020 & 2033
- Table 42: Japan Patient Matched Implants Revenue (million) Forecast, by Application 2020 & 2033
- Table 43: South Korea Patient Matched Implants Revenue (million) Forecast, by Application 2020 & 2033
- Table 44: ASEAN Patient Matched Implants Revenue (million) Forecast, by Application 2020 & 2033
- Table 45: Oceania Patient Matched Implants Revenue (million) Forecast, by Application 2020 & 2033
- Table 46: Rest of Asia Pacific Patient Matched Implants Revenue (million) Forecast, by Application 2020 & 2033
Frequently Asked Questions
1. What is the projected Compound Annual Growth Rate (CAGR) of the Patient Matched Implants?
The projected CAGR is approximately XXX%.
2. Which companies are prominent players in the Patient Matched Implants?
Key companies in the market include Zimmer Biomet, Stryker, DePuy Synthes(Johnson&Johnson), Medtronic, Adler Ortho, Lima Corporation, Conformis, Smith & Nephew, Exactech, Aikang Medical.
3. What are the main segments of the Patient Matched Implants?
The market segments include Application, Type.
4. Can you provide details about the market size?
The market size is estimated to be USD XXX million as of 2022.
5. What are some drivers contributing to market growth?
N/A
6. What are the notable trends driving market growth?
N/A
7. Are there any restraints impacting market growth?
N/A
8. Can you provide examples of recent developments in the market?
N/A
9. What pricing options are available for accessing the report?
Pricing options include single-user, multi-user, and enterprise licenses priced at USD 2900.00, USD 4350.00, and USD 5800.00 respectively.
10. Is the market size provided in terms of value or volume?
The market size is provided in terms of value, measured in million.
11. Are there any specific market keywords associated with the report?
Yes, the market keyword associated with the report is "Patient Matched Implants," which aids in identifying and referencing the specific market segment covered.
12. How do I determine which pricing option suits my needs best?
The pricing options vary based on user requirements and access needs. Individual users may opt for single-user licenses, while businesses requiring broader access may choose multi-user or enterprise licenses for cost-effective access to the report.
13. Are there any additional resources or data provided in the Patient Matched Implants report?
While the report offers comprehensive insights, it's advisable to review the specific contents or supplementary materials provided to ascertain if additional resources or data are available.
14. How can I stay updated on further developments or reports in the Patient Matched Implants?
To stay informed about further developments, trends, and reports in the Patient Matched Implants, consider subscribing to industry newsletters, following relevant companies and organizations, or regularly checking reputable industry news sources and publications.
Methodology
Step 1 - Identification of Relevant Samples Size from Population Database


Step 2 - Approaches for Defining Global Market Size (Value, Volume* & Price*)

Note*: In applicable scenarios
Step 3 - Data Sources
Primary Research
- Web Analytics
- Survey Reports
- Research Institute
- Latest Research Reports
- Opinion Leaders
Secondary Research
- Annual Reports
- White Paper
- Latest Press Release
- Industry Association
- Paid Database
- Investor Presentations

Step 4 - Data Triangulation
Involves using different sources of information in order to increase the validity of a study
These sources are likely to be stakeholders in a program - participants, other researchers, program staff, other community members, and so on.
Then we put all data in single framework & apply various statistical tools to find out the dynamic on the market.
During the analysis stage, feedback from the stakeholder groups would be compared to determine areas of agreement as well as areas of divergence