

Key Insights
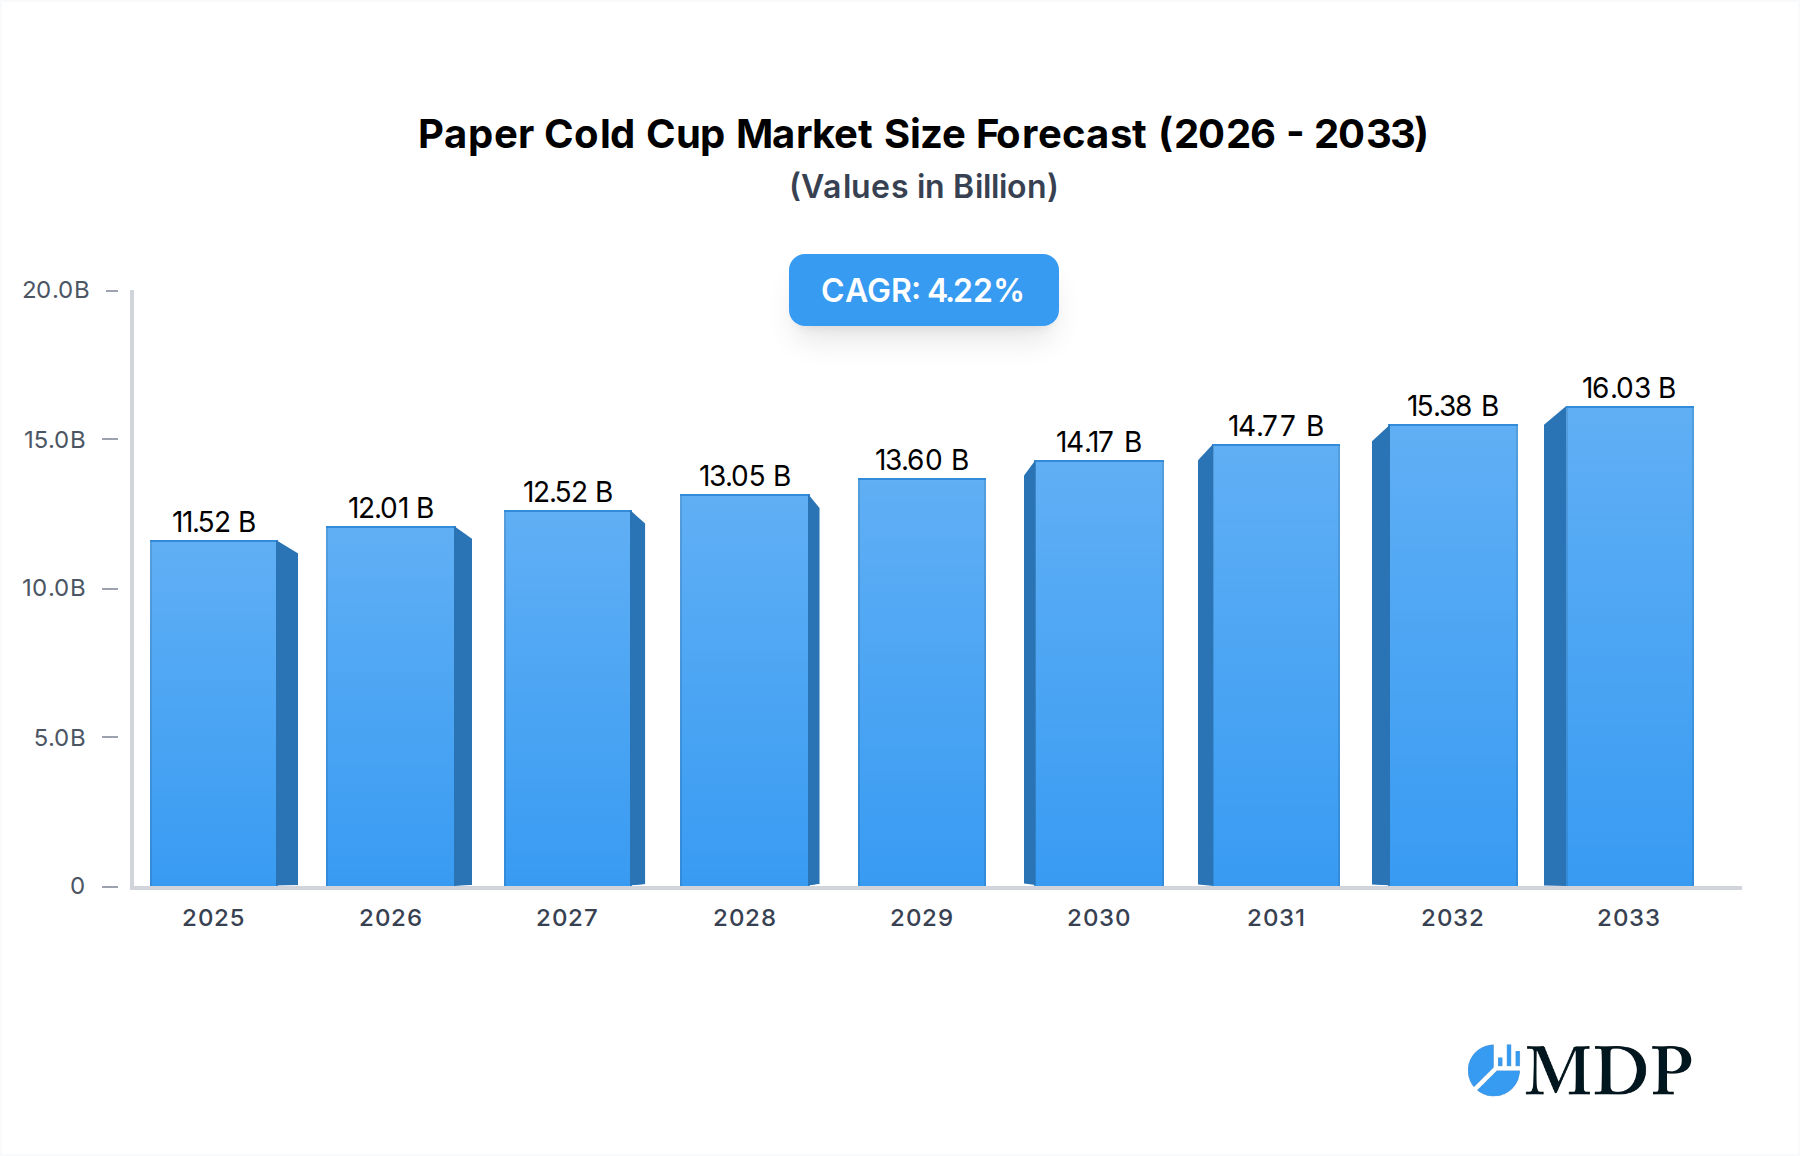
The global Paper Cold Cup market is poised for robust expansion, projected to reach an estimated $11.52 billion in 2025, with a compelling Compound Annual Growth Rate (CAGR) of 4.42% anticipated through 2033. This growth is significantly fueled by a confluence of evolving consumer preferences towards sustainable packaging solutions and the increasing demand for convenient beverage consumption across various sectors. The rising global consciousness regarding environmental impact is a paramount driver, pushing both consumers and businesses towards eco-friendly alternatives like paper cold cups, thereby diminishing reliance on single-use plastics. Furthermore, the dynamic growth of the food and beverage industry, particularly the surge in quick-service restaurants (QSRs) and the expansion of the ready-to-drink beverage segment, directly correlates with the escalating consumption of cold cups. Office buildings and educational institutions are also contributing to this upward trend, recognizing the need for hygienic and sustainable disposable beverage solutions. The market's segmentation by type, with a notable preference for double-walled and triple-walled constructions offering superior insulation and user experience, further underpins its growth trajectory. Leading companies are investing in innovative designs and sustainable manufacturing processes to capture a larger market share.

Paper Cold Cup Market Size (In Billion)
The market's expansion is not without its challenges. While the demand for paper cold cups is steadily increasing, the inherent cost of sustainable materials and manufacturing processes can present a restraint for some market players and price-sensitive consumers. Fluctuations in raw material prices, particularly pulp, can also impact profit margins. However, the overarching trend towards a circular economy and stringent government regulations phasing out single-use plastics are powerful counterbalances, driving innovation and investment in more cost-effective and sustainable production methods. Regional dynamics play a crucial role, with Asia Pacific, led by China and India, emerging as a significant growth engine due to its rapidly expanding disposable income, urbanization, and the burgeoning food service industry. North America and Europe continue to be dominant markets, driven by high consumer awareness and established regulatory frameworks promoting sustainable packaging. The Middle East & Africa and South America represent burgeoning markets with substantial untapped potential for growth. The continued innovation in paper cup technology, focusing on improved durability, leak resistance, and enhanced aesthetic appeal, will be critical in maintaining market momentum.
Paper Cold Cup Company Market Share
This comprehensive Paper Cold Cup Market Report delves into the dynamic landscape of disposable beverage containers, offering a billion-dollar perspective on market trends, competitive strategies, and future projections. Covering the historical period from 2019 to 2024, a base year of 2025, and an extensive forecast period up to 2033, this report is an indispensable resource for industry stakeholders seeking to navigate the evolving global paper cold cup industry. With detailed analysis across key segments, applications, and product types, this report provides actionable insights and strategic guidance.
Paper Cold Cup Market Dynamics & Concentration
The global paper cold cup market exhibits a dynamic yet concentrated nature, with a few dominant players holding significant market share. Our analysis indicates a market concentration ratio of approximately 65%, reflecting the substantial influence of leading manufacturers. Innovation serves as a primary driver, fueled by advancements in sustainable materials and printing technologies, contributing to an estimated 10% annual increase in product innovation. Regulatory frameworks, particularly those concerning single-use plastics and environmental impact, are shaping market access and product development, pushing for biodegradable and recyclable solutions. Product substitutes, such as reusable cups and other disposable alternatives, pose a constant competitive challenge, influencing pricing strategies and market penetration. End-user trends are overwhelmingly leaning towards convenience and sustainability, with a projected 8% annual growth in demand from sectors prioritizing eco-friendly packaging. Mergers and acquisitions (M&A) activities are strategically significant, with an estimated 15 major M&A deals in the historical period, indicating a consolidation trend driven by the pursuit of market expansion and economies of scale.
Paper Cold Cup Industry Trends & Analysis
The paper cold cup industry is poised for significant expansion, projected to grow at a Compound Annual Growth Rate (CAGR) of approximately 7.5% over the forecast period. This robust growth is propelled by a confluence of factors, including an escalating global demand for convenient on-the-go beverage consumption, particularly from the Quick Service Restaurant (QSR) sector, which accounts for an estimated 45% of total market consumption. Technological disruptions are playing a pivotal role, with advancements in leak-proof coatings and enhanced insulation properties for paper cups driving product differentiation and consumer preference. The increasing consumer consciousness regarding environmental sustainability is a major market penetration driver, pushing manufacturers to invest in and promote cups made from recycled materials and those that are fully biodegradable or compostable. This trend is projected to see the market share of sustainable paper cold cups reach an estimated 70% by 2033. Competitive dynamics are intensifying, with both established players and emerging companies vying for market dominance. Key players are focusing on innovation in branding and customization capabilities, alongside efforts to reduce the carbon footprint associated with production and distribution. The market penetration of paper cold cups is currently estimated at 60% across developed economies, with significant room for growth in emerging markets, driven by increasing disposable incomes and the expansion of the food service industry. The ongoing shift away from plastic alternatives further solidifies the position of paper cold cups as a preferred choice for many applications, underscoring the industry's resilience and adaptability. The estimated market size in the base year 2025 is valued at USD 20 billion, with projections indicating a substantial increase to USD 35 billion by 2033, reflecting the strong underlying demand and positive market trajectory.
Leading Markets & Segments in Paper Cold Cup
The Quick Service Restaurants (QSR) segment stands as the dominant force within the global paper cold cup market, driven by its inherent reliance on high-volume, disposable packaging solutions for a vast customer base. This segment is projected to account for an estimated 50% of the total market value by 2033. The consistent demand from fast-food chains for efficient and cost-effective beverage serving solutions, coupled with the convenience factor for consumers, solidifies QSR’s leading position.
- Quick Service Restaurants (QSR): Economic policies favoring the expansion of the food service industry, coupled with ongoing infrastructure development in urban and suburban areas, directly support the growth of QSRs and, consequently, the demand for paper cold cups. The increasing popularity of drive-thru services and delivery platforms further amplifies this demand.
- Office and Educational Institutions: This segment represents a significant, albeit secondary, market. Increasing workforce populations and student enrollments contribute to a steady demand for convenient beverage options. Growing awareness of hygiene and single-use convenience in these settings also bolsters consumption.
- Residential Uses: While traditionally a smaller segment, residential use is witnessing a gradual increase, particularly with the rise of home delivery services and increased consumer focus on convenience during leisure activities.
- Others: This encompassing category includes events, catering, and various retail environments that contribute to the overall demand.
In terms of product types, Double Walled paper cold cups are experiencing the most substantial growth and market penetration, capturing an estimated 45% of the market share. This is attributed to their superior insulation properties, which enhance the drinking experience by maintaining beverage temperature for longer periods and preventing condensation, thus offering a more premium feel.
- Double Walled: Key drivers include consumer preference for comfort and a better grip, especially for iced beverages. The enhanced thermal performance is a significant advantage in both hot and cold weather, making them a versatile choice for various QSR offerings.
- Single Walled: While still a significant segment, single-walled cups are gradually losing market share to double-walled alternatives due to their limited insulation capabilities. They remain a cost-effective option for certain applications.
- Triple Walled: This niche segment offers exceptional insulation but comes at a higher price point, limiting its widespread adoption. Its dominance is primarily observed in specialized catering or premium beverage services where utmost temperature retention is critical.
Paper Cold Cup Product Developments
Recent product developments in the paper cold cup sector are heavily focused on enhancing sustainability and user experience. Innovations include advanced plant-based coatings that offer improved barrier properties while remaining fully compostable, significantly reducing environmental impact. Manufacturers are also introducing cups with enhanced insulation technology, such as improved double-wall designs and integrated sleeves, providing superior temperature retention and comfort. Furthermore, advancements in digital printing allow for sophisticated branding and customization, enabling businesses to create visually appealing and personalized cups that enhance brand visibility. The competitive advantage lies in offering eco-friendly solutions without compromising on performance or aesthetics, meeting the evolving demands of environmentally conscious consumers and stringent regulatory environments.
Key Drivers of Paper Cold Cup Growth
The growth of the paper cold cup market is propelled by several key drivers. Firstly, the pervasive global trend towards convenience and on-the-go consumption, particularly within the burgeoning Quick Service Restaurant (QSR) industry, creates a consistent and substantial demand. Secondly, increasing environmental consciousness among consumers and stringent regulations phasing out single-use plastics are significantly favoring the adoption of paper-based alternatives. Technological advancements in material science are leading to more sustainable and functional paper cups, including biodegradable and compostable options with improved insulation. Lastly, the expansion of the food and beverage industry, especially in emerging economies, further fuels market expansion by increasing the accessibility and availability of beverages served in disposable cups.
Challenges in the Paper Cold Cup Market
Despite robust growth, the paper cold cup market faces several challenges. Regulatory hurdles pertaining to the disposal and recyclability of paper cups, especially those with plastic linings, can impact market access and necessitate costly product reformulation. Supply chain disruptions, as witnessed in recent global events, can affect the availability and price of raw materials like paper pulp, leading to increased production costs. Competitive pressures from both established players and innovative new entrants, as well as the ongoing threat from reusable alternatives, require continuous investment in product development and marketing to maintain market share. The cost differential between traditional paper cups and their more sustainable counterparts can also act as a restraint in price-sensitive markets.
Emerging Opportunities in Paper Cold Cup
Emerging opportunities in the paper cold cup market are primarily centered around sustainability and innovation. The increasing consumer and regulatory demand for truly eco-friendly packaging presents a significant catalyst for the widespread adoption of fully compostable and biodegradable paper cups, creating substantial market share potential. Technological breakthroughs in advanced barrier coatings, moving away from traditional plastic liners, offer a crucial avenue for differentiation and market leadership. Strategic partnerships between paper cup manufacturers and bioplastic suppliers or waste management companies can further enhance the circular economy aspect of these products, driving long-term growth. Moreover, market expansion into untapped regions with growing disposable incomes and expanding food service sectors represents a vast untapped opportunity for market penetration and revenue generation.
Leading Players in the Paper Cold Cup Sector
- International Paper Company
- Huhtamaki OYJ
- Dart Container Corporation
- Bender Paper Cups
- Konie Cups International Incorporation
- Go-Pak
- Colpac Ltd.
- DUNI AB
- Pactiv LLC
- World Centric
- Genpak LLC
Key Milestones in Paper Cold Cup Industry
- 2019: Launch of compostable paper cup certifications by leading industry bodies, increasing consumer confidence in sustainable options.
- 2020: Increased adoption of digital printing technologies for enhanced branding on paper cold cups, driven by evolving marketing needs.
- 2021: Significant investment in R&D for advanced, PFAS-free barrier coatings for paper cups, addressing regulatory concerns.
- 2022: Several key players announce ambitious targets for using 100% recycled or responsibly sourced paper for their cup production.
- 2023: Introduction of innovative insulated paper cup designs offering superior temperature retention without plastic sleeves.
- 2024: Growing number of municipalities implementing bans on certain single-use plastics, further accelerating the shift to paper cold cups.
Strategic Outlook for Paper Cold Cup Market
The strategic outlook for the paper cold cup market is exceptionally positive, driven by the convergence of sustainability mandates and evolving consumer preferences for convenience. Growth accelerators include continued innovation in biodegradable and compostable materials, alongside advancements in manufacturing efficiencies to offset any potential cost premiums. Strategic opportunities lie in expanding market reach into developing economies where disposable income and the food service industry are on an upward trajectory. Further consolidation through mergers and acquisitions is anticipated as companies seek to gain economies of scale and secure market leadership in the increasingly competitive landscape. The focus will remain on providing high-performance, eco-conscious solutions that meet both regulatory requirements and the demands of a discerning global consumer base.
Paper Cold Cup Segmentation
-
1. Application
- 1.1. Quick Service Restaurants
- 1.2. Office and Educational Institutions
- 1.3. Residential Uses
- 1.4. Others
-
2. Types
- 2.1. Single Walled
- 2.2. Double Walled
- 2.3. Triple Walled
Paper Cold Cup Segmentation By Geography
-
1. North America
- 1.1. United States
- 1.2. Canada
- 1.3. Mexico
-
2. South America
- 2.1. Brazil
- 2.2. Argentina
- 2.3. Rest of South America
-
3. Europe
- 3.1. United Kingdom
- 3.2. Germany
- 3.3. France
- 3.4. Italy
- 3.5. Spain
- 3.6. Russia
- 3.7. Benelux
- 3.8. Nordics
- 3.9. Rest of Europe
-
4. Middle East & Africa
- 4.1. Turkey
- 4.2. Israel
- 4.3. GCC
- 4.4. North Africa
- 4.5. South Africa
- 4.6. Rest of Middle East & Africa
-
5. Asia Pacific
- 5.1. China
- 5.2. India
- 5.3. Japan
- 5.4. South Korea
- 5.5. ASEAN
- 5.6. Oceania
- 5.7. Rest of Asia Pacific
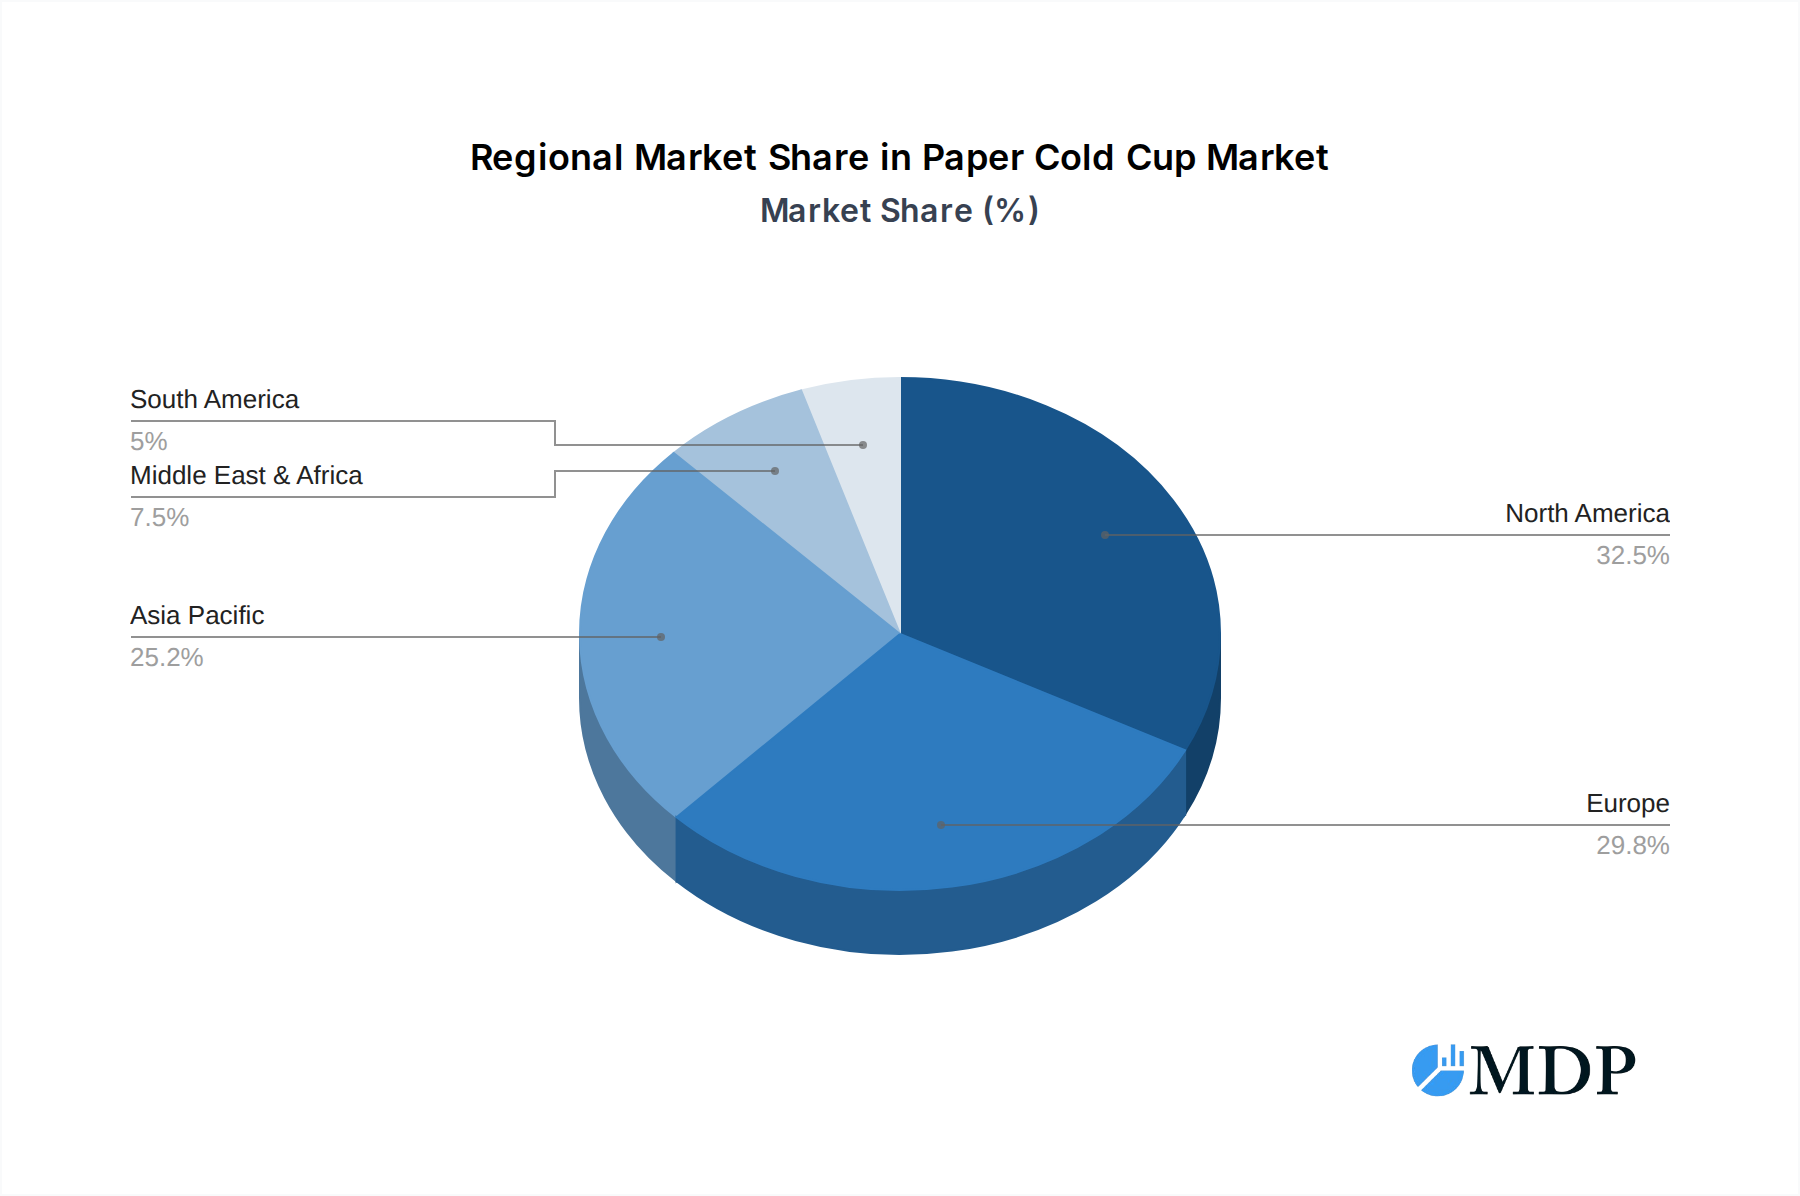
Paper Cold Cup Regional Market Share
Geographic Coverage of Paper Cold Cup
Paper Cold Cup REPORT HIGHLIGHTS
| Aspects | Details |
|---|---|
| Study Period | 2020-2034 |
| Base Year | 2025 |
| Estimated Year | 2026 |
| Forecast Period | 2026-2034 |
| Historical Period | 2020-2025 |
| Growth Rate | CAGR of 4.42% from 2020-2034 |
| Segmentation |
|
Table of Contents
- 1. Introduction
- 1.1. Research Scope
- 1.2. Market Segmentation
- 1.3. Research Methodology
- 1.4. Definitions and Assumptions
- 2. Executive Summary
- 2.1. Introduction
- 3. Market Dynamics
- 3.1. Introduction
- 3.2. Market Drivers
- 3.3. Market Restrains
- 3.4. Market Trends
- 4. Market Factor Analysis
- 4.1. Porters Five Forces
- 4.2. Supply/Value Chain
- 4.3. PESTEL analysis
- 4.4. Market Entropy
- 4.5. Patent/Trademark Analysis
- 5. Global Paper Cold Cup Analysis, Insights and Forecast, 2020-2032
- 5.1. Market Analysis, Insights and Forecast - by Application
- 5.1.1. Quick Service Restaurants
- 5.1.2. Office and Educational Institutions
- 5.1.3. Residential Uses
- 5.1.4. Others
- 5.2. Market Analysis, Insights and Forecast - by Types
- 5.2.1. Single Walled
- 5.2.2. Double Walled
- 5.2.3. Triple Walled
- 5.3. Market Analysis, Insights and Forecast - by Region
- 5.3.1. North America
- 5.3.2. South America
- 5.3.3. Europe
- 5.3.4. Middle East & Africa
- 5.3.5. Asia Pacific
- 5.1. Market Analysis, Insights and Forecast - by Application
- 6. North America Paper Cold Cup Analysis, Insights and Forecast, 2020-2032
- 6.1. Market Analysis, Insights and Forecast - by Application
- 6.1.1. Quick Service Restaurants
- 6.1.2. Office and Educational Institutions
- 6.1.3. Residential Uses
- 6.1.4. Others
- 6.2. Market Analysis, Insights and Forecast - by Types
- 6.2.1. Single Walled
- 6.2.2. Double Walled
- 6.2.3. Triple Walled
- 6.1. Market Analysis, Insights and Forecast - by Application
- 7. South America Paper Cold Cup Analysis, Insights and Forecast, 2020-2032
- 7.1. Market Analysis, Insights and Forecast - by Application
- 7.1.1. Quick Service Restaurants
- 7.1.2. Office and Educational Institutions
- 7.1.3. Residential Uses
- 7.1.4. Others
- 7.2. Market Analysis, Insights and Forecast - by Types
- 7.2.1. Single Walled
- 7.2.2. Double Walled
- 7.2.3. Triple Walled
- 7.1. Market Analysis, Insights and Forecast - by Application
- 8. Europe Paper Cold Cup Analysis, Insights and Forecast, 2020-2032
- 8.1. Market Analysis, Insights and Forecast - by Application
- 8.1.1. Quick Service Restaurants
- 8.1.2. Office and Educational Institutions
- 8.1.3. Residential Uses
- 8.1.4. Others
- 8.2. Market Analysis, Insights and Forecast - by Types
- 8.2.1. Single Walled
- 8.2.2. Double Walled
- 8.2.3. Triple Walled
- 8.1. Market Analysis, Insights and Forecast - by Application
- 9. Middle East & Africa Paper Cold Cup Analysis, Insights and Forecast, 2020-2032
- 9.1. Market Analysis, Insights and Forecast - by Application
- 9.1.1. Quick Service Restaurants
- 9.1.2. Office and Educational Institutions
- 9.1.3. Residential Uses
- 9.1.4. Others
- 9.2. Market Analysis, Insights and Forecast - by Types
- 9.2.1. Single Walled
- 9.2.2. Double Walled
- 9.2.3. Triple Walled
- 9.1. Market Analysis, Insights and Forecast - by Application
- 10. Asia Pacific Paper Cold Cup Analysis, Insights and Forecast, 2020-2032
- 10.1. Market Analysis, Insights and Forecast - by Application
- 10.1.1. Quick Service Restaurants
- 10.1.2. Office and Educational Institutions
- 10.1.3. Residential Uses
- 10.1.4. Others
- 10.2. Market Analysis, Insights and Forecast - by Types
- 10.2.1. Single Walled
- 10.2.2. Double Walled
- 10.2.3. Triple Walled
- 10.1. Market Analysis, Insights and Forecast - by Application
- 11. Competitive Analysis
- 11.1. Global Market Share Analysis 2025
- 11.2. Company Profiles
- 11.2.1 International Paper Company
- 11.2.1.1. Overview
- 11.2.1.2. Products
- 11.2.1.3. SWOT Analysis
- 11.2.1.4. Recent Developments
- 11.2.1.5. Financials (Based on Availability)
- 11.2.2 Huhtamaki OYJ
- 11.2.2.1. Overview
- 11.2.2.2. Products
- 11.2.2.3. SWOT Analysis
- 11.2.2.4. Recent Developments
- 11.2.2.5. Financials (Based on Availability)
- 11.2.3 Dart Container Corporation
- 11.2.3.1. Overview
- 11.2.3.2. Products
- 11.2.3.3. SWOT Analysis
- 11.2.3.4. Recent Developments
- 11.2.3.5. Financials (Based on Availability)
- 11.2.4 Bender Paper Cups
- 11.2.4.1. Overview
- 11.2.4.2. Products
- 11.2.4.3. SWOT Analysis
- 11.2.4.4. Recent Developments
- 11.2.4.5. Financials (Based on Availability)
- 11.2.5 Konie Cups International Incorporation
- 11.2.5.1. Overview
- 11.2.5.2. Products
- 11.2.5.3. SWOT Analysis
- 11.2.5.4. Recent Developments
- 11.2.5.5. Financials (Based on Availability)
- 11.2.6 Go-Pak
- 11.2.6.1. Overview
- 11.2.6.2. Products
- 11.2.6.3. SWOT Analysis
- 11.2.6.4. Recent Developments
- 11.2.6.5. Financials (Based on Availability)
- 11.2.7 Colpac Ltd.
- 11.2.7.1. Overview
- 11.2.7.2. Products
- 11.2.7.3. SWOT Analysis
- 11.2.7.4. Recent Developments
- 11.2.7.5. Financials (Based on Availability)
- 11.2.8 DUNI AB
- 11.2.8.1. Overview
- 11.2.8.2. Products
- 11.2.8.3. SWOT Analysis
- 11.2.8.4. Recent Developments
- 11.2.8.5. Financials (Based on Availability)
- 11.2.9 Pactiv LLC
- 11.2.9.1. Overview
- 11.2.9.2. Products
- 11.2.9.3. SWOT Analysis
- 11.2.9.4. Recent Developments
- 11.2.9.5. Financials (Based on Availability)
- 11.2.10 World Centric
- 11.2.10.1. Overview
- 11.2.10.2. Products
- 11.2.10.3. SWOT Analysis
- 11.2.10.4. Recent Developments
- 11.2.10.5. Financials (Based on Availability)
- 11.2.11 Genpak LLC
- 11.2.11.1. Overview
- 11.2.11.2. Products
- 11.2.11.3. SWOT Analysis
- 11.2.11.4. Recent Developments
- 11.2.11.5. Financials (Based on Availability)
- 11.2.1 International Paper Company
List of Figures
- Figure 1: Global Paper Cold Cup Revenue Breakdown (billion, %) by Region 2025 & 2033
- Figure 2: North America Paper Cold Cup Revenue (billion), by Application 2025 & 2033
- Figure 3: North America Paper Cold Cup Revenue Share (%), by Application 2025 & 2033
- Figure 4: North America Paper Cold Cup Revenue (billion), by Types 2025 & 2033
- Figure 5: North America Paper Cold Cup Revenue Share (%), by Types 2025 & 2033
- Figure 6: North America Paper Cold Cup Revenue (billion), by Country 2025 & 2033
- Figure 7: North America Paper Cold Cup Revenue Share (%), by Country 2025 & 2033
- Figure 8: South America Paper Cold Cup Revenue (billion), by Application 2025 & 2033
- Figure 9: South America Paper Cold Cup Revenue Share (%), by Application 2025 & 2033
- Figure 10: South America Paper Cold Cup Revenue (billion), by Types 2025 & 2033
- Figure 11: South America Paper Cold Cup Revenue Share (%), by Types 2025 & 2033
- Figure 12: South America Paper Cold Cup Revenue (billion), by Country 2025 & 2033
- Figure 13: South America Paper Cold Cup Revenue Share (%), by Country 2025 & 2033
- Figure 14: Europe Paper Cold Cup Revenue (billion), by Application 2025 & 2033
- Figure 15: Europe Paper Cold Cup Revenue Share (%), by Application 2025 & 2033
- Figure 16: Europe Paper Cold Cup Revenue (billion), by Types 2025 & 2033
- Figure 17: Europe Paper Cold Cup Revenue Share (%), by Types 2025 & 2033
- Figure 18: Europe Paper Cold Cup Revenue (billion), by Country 2025 & 2033
- Figure 19: Europe Paper Cold Cup Revenue Share (%), by Country 2025 & 2033
- Figure 20: Middle East & Africa Paper Cold Cup Revenue (billion), by Application 2025 & 2033
- Figure 21: Middle East & Africa Paper Cold Cup Revenue Share (%), by Application 2025 & 2033
- Figure 22: Middle East & Africa Paper Cold Cup Revenue (billion), by Types 2025 & 2033
- Figure 23: Middle East & Africa Paper Cold Cup Revenue Share (%), by Types 2025 & 2033
- Figure 24: Middle East & Africa Paper Cold Cup Revenue (billion), by Country 2025 & 2033
- Figure 25: Middle East & Africa Paper Cold Cup Revenue Share (%), by Country 2025 & 2033
- Figure 26: Asia Pacific Paper Cold Cup Revenue (billion), by Application 2025 & 2033
- Figure 27: Asia Pacific Paper Cold Cup Revenue Share (%), by Application 2025 & 2033
- Figure 28: Asia Pacific Paper Cold Cup Revenue (billion), by Types 2025 & 2033
- Figure 29: Asia Pacific Paper Cold Cup Revenue Share (%), by Types 2025 & 2033
- Figure 30: Asia Pacific Paper Cold Cup Revenue (billion), by Country 2025 & 2033
- Figure 31: Asia Pacific Paper Cold Cup Revenue Share (%), by Country 2025 & 2033
List of Tables
- Table 1: Global Paper Cold Cup Revenue billion Forecast, by Application 2020 & 2033
- Table 2: Global Paper Cold Cup Revenue billion Forecast, by Types 2020 & 2033
- Table 3: Global Paper Cold Cup Revenue billion Forecast, by Region 2020 & 2033
- Table 4: Global Paper Cold Cup Revenue billion Forecast, by Application 2020 & 2033
- Table 5: Global Paper Cold Cup Revenue billion Forecast, by Types 2020 & 2033
- Table 6: Global Paper Cold Cup Revenue billion Forecast, by Country 2020 & 2033
- Table 7: United States Paper Cold Cup Revenue (billion) Forecast, by Application 2020 & 2033
- Table 8: Canada Paper Cold Cup Revenue (billion) Forecast, by Application 2020 & 2033
- Table 9: Mexico Paper Cold Cup Revenue (billion) Forecast, by Application 2020 & 2033
- Table 10: Global Paper Cold Cup Revenue billion Forecast, by Application 2020 & 2033
- Table 11: Global Paper Cold Cup Revenue billion Forecast, by Types 2020 & 2033
- Table 12: Global Paper Cold Cup Revenue billion Forecast, by Country 2020 & 2033
- Table 13: Brazil Paper Cold Cup Revenue (billion) Forecast, by Application 2020 & 2033
- Table 14: Argentina Paper Cold Cup Revenue (billion) Forecast, by Application 2020 & 2033
- Table 15: Rest of South America Paper Cold Cup Revenue (billion) Forecast, by Application 2020 & 2033
- Table 16: Global Paper Cold Cup Revenue billion Forecast, by Application 2020 & 2033
- Table 17: Global Paper Cold Cup Revenue billion Forecast, by Types 2020 & 2033
- Table 18: Global Paper Cold Cup Revenue billion Forecast, by Country 2020 & 2033
- Table 19: United Kingdom Paper Cold Cup Revenue (billion) Forecast, by Application 2020 & 2033
- Table 20: Germany Paper Cold Cup Revenue (billion) Forecast, by Application 2020 & 2033
- Table 21: France Paper Cold Cup Revenue (billion) Forecast, by Application 2020 & 2033
- Table 22: Italy Paper Cold Cup Revenue (billion) Forecast, by Application 2020 & 2033
- Table 23: Spain Paper Cold Cup Revenue (billion) Forecast, by Application 2020 & 2033
- Table 24: Russia Paper Cold Cup Revenue (billion) Forecast, by Application 2020 & 2033
- Table 25: Benelux Paper Cold Cup Revenue (billion) Forecast, by Application 2020 & 2033
- Table 26: Nordics Paper Cold Cup Revenue (billion) Forecast, by Application 2020 & 2033
- Table 27: Rest of Europe Paper Cold Cup Revenue (billion) Forecast, by Application 2020 & 2033
- Table 28: Global Paper Cold Cup Revenue billion Forecast, by Application 2020 & 2033
- Table 29: Global Paper Cold Cup Revenue billion Forecast, by Types 2020 & 2033
- Table 30: Global Paper Cold Cup Revenue billion Forecast, by Country 2020 & 2033
- Table 31: Turkey Paper Cold Cup Revenue (billion) Forecast, by Application 2020 & 2033
- Table 32: Israel Paper Cold Cup Revenue (billion) Forecast, by Application 2020 & 2033
- Table 33: GCC Paper Cold Cup Revenue (billion) Forecast, by Application 2020 & 2033
- Table 34: North Africa Paper Cold Cup Revenue (billion) Forecast, by Application 2020 & 2033
- Table 35: South Africa Paper Cold Cup Revenue (billion) Forecast, by Application 2020 & 2033
- Table 36: Rest of Middle East & Africa Paper Cold Cup Revenue (billion) Forecast, by Application 2020 & 2033
- Table 37: Global Paper Cold Cup Revenue billion Forecast, by Application 2020 & 2033
- Table 38: Global Paper Cold Cup Revenue billion Forecast, by Types 2020 & 2033
- Table 39: Global Paper Cold Cup Revenue billion Forecast, by Country 2020 & 2033
- Table 40: China Paper Cold Cup Revenue (billion) Forecast, by Application 2020 & 2033
- Table 41: India Paper Cold Cup Revenue (billion) Forecast, by Application 2020 & 2033
- Table 42: Japan Paper Cold Cup Revenue (billion) Forecast, by Application 2020 & 2033
- Table 43: South Korea Paper Cold Cup Revenue (billion) Forecast, by Application 2020 & 2033
- Table 44: ASEAN Paper Cold Cup Revenue (billion) Forecast, by Application 2020 & 2033
- Table 45: Oceania Paper Cold Cup Revenue (billion) Forecast, by Application 2020 & 2033
- Table 46: Rest of Asia Pacific Paper Cold Cup Revenue (billion) Forecast, by Application 2020 & 2033
Frequently Asked Questions
1. What is the projected Compound Annual Growth Rate (CAGR) of the Paper Cold Cup?
The projected CAGR is approximately 4.42%.
2. Which companies are prominent players in the Paper Cold Cup?
Key companies in the market include International Paper Company, Huhtamaki OYJ, Dart Container Corporation, Bender Paper Cups, Konie Cups International Incorporation, Go-Pak, Colpac Ltd., DUNI AB, Pactiv LLC, World Centric, Genpak LLC.
3. What are the main segments of the Paper Cold Cup?
The market segments include Application, Types.
4. Can you provide details about the market size?
The market size is estimated to be USD 11.52 billion as of 2022.
5. What are some drivers contributing to market growth?
N/A
6. What are the notable trends driving market growth?
N/A
7. Are there any restraints impacting market growth?
N/A
8. Can you provide examples of recent developments in the market?
N/A
9. What pricing options are available for accessing the report?
Pricing options include single-user, multi-user, and enterprise licenses priced at USD 4900.00, USD 7350.00, and USD 9800.00 respectively.
10. Is the market size provided in terms of value or volume?
The market size is provided in terms of value, measured in billion.
11. Are there any specific market keywords associated with the report?
Yes, the market keyword associated with the report is "Paper Cold Cup," which aids in identifying and referencing the specific market segment covered.
12. How do I determine which pricing option suits my needs best?
The pricing options vary based on user requirements and access needs. Individual users may opt for single-user licenses, while businesses requiring broader access may choose multi-user or enterprise licenses for cost-effective access to the report.
13. Are there any additional resources or data provided in the Paper Cold Cup report?
While the report offers comprehensive insights, it's advisable to review the specific contents or supplementary materials provided to ascertain if additional resources or data are available.
14. How can I stay updated on further developments or reports in the Paper Cold Cup?
To stay informed about further developments, trends, and reports in the Paper Cold Cup, consider subscribing to industry newsletters, following relevant companies and organizations, or regularly checking reputable industry news sources and publications.
Methodology
Step 1 - Identification of Relevant Samples Size from Population Database


Step 2 - Approaches for Defining Global Market Size (Value, Volume* & Price*)

Note*: In applicable scenarios
Step 3 - Data Sources
Primary Research
- Web Analytics
- Survey Reports
- Research Institute
- Latest Research Reports
- Opinion Leaders
Secondary Research
- Annual Reports
- White Paper
- Latest Press Release
- Industry Association
- Paid Database
- Investor Presentations

Step 4 - Data Triangulation
Involves using different sources of information in order to increase the validity of a study
These sources are likely to be stakeholders in a program - participants, other researchers, program staff, other community members, and so on.
Then we put all data in single framework & apply various statistical tools to find out the dynamic on the market.
During the analysis stage, feedback from the stakeholder groups would be compared to determine areas of agreement as well as areas of divergence