

Key Insights
The Paleo food products market is experiencing robust growth, driven by increasing consumer awareness of health and wellness, coupled with a rising preference for natural and minimally processed foods. The market's expansion is fueled by several key factors, including the growing popularity of the Paleo diet, which emphasizes whole, unprocessed foods like lean meats, fruits, vegetables, nuts, and seeds, while excluding grains, legumes, and dairy. This dietary shift reflects a broader consumer trend towards clean eating and a focus on gut health. Furthermore, the increasing prevalence of chronic diseases, such as obesity and diabetes, is motivating consumers to seek healthier alternatives, further bolstering the demand for Paleo-friendly products. The market is segmented by product type (e.g., meat snacks, baked goods, ready-to-eat meals), distribution channel (online, retail stores), and geography, with North America and Europe currently dominating the market share. Competition in the market is moderately intense, with established brands and newer entrants vying for market share. However, opportunities for innovation and expansion exist in product diversification, targeting niche markets, and expanding into international territories.
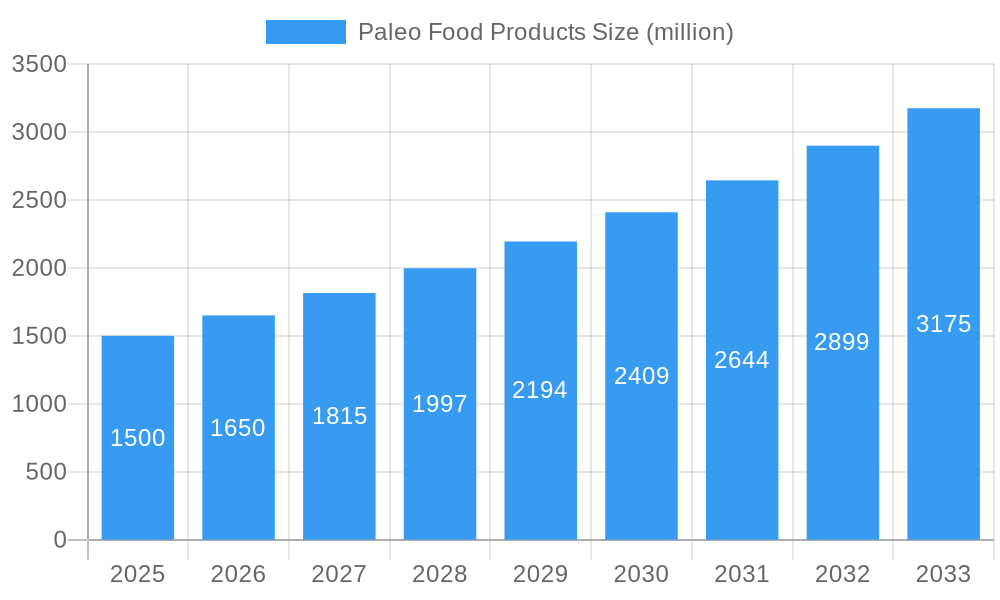
Paleo Food Products Market Size (In Billion)
The market is projected to maintain a steady growth trajectory in the coming years, although potential restraints include the relatively high price point of many Paleo products compared to conventional options and the potential for consumer fatigue related to dietary trends. Continued innovation in product development, focusing on affordability, convenience, and taste profiles, will be crucial for sustained market growth. Strategic partnerships and marketing initiatives emphasizing the health benefits and lifestyle advantages of the Paleo diet can further expand market penetration. The competitive landscape is likely to witness further consolidation through mergers and acquisitions, while new players will continue to enter the market, especially within specific product categories such as ready-to-eat meals and snacks. Successful players will be those that effectively differentiate their products through quality, taste, and branding. Growth will likely be geographically diverse, with developing economies demonstrating substantial potential for market expansion.
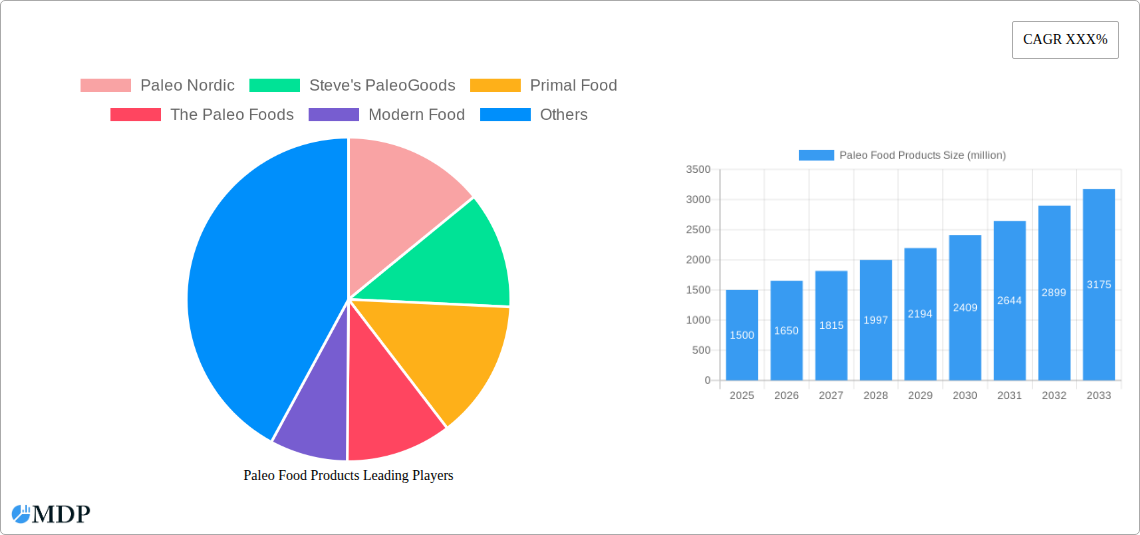
Paleo Food Products Company Market Share
Paleo Food Products Market Report: A Comprehensive Analysis (2019-2033)
This comprehensive report delivers an in-depth analysis of the Paleo Food Products market, projecting a market value exceeding $XX million by 2033. It provides crucial insights for industry stakeholders, investors, and businesses seeking to navigate this rapidly evolving sector. The report covers the historical period (2019-2024), the base year (2025), and forecasts the market's trajectory until 2033. Key players such as Paleo Nordic, Steve's PaleoGoods, Primal Food, The Paleo Foods, Modern Food, Paleo Jerky, Caveman Foods, and Paleo Passion Foods are analyzed extensively.
Paleo Food Products Market Dynamics & Concentration
The Paleo Food Products market exhibits a moderately concentrated landscape, with the top five players commanding approximately xx% of the overall market share in 2025. Market concentration is influenced by factors such as brand recognition, established distribution networks, and innovation capabilities. The historical period (2019-2024) witnessed xx M&A deals, indicating a dynamic competitive environment. Innovation drivers include the rising demand for clean-label products, functional foods, and the increasing awareness of the health benefits associated with a Paleo diet. Regulatory frameworks, while generally supportive of food safety and labeling, pose some challenges, particularly concerning the use of specific ingredients. Product substitutes, such as conventional processed foods and other dietary alternatives, exert competitive pressure. End-user trends point to a growing preference for convenient, ready-to-eat Paleo meals and snacks, driving product diversification.
- Market Share (2025): Top 5 Players - xx%
- M&A Deals (2019-2024): xx
- Key Innovation Drivers: Clean-label products, functional foods, health awareness.
- Regulatory Challenges: Specific ingredient restrictions, labeling requirements.
Paleo Food Products Industry Trends & Analysis
The Paleo Food Products market is experiencing robust growth, projected to register a CAGR of xx% during the forecast period (2025-2033). This growth is propelled by several key factors. The rising prevalence of health-conscious consumers seeking natural and minimally processed food options is a significant driver. Technological disruptions, particularly in food processing and packaging, are enabling the development of innovative products with extended shelf life and enhanced nutritional profiles. Consumer preferences are shifting towards products that cater to specific dietary needs and preferences, including gluten-free, dairy-free, and soy-free options. Competitive dynamics are marked by intense innovation, brand building, and strategic partnerships aimed at capturing market share. Market penetration rates are steadily increasing, particularly in developed economies where awareness of the Paleo diet is high. By 2033, market penetration is estimated to reach xx%.
Leading Markets & Segments in Paleo Food Products
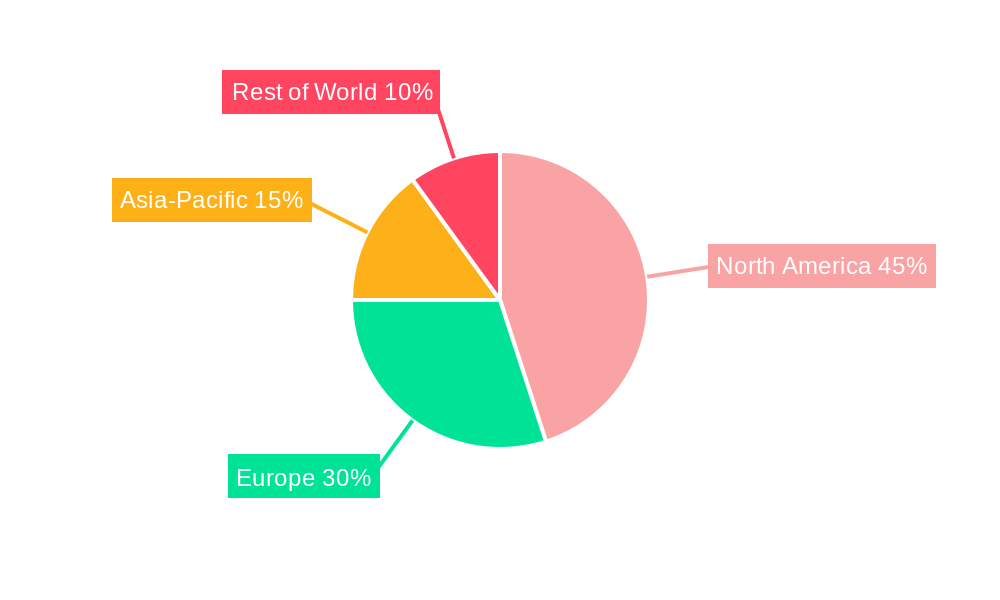
The North American region dominates the Paleo Food Products market, accounting for approximately xx% of the global market share in 2025. This dominance stems from several factors:
- Strong Consumer Demand: High awareness of the Paleo diet and a substantial health-conscious population.
- Established Distribution Channels: Extensive retail networks for health food and specialty grocery stores.
- High Disposable Income: Enabling higher spending on premium food products.
- Technological Advancements: Focus on innovation and product development within the region.
Further analysis reveals significant growth potential in the European and Asia-Pacific markets, driven by increasing disposable incomes and growing health awareness. Within the product segments, ready-to-eat meals and snacks command the largest market share, reflecting consumer demand for convenience.
Paleo Food Products Product Developments
Recent product innovations have focused on improving taste, texture, and convenience while maintaining the integrity of the Paleo diet principles. This includes the development of shelf-stable products using advanced preservation techniques and the introduction of innovative packaging solutions to enhance product appeal and shelf life. Technological advancements in ingredient sourcing and processing are also driving the development of more sustainable and ethically sourced Paleo food products. These innovations are enhancing the market fit of Paleo products by catering to a broader range of consumer needs and preferences.
Key Drivers of Paleo Food Products Growth
Several factors are accelerating the growth of the Paleo Food Products market: increasing health consciousness among consumers, rising disposable incomes in developing economies, technological advancements leading to innovative product formulations and packaging solutions, and favorable regulatory environments in certain regions. The growing demand for clean-label products, coupled with increased awareness of the potential health benefits of a Paleo diet, are significant contributors.
Challenges in the Paleo Food Products Market
The Paleo Food Products market faces challenges including maintaining consistent ingredient sourcing to ensure product quality and affordability, managing supply chain complexities to ensure timely delivery, and navigating evolving regulatory landscapes related to food labeling and ingredient restrictions. These factors can lead to price fluctuations and potentially limit market expansion if not effectively addressed. Intense competition from established and emerging brands also pose a significant challenge.
Emerging Opportunities in Paleo Food Products
Emerging opportunities include strategic partnerships with retailers and distributors to expand market reach, technological breakthroughs in food processing and preservation, enabling longer shelf lives and wider product availability, and tapping into new geographic markets with strong growth potential. Focus on personalized nutrition and the growing interest in functional foods present further avenues for innovation and growth.
Leading Players in the Paleo Food Products Sector
- Paleo Nordic
- Steve's PaleoGoods
- Primal Food
- The Paleo Foods
- Modern Food
- Paleo Jerky
- Caveman Foods
- Paleo Passion Foods
Key Milestones in Paleo Food Products Industry
- 2020: Launch of several innovative Paleo snack products by major players.
- 2021: Increased investment in R&D for sustainable and ethical Paleo food products.
- 2022: Introduction of new regulations on food labeling, impacting the Paleo food sector.
- 2023: Several M&A activities leading to consolidation within the market.
- 2024: Growing focus on personalized nutrition within the Paleo diet segment.
Strategic Outlook for Paleo Food Products Market
The Paleo Food Products market presents significant growth opportunities driven by increasing consumer health consciousness and the demand for natural, minimally processed foods. Strategic partnerships, investments in R&D, and a focus on innovative product development will be crucial for success in this competitive market. Expansion into new geographic markets and exploring opportunities within the functional food segment will unlock further growth potential. The market is expected to witness continued innovation, consolidation, and expansion in the coming years.
Paleo Food Products Segmentation
-
1. Application
- 1.1. Nutritional Bars
- 1.2. Snack Food
- 1.3. Sauce
- 1.4. Others
-
2. Type
- 2.1. Meats
- 2.2. Vegetables
- 2.3. Oils/Fats
- 2.4. Seafood
- 2.5. Fruits
- 2.6. Nuts
Paleo Food Products Segmentation By Geography
-
1. North America
- 1.1. United States
- 1.2. Canada
- 1.3. Mexico
-
2. South America
- 2.1. Brazil
- 2.2. Argentina
- 2.3. Rest of South America
-
3. Europe
- 3.1. United Kingdom
- 3.2. Germany
- 3.3. France
- 3.4. Italy
- 3.5. Spain
- 3.6. Russia
- 3.7. Benelux
- 3.8. Nordics
- 3.9. Rest of Europe
-
4. Middle East & Africa
- 4.1. Turkey
- 4.2. Israel
- 4.3. GCC
- 4.4. North Africa
- 4.5. South Africa
- 4.6. Rest of Middle East & Africa
-
5. Asia Pacific
- 5.1. China
- 5.2. India
- 5.3. Japan
- 5.4. South Korea
- 5.5. ASEAN
- 5.6. Oceania
- 5.7. Rest of Asia Pacific
Paleo Food Products Regional Market Share
Geographic Coverage of Paleo Food Products
Paleo Food Products REPORT HIGHLIGHTS
| Aspects | Details |
|---|---|
| Study Period | 2020-2034 |
| Base Year | 2025 |
| Estimated Year | 2026 |
| Forecast Period | 2026-2034 |
| Historical Period | 2020-2025 |
| Growth Rate | CAGR of 11.2% from 2020-2034 |
| Segmentation |
|
Table of Contents
- 1. Introduction
- 1.1. Research Scope
- 1.2. Market Segmentation
- 1.3. Research Methodology
- 1.4. Definitions and Assumptions
- 2. Executive Summary
- 2.1. Introduction
- 3. Market Dynamics
- 3.1. Introduction
- 3.2. Market Drivers
- 3.3. Market Restrains
- 3.4. Market Trends
- 4. Market Factor Analysis
- 4.1. Porters Five Forces
- 4.2. Supply/Value Chain
- 4.3. PESTEL analysis
- 4.4. Market Entropy
- 4.5. Patent/Trademark Analysis
- 5. Global Paleo Food Products Analysis, Insights and Forecast, 2020-2032
- 5.1. Market Analysis, Insights and Forecast - by Application
- 5.1.1. Nutritional Bars
- 5.1.2. Snack Food
- 5.1.3. Sauce
- 5.1.4. Others
- 5.2. Market Analysis, Insights and Forecast - by Type
- 5.2.1. Meats
- 5.2.2. Vegetables
- 5.2.3. Oils/Fats
- 5.2.4. Seafood
- 5.2.5. Fruits
- 5.2.6. Nuts
- 5.3. Market Analysis, Insights and Forecast - by Region
- 5.3.1. North America
- 5.3.2. South America
- 5.3.3. Europe
- 5.3.4. Middle East & Africa
- 5.3.5. Asia Pacific
- 5.1. Market Analysis, Insights and Forecast - by Application
- 6. North America Paleo Food Products Analysis, Insights and Forecast, 2020-2032
- 6.1. Market Analysis, Insights and Forecast - by Application
- 6.1.1. Nutritional Bars
- 6.1.2. Snack Food
- 6.1.3. Sauce
- 6.1.4. Others
- 6.2. Market Analysis, Insights and Forecast - by Type
- 6.2.1. Meats
- 6.2.2. Vegetables
- 6.2.3. Oils/Fats
- 6.2.4. Seafood
- 6.2.5. Fruits
- 6.2.6. Nuts
- 6.1. Market Analysis, Insights and Forecast - by Application
- 7. South America Paleo Food Products Analysis, Insights and Forecast, 2020-2032
- 7.1. Market Analysis, Insights and Forecast - by Application
- 7.1.1. Nutritional Bars
- 7.1.2. Snack Food
- 7.1.3. Sauce
- 7.1.4. Others
- 7.2. Market Analysis, Insights and Forecast - by Type
- 7.2.1. Meats
- 7.2.2. Vegetables
- 7.2.3. Oils/Fats
- 7.2.4. Seafood
- 7.2.5. Fruits
- 7.2.6. Nuts
- 7.1. Market Analysis, Insights and Forecast - by Application
- 8. Europe Paleo Food Products Analysis, Insights and Forecast, 2020-2032
- 8.1. Market Analysis, Insights and Forecast - by Application
- 8.1.1. Nutritional Bars
- 8.1.2. Snack Food
- 8.1.3. Sauce
- 8.1.4. Others
- 8.2. Market Analysis, Insights and Forecast - by Type
- 8.2.1. Meats
- 8.2.2. Vegetables
- 8.2.3. Oils/Fats
- 8.2.4. Seafood
- 8.2.5. Fruits
- 8.2.6. Nuts
- 8.1. Market Analysis, Insights and Forecast - by Application
- 9. Middle East & Africa Paleo Food Products Analysis, Insights and Forecast, 2020-2032
- 9.1. Market Analysis, Insights and Forecast - by Application
- 9.1.1. Nutritional Bars
- 9.1.2. Snack Food
- 9.1.3. Sauce
- 9.1.4. Others
- 9.2. Market Analysis, Insights and Forecast - by Type
- 9.2.1. Meats
- 9.2.2. Vegetables
- 9.2.3. Oils/Fats
- 9.2.4. Seafood
- 9.2.5. Fruits
- 9.2.6. Nuts
- 9.1. Market Analysis, Insights and Forecast - by Application
- 10. Asia Pacific Paleo Food Products Analysis, Insights and Forecast, 2020-2032
- 10.1. Market Analysis, Insights and Forecast - by Application
- 10.1.1. Nutritional Bars
- 10.1.2. Snack Food
- 10.1.3. Sauce
- 10.1.4. Others
- 10.2. Market Analysis, Insights and Forecast - by Type
- 10.2.1. Meats
- 10.2.2. Vegetables
- 10.2.3. Oils/Fats
- 10.2.4. Seafood
- 10.2.5. Fruits
- 10.2.6. Nuts
- 10.1. Market Analysis, Insights and Forecast - by Application
- 11. Competitive Analysis
- 11.1. Global Market Share Analysis 2025
- 11.2. Company Profiles
- 11.2.1 Paleo Nordic
- 11.2.1.1. Overview
- 11.2.1.2. Products
- 11.2.1.3. SWOT Analysis
- 11.2.1.4. Recent Developments
- 11.2.1.5. Financials (Based on Availability)
- 11.2.2 Steve's PaleoGoods
- 11.2.2.1. Overview
- 11.2.2.2. Products
- 11.2.2.3. SWOT Analysis
- 11.2.2.4. Recent Developments
- 11.2.2.5. Financials (Based on Availability)
- 11.2.3 Primal Food
- 11.2.3.1. Overview
- 11.2.3.2. Products
- 11.2.3.3. SWOT Analysis
- 11.2.3.4. Recent Developments
- 11.2.3.5. Financials (Based on Availability)
- 11.2.4 The Paleo Foods
- 11.2.4.1. Overview
- 11.2.4.2. Products
- 11.2.4.3. SWOT Analysis
- 11.2.4.4. Recent Developments
- 11.2.4.5. Financials (Based on Availability)
- 11.2.5 Modern Food
- 11.2.5.1. Overview
- 11.2.5.2. Products
- 11.2.5.3. SWOT Analysis
- 11.2.5.4. Recent Developments
- 11.2.5.5. Financials (Based on Availability)
- 11.2.6 Paleo Jerky
- 11.2.6.1. Overview
- 11.2.6.2. Products
- 11.2.6.3. SWOT Analysis
- 11.2.6.4. Recent Developments
- 11.2.6.5. Financials (Based on Availability)
- 11.2.7 Caveman Foods
- 11.2.7.1. Overview
- 11.2.7.2. Products
- 11.2.7.3. SWOT Analysis
- 11.2.7.4. Recent Developments
- 11.2.7.5. Financials (Based on Availability)
- 11.2.8 Paleo Passion Foods
- 11.2.8.1. Overview
- 11.2.8.2. Products
- 11.2.8.3. SWOT Analysis
- 11.2.8.4. Recent Developments
- 11.2.8.5. Financials (Based on Availability)
- 11.2.1 Paleo Nordic
List of Figures
- Figure 1: Global Paleo Food Products Revenue Breakdown (undefined, %) by Region 2025 & 2033
- Figure 2: North America Paleo Food Products Revenue (undefined), by Application 2025 & 2033
- Figure 3: North America Paleo Food Products Revenue Share (%), by Application 2025 & 2033
- Figure 4: North America Paleo Food Products Revenue (undefined), by Type 2025 & 2033
- Figure 5: North America Paleo Food Products Revenue Share (%), by Type 2025 & 2033
- Figure 6: North America Paleo Food Products Revenue (undefined), by Country 2025 & 2033
- Figure 7: North America Paleo Food Products Revenue Share (%), by Country 2025 & 2033
- Figure 8: South America Paleo Food Products Revenue (undefined), by Application 2025 & 2033
- Figure 9: South America Paleo Food Products Revenue Share (%), by Application 2025 & 2033
- Figure 10: South America Paleo Food Products Revenue (undefined), by Type 2025 & 2033
- Figure 11: South America Paleo Food Products Revenue Share (%), by Type 2025 & 2033
- Figure 12: South America Paleo Food Products Revenue (undefined), by Country 2025 & 2033
- Figure 13: South America Paleo Food Products Revenue Share (%), by Country 2025 & 2033
- Figure 14: Europe Paleo Food Products Revenue (undefined), by Application 2025 & 2033
- Figure 15: Europe Paleo Food Products Revenue Share (%), by Application 2025 & 2033
- Figure 16: Europe Paleo Food Products Revenue (undefined), by Type 2025 & 2033
- Figure 17: Europe Paleo Food Products Revenue Share (%), by Type 2025 & 2033
- Figure 18: Europe Paleo Food Products Revenue (undefined), by Country 2025 & 2033
- Figure 19: Europe Paleo Food Products Revenue Share (%), by Country 2025 & 2033
- Figure 20: Middle East & Africa Paleo Food Products Revenue (undefined), by Application 2025 & 2033
- Figure 21: Middle East & Africa Paleo Food Products Revenue Share (%), by Application 2025 & 2033
- Figure 22: Middle East & Africa Paleo Food Products Revenue (undefined), by Type 2025 & 2033
- Figure 23: Middle East & Africa Paleo Food Products Revenue Share (%), by Type 2025 & 2033
- Figure 24: Middle East & Africa Paleo Food Products Revenue (undefined), by Country 2025 & 2033
- Figure 25: Middle East & Africa Paleo Food Products Revenue Share (%), by Country 2025 & 2033
- Figure 26: Asia Pacific Paleo Food Products Revenue (undefined), by Application 2025 & 2033
- Figure 27: Asia Pacific Paleo Food Products Revenue Share (%), by Application 2025 & 2033
- Figure 28: Asia Pacific Paleo Food Products Revenue (undefined), by Type 2025 & 2033
- Figure 29: Asia Pacific Paleo Food Products Revenue Share (%), by Type 2025 & 2033
- Figure 30: Asia Pacific Paleo Food Products Revenue (undefined), by Country 2025 & 2033
- Figure 31: Asia Pacific Paleo Food Products Revenue Share (%), by Country 2025 & 2033
List of Tables
- Table 1: Global Paleo Food Products Revenue undefined Forecast, by Application 2020 & 2033
- Table 2: Global Paleo Food Products Revenue undefined Forecast, by Type 2020 & 2033
- Table 3: Global Paleo Food Products Revenue undefined Forecast, by Region 2020 & 2033
- Table 4: Global Paleo Food Products Revenue undefined Forecast, by Application 2020 & 2033
- Table 5: Global Paleo Food Products Revenue undefined Forecast, by Type 2020 & 2033
- Table 6: Global Paleo Food Products Revenue undefined Forecast, by Country 2020 & 2033
- Table 7: United States Paleo Food Products Revenue (undefined) Forecast, by Application 2020 & 2033
- Table 8: Canada Paleo Food Products Revenue (undefined) Forecast, by Application 2020 & 2033
- Table 9: Mexico Paleo Food Products Revenue (undefined) Forecast, by Application 2020 & 2033
- Table 10: Global Paleo Food Products Revenue undefined Forecast, by Application 2020 & 2033
- Table 11: Global Paleo Food Products Revenue undefined Forecast, by Type 2020 & 2033
- Table 12: Global Paleo Food Products Revenue undefined Forecast, by Country 2020 & 2033
- Table 13: Brazil Paleo Food Products Revenue (undefined) Forecast, by Application 2020 & 2033
- Table 14: Argentina Paleo Food Products Revenue (undefined) Forecast, by Application 2020 & 2033
- Table 15: Rest of South America Paleo Food Products Revenue (undefined) Forecast, by Application 2020 & 2033
- Table 16: Global Paleo Food Products Revenue undefined Forecast, by Application 2020 & 2033
- Table 17: Global Paleo Food Products Revenue undefined Forecast, by Type 2020 & 2033
- Table 18: Global Paleo Food Products Revenue undefined Forecast, by Country 2020 & 2033
- Table 19: United Kingdom Paleo Food Products Revenue (undefined) Forecast, by Application 2020 & 2033
- Table 20: Germany Paleo Food Products Revenue (undefined) Forecast, by Application 2020 & 2033
- Table 21: France Paleo Food Products Revenue (undefined) Forecast, by Application 2020 & 2033
- Table 22: Italy Paleo Food Products Revenue (undefined) Forecast, by Application 2020 & 2033
- Table 23: Spain Paleo Food Products Revenue (undefined) Forecast, by Application 2020 & 2033
- Table 24: Russia Paleo Food Products Revenue (undefined) Forecast, by Application 2020 & 2033
- Table 25: Benelux Paleo Food Products Revenue (undefined) Forecast, by Application 2020 & 2033
- Table 26: Nordics Paleo Food Products Revenue (undefined) Forecast, by Application 2020 & 2033
- Table 27: Rest of Europe Paleo Food Products Revenue (undefined) Forecast, by Application 2020 & 2033
- Table 28: Global Paleo Food Products Revenue undefined Forecast, by Application 2020 & 2033
- Table 29: Global Paleo Food Products Revenue undefined Forecast, by Type 2020 & 2033
- Table 30: Global Paleo Food Products Revenue undefined Forecast, by Country 2020 & 2033
- Table 31: Turkey Paleo Food Products Revenue (undefined) Forecast, by Application 2020 & 2033
- Table 32: Israel Paleo Food Products Revenue (undefined) Forecast, by Application 2020 & 2033
- Table 33: GCC Paleo Food Products Revenue (undefined) Forecast, by Application 2020 & 2033
- Table 34: North Africa Paleo Food Products Revenue (undefined) Forecast, by Application 2020 & 2033
- Table 35: South Africa Paleo Food Products Revenue (undefined) Forecast, by Application 2020 & 2033
- Table 36: Rest of Middle East & Africa Paleo Food Products Revenue (undefined) Forecast, by Application 2020 & 2033
- Table 37: Global Paleo Food Products Revenue undefined Forecast, by Application 2020 & 2033
- Table 38: Global Paleo Food Products Revenue undefined Forecast, by Type 2020 & 2033
- Table 39: Global Paleo Food Products Revenue undefined Forecast, by Country 2020 & 2033
- Table 40: China Paleo Food Products Revenue (undefined) Forecast, by Application 2020 & 2033
- Table 41: India Paleo Food Products Revenue (undefined) Forecast, by Application 2020 & 2033
- Table 42: Japan Paleo Food Products Revenue (undefined) Forecast, by Application 2020 & 2033
- Table 43: South Korea Paleo Food Products Revenue (undefined) Forecast, by Application 2020 & 2033
- Table 44: ASEAN Paleo Food Products Revenue (undefined) Forecast, by Application 2020 & 2033
- Table 45: Oceania Paleo Food Products Revenue (undefined) Forecast, by Application 2020 & 2033
- Table 46: Rest of Asia Pacific Paleo Food Products Revenue (undefined) Forecast, by Application 2020 & 2033
Frequently Asked Questions
1. What is the projected Compound Annual Growth Rate (CAGR) of the Paleo Food Products?
The projected CAGR is approximately 11.2%.
2. Which companies are prominent players in the Paleo Food Products?
Key companies in the market include Paleo Nordic, Steve's PaleoGoods, Primal Food, The Paleo Foods, Modern Food, Paleo Jerky, Caveman Foods, Paleo Passion Foods.
3. What are the main segments of the Paleo Food Products?
The market segments include Application, Type.
4. Can you provide details about the market size?
The market size is estimated to be USD XXX N/A as of 2022.
5. What are some drivers contributing to market growth?
N/A
6. What are the notable trends driving market growth?
N/A
7. Are there any restraints impacting market growth?
N/A
8. Can you provide examples of recent developments in the market?
N/A
9. What pricing options are available for accessing the report?
Pricing options include single-user, multi-user, and enterprise licenses priced at USD 2900.00, USD 4350.00, and USD 5800.00 respectively.
10. Is the market size provided in terms of value or volume?
The market size is provided in terms of value, measured in N/A.
11. Are there any specific market keywords associated with the report?
Yes, the market keyword associated with the report is "Paleo Food Products," which aids in identifying and referencing the specific market segment covered.
12. How do I determine which pricing option suits my needs best?
The pricing options vary based on user requirements and access needs. Individual users may opt for single-user licenses, while businesses requiring broader access may choose multi-user or enterprise licenses for cost-effective access to the report.
13. Are there any additional resources or data provided in the Paleo Food Products report?
While the report offers comprehensive insights, it's advisable to review the specific contents or supplementary materials provided to ascertain if additional resources or data are available.
14. How can I stay updated on further developments or reports in the Paleo Food Products?
To stay informed about further developments, trends, and reports in the Paleo Food Products, consider subscribing to industry newsletters, following relevant companies and organizations, or regularly checking reputable industry news sources and publications.
Methodology
Step 1 - Identification of Relevant Samples Size from Population Database


Step 2 - Approaches for Defining Global Market Size (Value, Volume* & Price*)

Note*: In applicable scenarios
Step 3 - Data Sources
Primary Research
- Web Analytics
- Survey Reports
- Research Institute
- Latest Research Reports
- Opinion Leaders
Secondary Research
- Annual Reports
- White Paper
- Latest Press Release
- Industry Association
- Paid Database
- Investor Presentations

Step 4 - Data Triangulation
Involves using different sources of information in order to increase the validity of a study
These sources are likely to be stakeholders in a program - participants, other researchers, program staff, other community members, and so on.
Then we put all data in single framework & apply various statistical tools to find out the dynamic on the market.
During the analysis stage, feedback from the stakeholder groups would be compared to determine areas of agreement as well as areas of divergence