

Key Insights
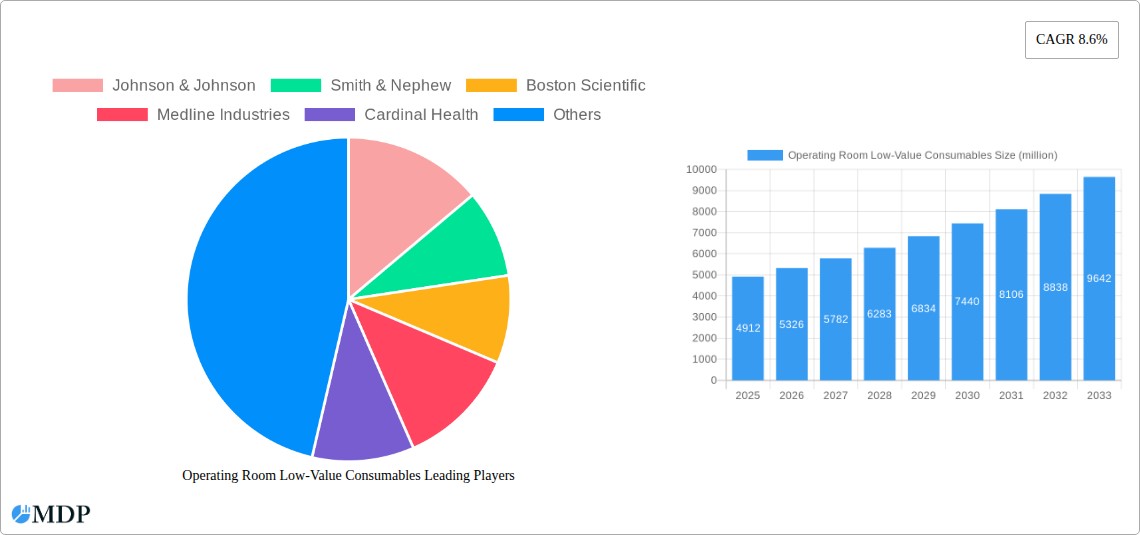
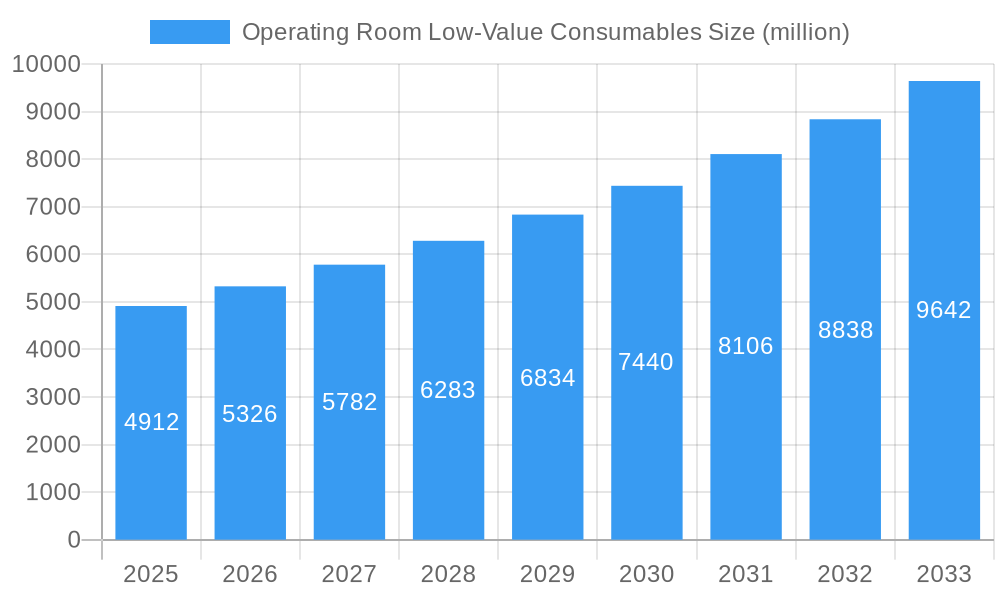
The global market for operating room (OR) low-value consumables is experiencing robust growth, projected to reach a value of approximately $4.912 billion in 2025 and exhibiting a Compound Annual Growth Rate (CAGR) of 8.6% from 2025 to 2033. This expansion is driven by several key factors. Increasing surgical procedures worldwide, fueled by rising prevalence of chronic diseases and an aging global population, significantly contribute to elevated demand. Technological advancements in minimally invasive surgical techniques, which often require a higher volume of low-value consumables, further propel market growth. Furthermore, the increasing adoption of cost-effective disposable consumables, reducing the risk of cross-contamination and enhancing patient safety, contributes significantly to market expansion. The market is segmented by application (hospital and household) and type (gloves, surgical kits, suture and hemostatic consumables, and others). The hospital segment currently dominates, reflecting the high volume of surgical procedures performed in these settings. However, the household segment is expected to show considerable growth driven by increasing home healthcare practices. Key players such as Johnson & Johnson, Smith & Nephew, and Medtronic are actively involved in product innovation and strategic acquisitions to solidify their market position. Geographic expansion into emerging economies, where healthcare infrastructure is developing rapidly, also presents significant opportunities for market growth.
Operating Room Low-Value Consumables Market Size (In Billion)
The market's growth trajectory, while positive, faces some challenges. Supply chain disruptions and fluctuations in raw material prices could impact profitability. Stringent regulatory requirements for medical devices may increase compliance costs. Despite these restraints, the long-term outlook remains optimistic due to the continuing rise in surgical procedures and the ongoing focus on patient safety and efficiency in operating rooms. The market is expected to witness a steady expansion in the coming years, with specific growth rates varying across regions depending on factors like healthcare infrastructure development and economic growth. The competitive landscape remains dynamic, with established players and emerging companies vying for market share through innovation and strategic partnerships.
Operating Room Low-Value Consumables Company Market Share
Operating Room Low-Value Consumables Market Report: 2019-2033
Uncover lucrative growth opportunities in the multi-billion dollar Operating Room Low-Value Consumables market. This comprehensive report provides a detailed analysis of market dynamics, trends, leading players, and future projections from 2019 to 2033. The study period covers 2019-2033, with 2025 as the base and estimated year. The forecast period spans 2025-2033, and the historical period encompasses 2019-2024. This report is crucial for investors, manufacturers, distributors, and healthcare professionals seeking to navigate this dynamic landscape. The market is valued at $XX million in 2025 and is projected to reach $XX million by 2033.
Operating Room Low-Value Consumables Market Dynamics & Concentration
This section analyzes the competitive landscape of the operating room low-value consumables market, examining market concentration, innovation drivers, regulatory frameworks, product substitutes, end-user trends, and mergers and acquisitions (M&A) activities. The market shows a moderately concentrated structure, with the top 10 players accounting for approximately XX% of the global market share in 2025.
- Market Share: Johnson & Johnson holds the largest market share, estimated at XX%, followed by Medline Industries at XX% and 3M at XX%. Other key players like Smith & Nephew, Cardinal Health, and Molnlycke Health Care also hold significant shares.
- Innovation Drivers: The market is driven by innovations in material science, resulting in improved product performance, reduced infection rates, and enhanced patient comfort. Miniaturization and disposability are also key drivers.
- Regulatory Frameworks: Stringent regulatory approvals and quality standards, particularly in developed nations, influence market growth and adoption.
- Product Substitutes: The availability of cheaper, albeit potentially lower-quality, alternatives poses a challenge to market leaders.
- End-User Trends: Growing preference for single-use products to minimize the risk of cross-contamination is a major trend.
- M&A Activities: The number of M&A deals in the sector has increased in recent years, as larger companies seek to expand their product portfolios and geographical reach. A total of XX M&A deals were recorded between 2019 and 2024.
Operating Room Low-Value Consumables Industry Trends & Analysis
This section explores key trends shaping the Operating Room Low-Value Consumables market. The market exhibits a robust CAGR of XX% during the forecast period (2025-2033), driven primarily by rising surgical procedures, increasing healthcare expenditure, and the growing adoption of minimally invasive surgeries. Technological advancements leading to the development of more efficient and cost-effective products are also contributing to market growth. Market penetration is expected to increase from XX% in 2025 to XX% in 2033, particularly in emerging economies. The increasing demand for disposable products, coupled with stringent infection control regulations, is further fueling market expansion. Competitive dynamics are characterized by intense rivalry among established players, as well as the emergence of new entrants offering innovative products.
Leading Markets & Segments in Operating Room Low-Value Consumables
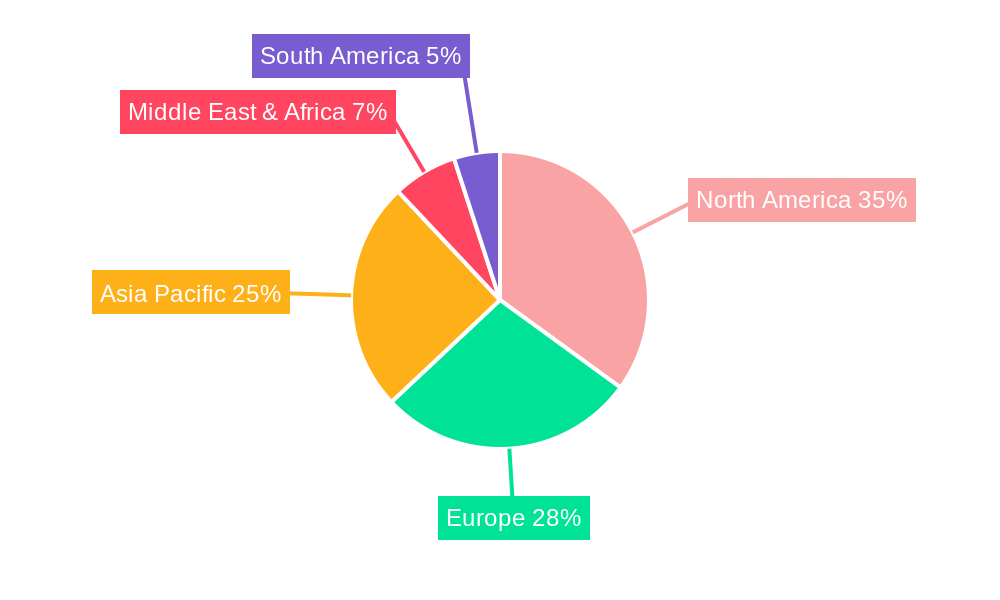
North America currently dominates the global Operating Room Low-Value Consumables market, accounting for approximately XX% of the total market value in 2025. This dominance is primarily attributed to the region's well-developed healthcare infrastructure, high surgical procedure volumes, and substantial spending on healthcare. Europe follows as the second-largest market.
- Key Drivers in North America:
- Robust healthcare infrastructure.
- High healthcare expenditure.
- Strong regulatory support for advanced medical technologies.
- Key Drivers in Europe:
- Growing adoption of minimally invasive surgical techniques.
- Rising prevalence of chronic diseases requiring surgical interventions.
- Favorable government policies promoting healthcare innovation.
Segment Analysis:
- Application: The hospital segment holds the largest share within the application category, accounting for XX% of the market in 2025, driven by the high volume of surgical procedures performed in hospitals.
- Type: Gloves represent the largest segment by type, holding around XX% market share. This is due to the ubiquitous use of gloves in surgical procedures to prevent contamination. Surgical kits follow closely, capturing approximately XX% of the market share.
Operating Room Low-Value Consumables Product Developments
Recent product innovations focus on enhanced biocompatibility, improved barrier protection, and increased comfort for both surgeons and patients. Manufacturers are also concentrating on incorporating antimicrobial properties to reduce the risk of infections. The trend toward single-use, pre-sterilized products continues to drive innovation, while the development of biodegradable and eco-friendly alternatives is gaining traction. These advancements cater to the rising demand for improved efficiency, safety, and sustainability within operating rooms.
Key Drivers of Operating Room Low-Value Consumables Growth
The market's growth is fueled by several key factors:
- Technological Advancements: Innovations in materials science and manufacturing techniques lead to superior product performance and cost reduction.
- Economic Growth: Rising disposable incomes and increasing healthcare spending, especially in emerging economies, drive demand.
- Favorable Regulatory Environment: Supportive regulations concerning the adoption of advanced medical technologies stimulate market growth.
Challenges in the Operating Room Low-Value Consumables Market
Several challenges hinder market growth:
- Stringent Regulatory Hurdles: Meeting stringent regulatory requirements for product approval and quality control can be costly and time-consuming.
- Supply Chain Disruptions: Global supply chain disruptions, particularly those related to raw material sourcing, can impact production and availability.
- Intense Competition: The presence of numerous players, including both established manufacturers and new entrants, intensifies competitive pressures. This leads to price wars and margin compression.
Emerging Opportunities in Operating Room Low-Value Consumables
Significant opportunities exist for market expansion and innovation. The development of smart consumables with integrated monitoring capabilities presents a major avenue for growth. Strategic partnerships between manufacturers and healthcare providers can optimize product distribution and enhance customer relationships. Furthermore, the exploration of new materials and technologies for enhanced biocompatibility and sustainability is a compelling opportunity for industry players.
Leading Players in the Operating Room Low-Value Consumables Sector
- Johnson & Johnson
- Smith & Nephew
- Boston Scientific
- Medline Industries
- Cardinal Health
- Molnlycke
- 3M
- B. Braun
- Terumo
- Coloplast
- Teleflex
- Convatec
- TopGlove
- Hartalega
- Nipro
- Zhende
- Wego
- Kindly
Key Milestones in Operating Room Low-Value Consumables Industry
- 2020: Increased focus on sustainable and eco-friendly consumables.
- 2021: Several key players announced strategic partnerships to expand their market reach.
- 2022: Launch of several innovative products featuring improved biocompatibility and antimicrobial properties.
- 2023: Growing adoption of single-use devices to minimize the risk of cross-contamination.
- 2024: Significant investments in R&D to develop advanced materials and technologies.
Strategic Outlook for Operating Room Low-Value Consumables Market
The future of the Operating Room Low-Value Consumables market is bright, driven by sustained growth in surgical procedures, advancements in medical technology, and a focus on improving patient outcomes and safety. Strategic partnerships, investments in R&D, and expansion into emerging markets will be crucial for players to capitalize on the long-term growth potential. The market is poised for significant expansion in the coming years, offering considerable opportunities for both established players and new entrants.
Operating Room Low-Value Consumables Segmentation
-
1. Application
- 1.1. Hospital
- 1.2. Household
-
2. Types
- 2.1. Gloves
- 2.2. Surgical Kit
- 2.3. Suture and Hemostatic Consumables
- 2.4. Other
Operating Room Low-Value Consumables Segmentation By Geography
-
1. North America
- 1.1. United States
- 1.2. Canada
- 1.3. Mexico
-
2. South America
- 2.1. Brazil
- 2.2. Argentina
- 2.3. Rest of South America
-
3. Europe
- 3.1. United Kingdom
- 3.2. Germany
- 3.3. France
- 3.4. Italy
- 3.5. Spain
- 3.6. Russia
- 3.7. Benelux
- 3.8. Nordics
- 3.9. Rest of Europe
-
4. Middle East & Africa
- 4.1. Turkey
- 4.2. Israel
- 4.3. GCC
- 4.4. North Africa
- 4.5. South Africa
- 4.6. Rest of Middle East & Africa
-
5. Asia Pacific
- 5.1. China
- 5.2. India
- 5.3. Japan
- 5.4. South Korea
- 5.5. ASEAN
- 5.6. Oceania
- 5.7. Rest of Asia Pacific
Operating Room Low-Value Consumables Regional Market Share
Geographic Coverage of Operating Room Low-Value Consumables
Operating Room Low-Value Consumables REPORT HIGHLIGHTS
| Aspects | Details |
|---|---|
| Study Period | 2020-2034 |
| Base Year | 2025 |
| Estimated Year | 2026 |
| Forecast Period | 2026-2034 |
| Historical Period | 2020-2025 |
| Growth Rate | CAGR of 8.6% from 2020-2034 |
| Segmentation |
|
Table of Contents
- 1. Introduction
- 1.1. Research Scope
- 1.2. Market Segmentation
- 1.3. Research Methodology
- 1.4. Definitions and Assumptions
- 2. Executive Summary
- 2.1. Introduction
- 3. Market Dynamics
- 3.1. Introduction
- 3.2. Market Drivers
- 3.3. Market Restrains
- 3.4. Market Trends
- 4. Market Factor Analysis
- 4.1. Porters Five Forces
- 4.2. Supply/Value Chain
- 4.3. PESTEL analysis
- 4.4. Market Entropy
- 4.5. Patent/Trademark Analysis
- 5. Global Operating Room Low-Value Consumables Analysis, Insights and Forecast, 2020-2032
- 5.1. Market Analysis, Insights and Forecast - by Application
- 5.1.1. Hospital
- 5.1.2. Household
- 5.2. Market Analysis, Insights and Forecast - by Types
- 5.2.1. Gloves
- 5.2.2. Surgical Kit
- 5.2.3. Suture and Hemostatic Consumables
- 5.2.4. Other
- 5.3. Market Analysis, Insights and Forecast - by Region
- 5.3.1. North America
- 5.3.2. South America
- 5.3.3. Europe
- 5.3.4. Middle East & Africa
- 5.3.5. Asia Pacific
- 5.1. Market Analysis, Insights and Forecast - by Application
- 6. North America Operating Room Low-Value Consumables Analysis, Insights and Forecast, 2020-2032
- 6.1. Market Analysis, Insights and Forecast - by Application
- 6.1.1. Hospital
- 6.1.2. Household
- 6.2. Market Analysis, Insights and Forecast - by Types
- 6.2.1. Gloves
- 6.2.2. Surgical Kit
- 6.2.3. Suture and Hemostatic Consumables
- 6.2.4. Other
- 6.1. Market Analysis, Insights and Forecast - by Application
- 7. South America Operating Room Low-Value Consumables Analysis, Insights and Forecast, 2020-2032
- 7.1. Market Analysis, Insights and Forecast - by Application
- 7.1.1. Hospital
- 7.1.2. Household
- 7.2. Market Analysis, Insights and Forecast - by Types
- 7.2.1. Gloves
- 7.2.2. Surgical Kit
- 7.2.3. Suture and Hemostatic Consumables
- 7.2.4. Other
- 7.1. Market Analysis, Insights and Forecast - by Application
- 8. Europe Operating Room Low-Value Consumables Analysis, Insights and Forecast, 2020-2032
- 8.1. Market Analysis, Insights and Forecast - by Application
- 8.1.1. Hospital
- 8.1.2. Household
- 8.2. Market Analysis, Insights and Forecast - by Types
- 8.2.1. Gloves
- 8.2.2. Surgical Kit
- 8.2.3. Suture and Hemostatic Consumables
- 8.2.4. Other
- 8.1. Market Analysis, Insights and Forecast - by Application
- 9. Middle East & Africa Operating Room Low-Value Consumables Analysis, Insights and Forecast, 2020-2032
- 9.1. Market Analysis, Insights and Forecast - by Application
- 9.1.1. Hospital
- 9.1.2. Household
- 9.2. Market Analysis, Insights and Forecast - by Types
- 9.2.1. Gloves
- 9.2.2. Surgical Kit
- 9.2.3. Suture and Hemostatic Consumables
- 9.2.4. Other
- 9.1. Market Analysis, Insights and Forecast - by Application
- 10. Asia Pacific Operating Room Low-Value Consumables Analysis, Insights and Forecast, 2020-2032
- 10.1. Market Analysis, Insights and Forecast - by Application
- 10.1.1. Hospital
- 10.1.2. Household
- 10.2. Market Analysis, Insights and Forecast - by Types
- 10.2.1. Gloves
- 10.2.2. Surgical Kit
- 10.2.3. Suture and Hemostatic Consumables
- 10.2.4. Other
- 10.1. Market Analysis, Insights and Forecast - by Application
- 11. Competitive Analysis
- 11.1. Global Market Share Analysis 2025
- 11.2. Company Profiles
- 11.2.1 Johnson & Johnson
- 11.2.1.1. Overview
- 11.2.1.2. Products
- 11.2.1.3. SWOT Analysis
- 11.2.1.4. Recent Developments
- 11.2.1.5. Financials (Based on Availability)
- 11.2.2 Smith & Nephew
- 11.2.2.1. Overview
- 11.2.2.2. Products
- 11.2.2.3. SWOT Analysis
- 11.2.2.4. Recent Developments
- 11.2.2.5. Financials (Based on Availability)
- 11.2.3 Boston Scientific
- 11.2.3.1. Overview
- 11.2.3.2. Products
- 11.2.3.3. SWOT Analysis
- 11.2.3.4. Recent Developments
- 11.2.3.5. Financials (Based on Availability)
- 11.2.4 Medline Industries
- 11.2.4.1. Overview
- 11.2.4.2. Products
- 11.2.4.3. SWOT Analysis
- 11.2.4.4. Recent Developments
- 11.2.4.5. Financials (Based on Availability)
- 11.2.5 Cardinal Health
- 11.2.5.1. Overview
- 11.2.5.2. Products
- 11.2.5.3. SWOT Analysis
- 11.2.5.4. Recent Developments
- 11.2.5.5. Financials (Based on Availability)
- 11.2.6 Molnlycke
- 11.2.6.1. Overview
- 11.2.6.2. Products
- 11.2.6.3. SWOT Analysis
- 11.2.6.4. Recent Developments
- 11.2.6.5. Financials (Based on Availability)
- 11.2.7 3M
- 11.2.7.1. Overview
- 11.2.7.2. Products
- 11.2.7.3. SWOT Analysis
- 11.2.7.4. Recent Developments
- 11.2.7.5. Financials (Based on Availability)
- 11.2.8 B. Braun
- 11.2.8.1. Overview
- 11.2.8.2. Products
- 11.2.8.3. SWOT Analysis
- 11.2.8.4. Recent Developments
- 11.2.8.5. Financials (Based on Availability)
- 11.2.9 Terumo
- 11.2.9.1. Overview
- 11.2.9.2. Products
- 11.2.9.3. SWOT Analysis
- 11.2.9.4. Recent Developments
- 11.2.9.5. Financials (Based on Availability)
- 11.2.10 Coloplast
- 11.2.10.1. Overview
- 11.2.10.2. Products
- 11.2.10.3. SWOT Analysis
- 11.2.10.4. Recent Developments
- 11.2.10.5. Financials (Based on Availability)
- 11.2.11 Teleflex
- 11.2.11.1. Overview
- 11.2.11.2. Products
- 11.2.11.3. SWOT Analysis
- 11.2.11.4. Recent Developments
- 11.2.11.5. Financials (Based on Availability)
- 11.2.12 Convatec
- 11.2.12.1. Overview
- 11.2.12.2. Products
- 11.2.12.3. SWOT Analysis
- 11.2.12.4. Recent Developments
- 11.2.12.5. Financials (Based on Availability)
- 11.2.13 TopGlove
- 11.2.13.1. Overview
- 11.2.13.2. Products
- 11.2.13.3. SWOT Analysis
- 11.2.13.4. Recent Developments
- 11.2.13.5. Financials (Based on Availability)
- 11.2.14 Hartalega
- 11.2.14.1. Overview
- 11.2.14.2. Products
- 11.2.14.3. SWOT Analysis
- 11.2.14.4. Recent Developments
- 11.2.14.5. Financials (Based on Availability)
- 11.2.15 Nipro
- 11.2.15.1. Overview
- 11.2.15.2. Products
- 11.2.15.3. SWOT Analysis
- 11.2.15.4. Recent Developments
- 11.2.15.5. Financials (Based on Availability)
- 11.2.16 Zhende
- 11.2.16.1. Overview
- 11.2.16.2. Products
- 11.2.16.3. SWOT Analysis
- 11.2.16.4. Recent Developments
- 11.2.16.5. Financials (Based on Availability)
- 11.2.17 Wego
- 11.2.17.1. Overview
- 11.2.17.2. Products
- 11.2.17.3. SWOT Analysis
- 11.2.17.4. Recent Developments
- 11.2.17.5. Financials (Based on Availability)
- 11.2.18 Kindly
- 11.2.18.1. Overview
- 11.2.18.2. Products
- 11.2.18.3. SWOT Analysis
- 11.2.18.4. Recent Developments
- 11.2.18.5. Financials (Based on Availability)
- 11.2.1 Johnson & Johnson
List of Figures
- Figure 1: Global Operating Room Low-Value Consumables Revenue Breakdown (million, %) by Region 2025 & 2033
- Figure 2: Global Operating Room Low-Value Consumables Volume Breakdown (K, %) by Region 2025 & 2033
- Figure 3: North America Operating Room Low-Value Consumables Revenue (million), by Application 2025 & 2033
- Figure 4: North America Operating Room Low-Value Consumables Volume (K), by Application 2025 & 2033
- Figure 5: North America Operating Room Low-Value Consumables Revenue Share (%), by Application 2025 & 2033
- Figure 6: North America Operating Room Low-Value Consumables Volume Share (%), by Application 2025 & 2033
- Figure 7: North America Operating Room Low-Value Consumables Revenue (million), by Types 2025 & 2033
- Figure 8: North America Operating Room Low-Value Consumables Volume (K), by Types 2025 & 2033
- Figure 9: North America Operating Room Low-Value Consumables Revenue Share (%), by Types 2025 & 2033
- Figure 10: North America Operating Room Low-Value Consumables Volume Share (%), by Types 2025 & 2033
- Figure 11: North America Operating Room Low-Value Consumables Revenue (million), by Country 2025 & 2033
- Figure 12: North America Operating Room Low-Value Consumables Volume (K), by Country 2025 & 2033
- Figure 13: North America Operating Room Low-Value Consumables Revenue Share (%), by Country 2025 & 2033
- Figure 14: North America Operating Room Low-Value Consumables Volume Share (%), by Country 2025 & 2033
- Figure 15: South America Operating Room Low-Value Consumables Revenue (million), by Application 2025 & 2033
- Figure 16: South America Operating Room Low-Value Consumables Volume (K), by Application 2025 & 2033
- Figure 17: South America Operating Room Low-Value Consumables Revenue Share (%), by Application 2025 & 2033
- Figure 18: South America Operating Room Low-Value Consumables Volume Share (%), by Application 2025 & 2033
- Figure 19: South America Operating Room Low-Value Consumables Revenue (million), by Types 2025 & 2033
- Figure 20: South America Operating Room Low-Value Consumables Volume (K), by Types 2025 & 2033
- Figure 21: South America Operating Room Low-Value Consumables Revenue Share (%), by Types 2025 & 2033
- Figure 22: South America Operating Room Low-Value Consumables Volume Share (%), by Types 2025 & 2033
- Figure 23: South America Operating Room Low-Value Consumables Revenue (million), by Country 2025 & 2033
- Figure 24: South America Operating Room Low-Value Consumables Volume (K), by Country 2025 & 2033
- Figure 25: South America Operating Room Low-Value Consumables Revenue Share (%), by Country 2025 & 2033
- Figure 26: South America Operating Room Low-Value Consumables Volume Share (%), by Country 2025 & 2033
- Figure 27: Europe Operating Room Low-Value Consumables Revenue (million), by Application 2025 & 2033
- Figure 28: Europe Operating Room Low-Value Consumables Volume (K), by Application 2025 & 2033
- Figure 29: Europe Operating Room Low-Value Consumables Revenue Share (%), by Application 2025 & 2033
- Figure 30: Europe Operating Room Low-Value Consumables Volume Share (%), by Application 2025 & 2033
- Figure 31: Europe Operating Room Low-Value Consumables Revenue (million), by Types 2025 & 2033
- Figure 32: Europe Operating Room Low-Value Consumables Volume (K), by Types 2025 & 2033
- Figure 33: Europe Operating Room Low-Value Consumables Revenue Share (%), by Types 2025 & 2033
- Figure 34: Europe Operating Room Low-Value Consumables Volume Share (%), by Types 2025 & 2033
- Figure 35: Europe Operating Room Low-Value Consumables Revenue (million), by Country 2025 & 2033
- Figure 36: Europe Operating Room Low-Value Consumables Volume (K), by Country 2025 & 2033
- Figure 37: Europe Operating Room Low-Value Consumables Revenue Share (%), by Country 2025 & 2033
- Figure 38: Europe Operating Room Low-Value Consumables Volume Share (%), by Country 2025 & 2033
- Figure 39: Middle East & Africa Operating Room Low-Value Consumables Revenue (million), by Application 2025 & 2033
- Figure 40: Middle East & Africa Operating Room Low-Value Consumables Volume (K), by Application 2025 & 2033
- Figure 41: Middle East & Africa Operating Room Low-Value Consumables Revenue Share (%), by Application 2025 & 2033
- Figure 42: Middle East & Africa Operating Room Low-Value Consumables Volume Share (%), by Application 2025 & 2033
- Figure 43: Middle East & Africa Operating Room Low-Value Consumables Revenue (million), by Types 2025 & 2033
- Figure 44: Middle East & Africa Operating Room Low-Value Consumables Volume (K), by Types 2025 & 2033
- Figure 45: Middle East & Africa Operating Room Low-Value Consumables Revenue Share (%), by Types 2025 & 2033
- Figure 46: Middle East & Africa Operating Room Low-Value Consumables Volume Share (%), by Types 2025 & 2033
- Figure 47: Middle East & Africa Operating Room Low-Value Consumables Revenue (million), by Country 2025 & 2033
- Figure 48: Middle East & Africa Operating Room Low-Value Consumables Volume (K), by Country 2025 & 2033
- Figure 49: Middle East & Africa Operating Room Low-Value Consumables Revenue Share (%), by Country 2025 & 2033
- Figure 50: Middle East & Africa Operating Room Low-Value Consumables Volume Share (%), by Country 2025 & 2033
- Figure 51: Asia Pacific Operating Room Low-Value Consumables Revenue (million), by Application 2025 & 2033
- Figure 52: Asia Pacific Operating Room Low-Value Consumables Volume (K), by Application 2025 & 2033
- Figure 53: Asia Pacific Operating Room Low-Value Consumables Revenue Share (%), by Application 2025 & 2033
- Figure 54: Asia Pacific Operating Room Low-Value Consumables Volume Share (%), by Application 2025 & 2033
- Figure 55: Asia Pacific Operating Room Low-Value Consumables Revenue (million), by Types 2025 & 2033
- Figure 56: Asia Pacific Operating Room Low-Value Consumables Volume (K), by Types 2025 & 2033
- Figure 57: Asia Pacific Operating Room Low-Value Consumables Revenue Share (%), by Types 2025 & 2033
- Figure 58: Asia Pacific Operating Room Low-Value Consumables Volume Share (%), by Types 2025 & 2033
- Figure 59: Asia Pacific Operating Room Low-Value Consumables Revenue (million), by Country 2025 & 2033
- Figure 60: Asia Pacific Operating Room Low-Value Consumables Volume (K), by Country 2025 & 2033
- Figure 61: Asia Pacific Operating Room Low-Value Consumables Revenue Share (%), by Country 2025 & 2033
- Figure 62: Asia Pacific Operating Room Low-Value Consumables Volume Share (%), by Country 2025 & 2033
List of Tables
- Table 1: Global Operating Room Low-Value Consumables Revenue million Forecast, by Application 2020 & 2033
- Table 2: Global Operating Room Low-Value Consumables Volume K Forecast, by Application 2020 & 2033
- Table 3: Global Operating Room Low-Value Consumables Revenue million Forecast, by Types 2020 & 2033
- Table 4: Global Operating Room Low-Value Consumables Volume K Forecast, by Types 2020 & 2033
- Table 5: Global Operating Room Low-Value Consumables Revenue million Forecast, by Region 2020 & 2033
- Table 6: Global Operating Room Low-Value Consumables Volume K Forecast, by Region 2020 & 2033
- Table 7: Global Operating Room Low-Value Consumables Revenue million Forecast, by Application 2020 & 2033
- Table 8: Global Operating Room Low-Value Consumables Volume K Forecast, by Application 2020 & 2033
- Table 9: Global Operating Room Low-Value Consumables Revenue million Forecast, by Types 2020 & 2033
- Table 10: Global Operating Room Low-Value Consumables Volume K Forecast, by Types 2020 & 2033
- Table 11: Global Operating Room Low-Value Consumables Revenue million Forecast, by Country 2020 & 2033
- Table 12: Global Operating Room Low-Value Consumables Volume K Forecast, by Country 2020 & 2033
- Table 13: United States Operating Room Low-Value Consumables Revenue (million) Forecast, by Application 2020 & 2033
- Table 14: United States Operating Room Low-Value Consumables Volume (K) Forecast, by Application 2020 & 2033
- Table 15: Canada Operating Room Low-Value Consumables Revenue (million) Forecast, by Application 2020 & 2033
- Table 16: Canada Operating Room Low-Value Consumables Volume (K) Forecast, by Application 2020 & 2033
- Table 17: Mexico Operating Room Low-Value Consumables Revenue (million) Forecast, by Application 2020 & 2033
- Table 18: Mexico Operating Room Low-Value Consumables Volume (K) Forecast, by Application 2020 & 2033
- Table 19: Global Operating Room Low-Value Consumables Revenue million Forecast, by Application 2020 & 2033
- Table 20: Global Operating Room Low-Value Consumables Volume K Forecast, by Application 2020 & 2033
- Table 21: Global Operating Room Low-Value Consumables Revenue million Forecast, by Types 2020 & 2033
- Table 22: Global Operating Room Low-Value Consumables Volume K Forecast, by Types 2020 & 2033
- Table 23: Global Operating Room Low-Value Consumables Revenue million Forecast, by Country 2020 & 2033
- Table 24: Global Operating Room Low-Value Consumables Volume K Forecast, by Country 2020 & 2033
- Table 25: Brazil Operating Room Low-Value Consumables Revenue (million) Forecast, by Application 2020 & 2033
- Table 26: Brazil Operating Room Low-Value Consumables Volume (K) Forecast, by Application 2020 & 2033
- Table 27: Argentina Operating Room Low-Value Consumables Revenue (million) Forecast, by Application 2020 & 2033
- Table 28: Argentina Operating Room Low-Value Consumables Volume (K) Forecast, by Application 2020 & 2033
- Table 29: Rest of South America Operating Room Low-Value Consumables Revenue (million) Forecast, by Application 2020 & 2033
- Table 30: Rest of South America Operating Room Low-Value Consumables Volume (K) Forecast, by Application 2020 & 2033
- Table 31: Global Operating Room Low-Value Consumables Revenue million Forecast, by Application 2020 & 2033
- Table 32: Global Operating Room Low-Value Consumables Volume K Forecast, by Application 2020 & 2033
- Table 33: Global Operating Room Low-Value Consumables Revenue million Forecast, by Types 2020 & 2033
- Table 34: Global Operating Room Low-Value Consumables Volume K Forecast, by Types 2020 & 2033
- Table 35: Global Operating Room Low-Value Consumables Revenue million Forecast, by Country 2020 & 2033
- Table 36: Global Operating Room Low-Value Consumables Volume K Forecast, by Country 2020 & 2033
- Table 37: United Kingdom Operating Room Low-Value Consumables Revenue (million) Forecast, by Application 2020 & 2033
- Table 38: United Kingdom Operating Room Low-Value Consumables Volume (K) Forecast, by Application 2020 & 2033
- Table 39: Germany Operating Room Low-Value Consumables Revenue (million) Forecast, by Application 2020 & 2033
- Table 40: Germany Operating Room Low-Value Consumables Volume (K) Forecast, by Application 2020 & 2033
- Table 41: France Operating Room Low-Value Consumables Revenue (million) Forecast, by Application 2020 & 2033
- Table 42: France Operating Room Low-Value Consumables Volume (K) Forecast, by Application 2020 & 2033
- Table 43: Italy Operating Room Low-Value Consumables Revenue (million) Forecast, by Application 2020 & 2033
- Table 44: Italy Operating Room Low-Value Consumables Volume (K) Forecast, by Application 2020 & 2033
- Table 45: Spain Operating Room Low-Value Consumables Revenue (million) Forecast, by Application 2020 & 2033
- Table 46: Spain Operating Room Low-Value Consumables Volume (K) Forecast, by Application 2020 & 2033
- Table 47: Russia Operating Room Low-Value Consumables Revenue (million) Forecast, by Application 2020 & 2033
- Table 48: Russia Operating Room Low-Value Consumables Volume (K) Forecast, by Application 2020 & 2033
- Table 49: Benelux Operating Room Low-Value Consumables Revenue (million) Forecast, by Application 2020 & 2033
- Table 50: Benelux Operating Room Low-Value Consumables Volume (K) Forecast, by Application 2020 & 2033
- Table 51: Nordics Operating Room Low-Value Consumables Revenue (million) Forecast, by Application 2020 & 2033
- Table 52: Nordics Operating Room Low-Value Consumables Volume (K) Forecast, by Application 2020 & 2033
- Table 53: Rest of Europe Operating Room Low-Value Consumables Revenue (million) Forecast, by Application 2020 & 2033
- Table 54: Rest of Europe Operating Room Low-Value Consumables Volume (K) Forecast, by Application 2020 & 2033
- Table 55: Global Operating Room Low-Value Consumables Revenue million Forecast, by Application 2020 & 2033
- Table 56: Global Operating Room Low-Value Consumables Volume K Forecast, by Application 2020 & 2033
- Table 57: Global Operating Room Low-Value Consumables Revenue million Forecast, by Types 2020 & 2033
- Table 58: Global Operating Room Low-Value Consumables Volume K Forecast, by Types 2020 & 2033
- Table 59: Global Operating Room Low-Value Consumables Revenue million Forecast, by Country 2020 & 2033
- Table 60: Global Operating Room Low-Value Consumables Volume K Forecast, by Country 2020 & 2033
- Table 61: Turkey Operating Room Low-Value Consumables Revenue (million) Forecast, by Application 2020 & 2033
- Table 62: Turkey Operating Room Low-Value Consumables Volume (K) Forecast, by Application 2020 & 2033
- Table 63: Israel Operating Room Low-Value Consumables Revenue (million) Forecast, by Application 2020 & 2033
- Table 64: Israel Operating Room Low-Value Consumables Volume (K) Forecast, by Application 2020 & 2033
- Table 65: GCC Operating Room Low-Value Consumables Revenue (million) Forecast, by Application 2020 & 2033
- Table 66: GCC Operating Room Low-Value Consumables Volume (K) Forecast, by Application 2020 & 2033
- Table 67: North Africa Operating Room Low-Value Consumables Revenue (million) Forecast, by Application 2020 & 2033
- Table 68: North Africa Operating Room Low-Value Consumables Volume (K) Forecast, by Application 2020 & 2033
- Table 69: South Africa Operating Room Low-Value Consumables Revenue (million) Forecast, by Application 2020 & 2033
- Table 70: South Africa Operating Room Low-Value Consumables Volume (K) Forecast, by Application 2020 & 2033
- Table 71: Rest of Middle East & Africa Operating Room Low-Value Consumables Revenue (million) Forecast, by Application 2020 & 2033
- Table 72: Rest of Middle East & Africa Operating Room Low-Value Consumables Volume (K) Forecast, by Application 2020 & 2033
- Table 73: Global Operating Room Low-Value Consumables Revenue million Forecast, by Application 2020 & 2033
- Table 74: Global Operating Room Low-Value Consumables Volume K Forecast, by Application 2020 & 2033
- Table 75: Global Operating Room Low-Value Consumables Revenue million Forecast, by Types 2020 & 2033
- Table 76: Global Operating Room Low-Value Consumables Volume K Forecast, by Types 2020 & 2033
- Table 77: Global Operating Room Low-Value Consumables Revenue million Forecast, by Country 2020 & 2033
- Table 78: Global Operating Room Low-Value Consumables Volume K Forecast, by Country 2020 & 2033
- Table 79: China Operating Room Low-Value Consumables Revenue (million) Forecast, by Application 2020 & 2033
- Table 80: China Operating Room Low-Value Consumables Volume (K) Forecast, by Application 2020 & 2033
- Table 81: India Operating Room Low-Value Consumables Revenue (million) Forecast, by Application 2020 & 2033
- Table 82: India Operating Room Low-Value Consumables Volume (K) Forecast, by Application 2020 & 2033
- Table 83: Japan Operating Room Low-Value Consumables Revenue (million) Forecast, by Application 2020 & 2033
- Table 84: Japan Operating Room Low-Value Consumables Volume (K) Forecast, by Application 2020 & 2033
- Table 85: South Korea Operating Room Low-Value Consumables Revenue (million) Forecast, by Application 2020 & 2033
- Table 86: South Korea Operating Room Low-Value Consumables Volume (K) Forecast, by Application 2020 & 2033
- Table 87: ASEAN Operating Room Low-Value Consumables Revenue (million) Forecast, by Application 2020 & 2033
- Table 88: ASEAN Operating Room Low-Value Consumables Volume (K) Forecast, by Application 2020 & 2033
- Table 89: Oceania Operating Room Low-Value Consumables Revenue (million) Forecast, by Application 2020 & 2033
- Table 90: Oceania Operating Room Low-Value Consumables Volume (K) Forecast, by Application 2020 & 2033
- Table 91: Rest of Asia Pacific Operating Room Low-Value Consumables Revenue (million) Forecast, by Application 2020 & 2033
- Table 92: Rest of Asia Pacific Operating Room Low-Value Consumables Volume (K) Forecast, by Application 2020 & 2033
Frequently Asked Questions
1. What is the projected Compound Annual Growth Rate (CAGR) of the Operating Room Low-Value Consumables?
The projected CAGR is approximately 8.6%.
2. Which companies are prominent players in the Operating Room Low-Value Consumables?
Key companies in the market include Johnson & Johnson, Smith & Nephew, Boston Scientific, Medline Industries, Cardinal Health, Molnlycke, 3M, B. Braun, Terumo, Coloplast, Teleflex, Convatec, TopGlove, Hartalega, Nipro, Zhende, Wego, Kindly.
3. What are the main segments of the Operating Room Low-Value Consumables?
The market segments include Application, Types.
4. Can you provide details about the market size?
The market size is estimated to be USD 4912 million as of 2022.
5. What are some drivers contributing to market growth?
N/A
6. What are the notable trends driving market growth?
N/A
7. Are there any restraints impacting market growth?
N/A
8. Can you provide examples of recent developments in the market?
N/A
9. What pricing options are available for accessing the report?
Pricing options include single-user, multi-user, and enterprise licenses priced at USD 4350.00, USD 6525.00, and USD 8700.00 respectively.
10. Is the market size provided in terms of value or volume?
The market size is provided in terms of value, measured in million and volume, measured in K.
11. Are there any specific market keywords associated with the report?
Yes, the market keyword associated with the report is "Operating Room Low-Value Consumables," which aids in identifying and referencing the specific market segment covered.
12. How do I determine which pricing option suits my needs best?
The pricing options vary based on user requirements and access needs. Individual users may opt for single-user licenses, while businesses requiring broader access may choose multi-user or enterprise licenses for cost-effective access to the report.
13. Are there any additional resources or data provided in the Operating Room Low-Value Consumables report?
While the report offers comprehensive insights, it's advisable to review the specific contents or supplementary materials provided to ascertain if additional resources or data are available.
14. How can I stay updated on further developments or reports in the Operating Room Low-Value Consumables?
To stay informed about further developments, trends, and reports in the Operating Room Low-Value Consumables, consider subscribing to industry newsletters, following relevant companies and organizations, or regularly checking reputable industry news sources and publications.
Methodology
Step 1 - Identification of Relevant Samples Size from Population Database


Step 2 - Approaches for Defining Global Market Size (Value, Volume* & Price*)

Note*: In applicable scenarios
Step 3 - Data Sources
Primary Research
- Web Analytics
- Survey Reports
- Research Institute
- Latest Research Reports
- Opinion Leaders
Secondary Research
- Annual Reports
- White Paper
- Latest Press Release
- Industry Association
- Paid Database
- Investor Presentations

Step 4 - Data Triangulation
Involves using different sources of information in order to increase the validity of a study
These sources are likely to be stakeholders in a program - participants, other researchers, program staff, other community members, and so on.
Then we put all data in single framework & apply various statistical tools to find out the dynamic on the market.
During the analysis stage, feedback from the stakeholder groups would be compared to determine areas of agreement as well as areas of divergence