

Key Insights
The non-dairy fat market is experiencing robust growth, driven by the increasing global adoption of vegan and vegetarian lifestyles, rising health consciousness, and the growing demand for dairy-free alternatives in food and beverage applications. The market's expansion is fueled by the innovative development of plant-based alternatives that closely mimic the texture, taste, and functionality of dairy fats, catering to consumer preferences for healthier and more sustainable food choices. Key players like Cargill, Kerry Group, and ADM are investing heavily in research and development, introducing novel non-dairy fat solutions derived from sources such as coconut, palm, and soy, as well as emerging options like algae and pea protein. This competition is fostering innovation and driving down costs, making non-dairy fats increasingly accessible to a wider consumer base. The market is segmented by product type (e.g., oils, shortenings, butter alternatives), application (e.g., bakery, confectionery, dairy alternatives), and distribution channels (e.g., retail, food service). Regional variations exist, with North America and Europe currently leading the market, followed by Asia-Pacific, which is showing significant growth potential due to rising disposable incomes and changing dietary habits. While challenges remain, including potential fluctuations in raw material prices and consumer perception regarding the sustainability of certain plant-based fats, the long-term outlook for the non-dairy fat market remains highly positive.
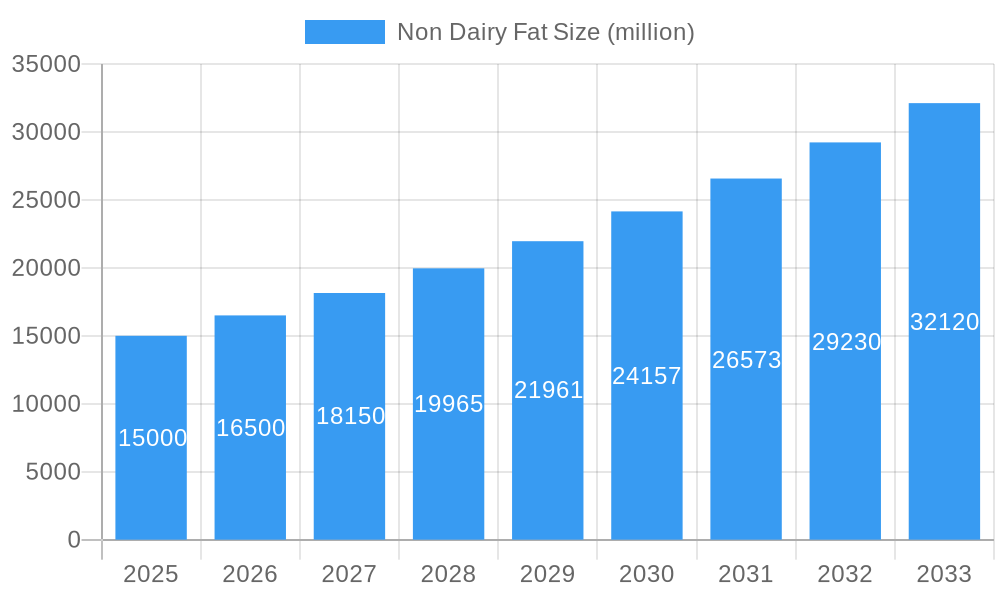
Non Dairy Fat Market Size (In Billion)
The forecast period (2025-2033) projects continued market expansion, driven by sustained demand for plant-based products and ongoing innovation. The industry will likely witness further consolidation as larger companies acquire smaller players, increasing their market share and geographical reach. Sustainable sourcing and ethical production will become increasingly important factors influencing consumer purchasing decisions and shaping the industry's future trajectory. Companies are responding by emphasizing transparency in their supply chains and focusing on eco-friendly production practices to maintain a competitive edge and address growing environmental concerns. Future growth will depend on the continued development of healthier, more versatile, and cost-effective non-dairy fat options that meet the evolving demands of the consumer market. Addressing consumer concerns about ingredient sourcing and the overall health and environmental impact of non-dairy fats will be crucial for sustained success in this dynamic and competitive market.
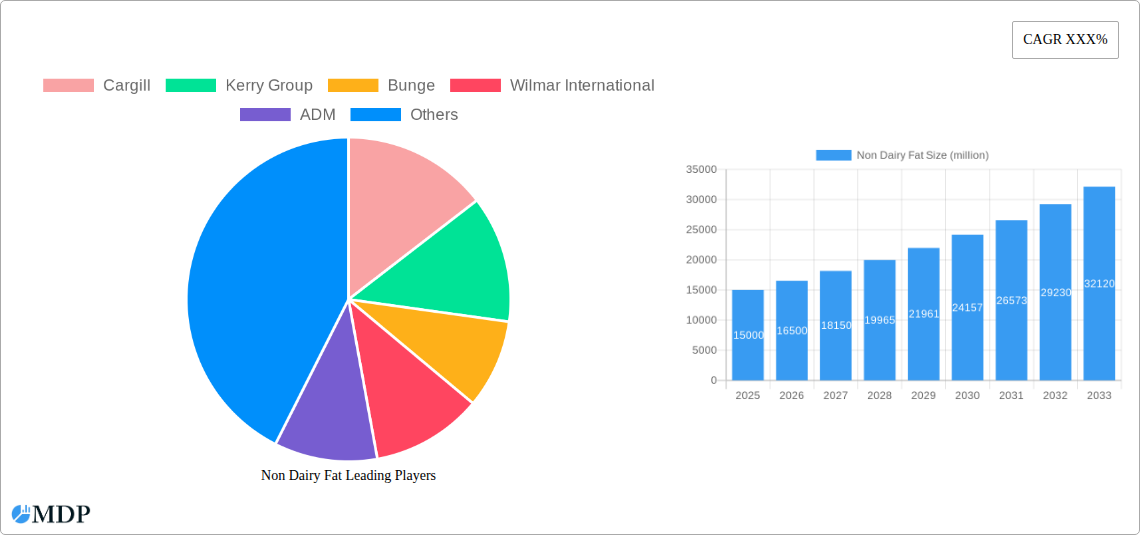
Non Dairy Fat Company Market Share
Non Dairy Fat Market Report: 2019-2033 - A Comprehensive Analysis
This comprehensive report provides an in-depth analysis of the global non-dairy fat market, encompassing market dynamics, industry trends, leading players, and future growth prospects. The study covers the historical period (2019-2024), the base year (2025), and offers detailed forecasts until 2033. The report identifies key growth drivers, challenges, and opportunities, providing valuable insights for industry stakeholders, investors, and businesses operating in this rapidly evolving market. The market is projected to reach xx million by 2033, exhibiting a CAGR of xx% during the forecast period (2025-2033). This report leverages extensive data analysis and expert insights to provide a clear and actionable understanding of this dynamic sector.
Non Dairy Fat Market Dynamics & Concentration
The non-dairy fat market is characterized by a moderately concentrated landscape with several large players holding significant market share. Cargill, Kerry Group, and Bunge, for example, command a combined xx% of the global market in 2025, reflecting their established production capabilities and extensive distribution networks. Market concentration is influenced by factors including economies of scale, brand recognition, and technological advancements.
- Innovation Drivers: The growing demand for plant-based alternatives and increasing health consciousness are driving innovation in non-dairy fat production, including the development of healthier, more sustainable, and functional products.
- Regulatory Frameworks: Government regulations regarding food labeling, ingredients, and sustainability are impacting market dynamics. Compliance costs and evolving regulations pose challenges to some market participants.
- Product Substitutes: Competition from other fat sources, including traditional dairy fats and emerging alternatives, influences market share.
- End-User Trends: The rising popularity of veganism, vegetarianism, and flexitarianism, alongside growing health awareness, is fueling demand for non-dairy fats in various food applications.
- M&A Activities: The market has witnessed xx M&A deals between 2019 and 2024, indicating ongoing consolidation and strategic expansion efforts by major players.
Non Dairy Fat Industry Trends & Analysis
The global non-dairy fat market is experiencing robust growth, driven by a confluence of factors. The market is projected to reach xx million by 2033, indicating significant potential for expansion. This growth is largely attributed to several key factors:
- Shifting Consumer Preferences: Consumers are increasingly adopting plant-based diets, driving demand for non-dairy alternatives across various food categories. The market penetration of non-dairy fats in bakery products and confectionery has significantly increased in recent years.
- Technological Disruptions: Advances in processing technologies are leading to the development of non-dairy fats with improved texture, flavor, and functionality, mirroring and even surpassing the characteristics of traditional dairy fats.
- Market Growth Drivers: Growing demand from food and beverage manufacturers, increasing vegan/vegetarian population, and rising health consciousness are contributing significantly to the market's rapid expansion.
- Competitive Dynamics: The market is witnessing intensified competition amongst both established players and new entrants. Companies are focusing on innovation, differentiation, and value-added products to retain and expand their market share.
Leading Markets & Segments in Non Dairy Fat
The North American market currently holds the largest share of the global non-dairy fat market, driven by several key factors:
- Key Drivers in North America:
- High consumer awareness of health and wellness.
- Strong adoption of plant-based diets.
- Well-established infrastructure for food processing and distribution.
- Favorable regulatory environment supporting food innovation.
The dominance of North America stems from the high per capita consumption of processed foods and a significant number of vegan and vegetarian consumers. Europe and Asia Pacific also represent significant growth opportunities, particularly as consumer preferences shift toward healthier and more sustainable food options.
Non Dairy Fat Product Developments
Recent innovations in non-dairy fats have focused on improving taste, texture, and nutritional profiles. Manufacturers are exploring new sources of fats, such as algae and fungi, alongside enhancing processing techniques to create products that meet consumer demands for natural and functional ingredients. These developments are aimed at expanding the applications of non-dairy fats in various food segments.
Key Drivers of Non Dairy Fat Growth
The non-dairy fat market's growth trajectory is fueled by several key drivers, including:
- Technological advancements: Improved extraction methods, processing techniques, and formulation technologies are enabling the production of non-dairy fats with superior characteristics.
- Economic factors: Rising disposable incomes, particularly in developing economies, contribute to increased spending on processed foods containing non-dairy fats.
- Regulatory support: Government initiatives promoting sustainable agriculture and plant-based food systems create favorable conditions for market growth.
Challenges in the Non Dairy Fat Market
Despite the positive outlook, the non-dairy fat market faces some significant challenges:
- Regulatory hurdles: Varying regulations and standards across different regions can create complexities for manufacturers operating globally.
- Supply chain issues: The availability and cost of raw materials, like plant oils, can impact production costs and profitability.
- Competitive pressures: Intense competition from established players and new entrants necessitates continuous innovation and efficient cost management.
Emerging Opportunities in Non Dairy Fat
The long-term growth potential of the non-dairy fat market is promising. Several factors could significantly accelerate market expansion:
- Technological breakthroughs: Ongoing research and development will likely lead to novel non-dairy fat sources and functionalities, opening new market applications.
- Strategic partnerships: Collaborations between ingredient suppliers, food manufacturers, and technology providers could drive innovation and market penetration.
- Market expansion strategies: Targeting new geographical markets and consumer segments will unlock further growth opportunities.
Leading Players in the Non Dairy Fat Sector
- Cargill
- Kerry Group
- Bunge
- Wilmar International
- ADM
- PURIS Foods
- AAK
- Nutiva
- Miyoko's Creamery
- Earth Balance
- FrieslandCampina Kievit
- Spectrum Organics
- Belvita Food
- Nutpods
Key Milestones in Non Dairy Fat Industry
- 2020: Increased focus on sustainability and traceability within the supply chain.
- 2021: Launch of several new non-dairy fat products with improved functionality and taste profiles.
- 2022: Several mergers and acquisitions consolidating market share among key players.
- 2023: Growing adoption of precision fermentation technologies for non-dairy fat production.
- 2024: Significant investments in research and development to improve the sustainability of non-dairy fat production.
Strategic Outlook for Non Dairy Fat Market
The non-dairy fat market is poised for sustained growth, driven by increasing consumer demand, technological advancements, and favorable regulatory environments. Strategic opportunities lie in developing innovative products with enhanced nutritional value, exploring new markets, and establishing strong supply chains. Companies that prioritize sustainability, innovation, and consumer preferences will be well-positioned to capitalize on the long-term growth potential of this dynamic market.
Non Dairy Fat Segmentation
-
1. Application
- 1.1. Baking
- 1.2. Dressings And Dips
- 1.3. Beverages
- 1.4. Others
-
2. Type
- 2.1. Plant-Based Oil
- 2.2. Shortening
- 2.3. Nut Butter
- 2.4. Seed Oil
- 2.5. Others
Non Dairy Fat Segmentation By Geography
-
1. North America
- 1.1. United States
- 1.2. Canada
- 1.3. Mexico
-
2. South America
- 2.1. Brazil
- 2.2. Argentina
- 2.3. Rest of South America
-
3. Europe
- 3.1. United Kingdom
- 3.2. Germany
- 3.3. France
- 3.4. Italy
- 3.5. Spain
- 3.6. Russia
- 3.7. Benelux
- 3.8. Nordics
- 3.9. Rest of Europe
-
4. Middle East & Africa
- 4.1. Turkey
- 4.2. Israel
- 4.3. GCC
- 4.4. North Africa
- 4.5. South Africa
- 4.6. Rest of Middle East & Africa
-
5. Asia Pacific
- 5.1. China
- 5.2. India
- 5.3. Japan
- 5.4. South Korea
- 5.5. ASEAN
- 5.6. Oceania
- 5.7. Rest of Asia Pacific

Non Dairy Fat Regional Market Share
Geographic Coverage of Non Dairy Fat
Non Dairy Fat REPORT HIGHLIGHTS
| Aspects | Details |
|---|---|
| Study Period | 2020-2034 |
| Base Year | 2025 |
| Estimated Year | 2026 |
| Forecast Period | 2026-2034 |
| Historical Period | 2020-2025 |
| Growth Rate | CAGR of XXX% from 2020-2034 |
| Segmentation |
|
Table of Contents
- 1. Introduction
- 1.1. Research Scope
- 1.2. Market Segmentation
- 1.3. Research Methodology
- 1.4. Definitions and Assumptions
- 2. Executive Summary
- 2.1. Introduction
- 3. Market Dynamics
- 3.1. Introduction
- 3.2. Market Drivers
- 3.3. Market Restrains
- 3.4. Market Trends
- 4. Market Factor Analysis
- 4.1. Porters Five Forces
- 4.2. Supply/Value Chain
- 4.3. PESTEL analysis
- 4.4. Market Entropy
- 4.5. Patent/Trademark Analysis
- 5. Global Non Dairy Fat Analysis, Insights and Forecast, 2020-2032
- 5.1. Market Analysis, Insights and Forecast - by Application
- 5.1.1. Baking
- 5.1.2. Dressings And Dips
- 5.1.3. Beverages
- 5.1.4. Others
- 5.2. Market Analysis, Insights and Forecast - by Type
- 5.2.1. Plant-Based Oil
- 5.2.2. Shortening
- 5.2.3. Nut Butter
- 5.2.4. Seed Oil
- 5.2.5. Others
- 5.3. Market Analysis, Insights and Forecast - by Region
- 5.3.1. North America
- 5.3.2. South America
- 5.3.3. Europe
- 5.3.4. Middle East & Africa
- 5.3.5. Asia Pacific
- 5.1. Market Analysis, Insights and Forecast - by Application
- 6. North America Non Dairy Fat Analysis, Insights and Forecast, 2020-2032
- 6.1. Market Analysis, Insights and Forecast - by Application
- 6.1.1. Baking
- 6.1.2. Dressings And Dips
- 6.1.3. Beverages
- 6.1.4. Others
- 6.2. Market Analysis, Insights and Forecast - by Type
- 6.2.1. Plant-Based Oil
- 6.2.2. Shortening
- 6.2.3. Nut Butter
- 6.2.4. Seed Oil
- 6.2.5. Others
- 6.1. Market Analysis, Insights and Forecast - by Application
- 7. South America Non Dairy Fat Analysis, Insights and Forecast, 2020-2032
- 7.1. Market Analysis, Insights and Forecast - by Application
- 7.1.1. Baking
- 7.1.2. Dressings And Dips
- 7.1.3. Beverages
- 7.1.4. Others
- 7.2. Market Analysis, Insights and Forecast - by Type
- 7.2.1. Plant-Based Oil
- 7.2.2. Shortening
- 7.2.3. Nut Butter
- 7.2.4. Seed Oil
- 7.2.5. Others
- 7.1. Market Analysis, Insights and Forecast - by Application
- 8. Europe Non Dairy Fat Analysis, Insights and Forecast, 2020-2032
- 8.1. Market Analysis, Insights and Forecast - by Application
- 8.1.1. Baking
- 8.1.2. Dressings And Dips
- 8.1.3. Beverages
- 8.1.4. Others
- 8.2. Market Analysis, Insights and Forecast - by Type
- 8.2.1. Plant-Based Oil
- 8.2.2. Shortening
- 8.2.3. Nut Butter
- 8.2.4. Seed Oil
- 8.2.5. Others
- 8.1. Market Analysis, Insights and Forecast - by Application
- 9. Middle East & Africa Non Dairy Fat Analysis, Insights and Forecast, 2020-2032
- 9.1. Market Analysis, Insights and Forecast - by Application
- 9.1.1. Baking
- 9.1.2. Dressings And Dips
- 9.1.3. Beverages
- 9.1.4. Others
- 9.2. Market Analysis, Insights and Forecast - by Type
- 9.2.1. Plant-Based Oil
- 9.2.2. Shortening
- 9.2.3. Nut Butter
- 9.2.4. Seed Oil
- 9.2.5. Others
- 9.1. Market Analysis, Insights and Forecast - by Application
- 10. Asia Pacific Non Dairy Fat Analysis, Insights and Forecast, 2020-2032
- 10.1. Market Analysis, Insights and Forecast - by Application
- 10.1.1. Baking
- 10.1.2. Dressings And Dips
- 10.1.3. Beverages
- 10.1.4. Others
- 10.2. Market Analysis, Insights and Forecast - by Type
- 10.2.1. Plant-Based Oil
- 10.2.2. Shortening
- 10.2.3. Nut Butter
- 10.2.4. Seed Oil
- 10.2.5. Others
- 10.1. Market Analysis, Insights and Forecast - by Application
- 11. Competitive Analysis
- 11.1. Global Market Share Analysis 2025
- 11.2. Company Profiles
- 11.2.1 Cargill
- 11.2.1.1. Overview
- 11.2.1.2. Products
- 11.2.1.3. SWOT Analysis
- 11.2.1.4. Recent Developments
- 11.2.1.5. Financials (Based on Availability)
- 11.2.2 Kerry Group
- 11.2.2.1. Overview
- 11.2.2.2. Products
- 11.2.2.3. SWOT Analysis
- 11.2.2.4. Recent Developments
- 11.2.2.5. Financials (Based on Availability)
- 11.2.3 Bunge
- 11.2.3.1. Overview
- 11.2.3.2. Products
- 11.2.3.3. SWOT Analysis
- 11.2.3.4. Recent Developments
- 11.2.3.5. Financials (Based on Availability)
- 11.2.4 Wilmar International
- 11.2.4.1. Overview
- 11.2.4.2. Products
- 11.2.4.3. SWOT Analysis
- 11.2.4.4. Recent Developments
- 11.2.4.5. Financials (Based on Availability)
- 11.2.5 ADM
- 11.2.5.1. Overview
- 11.2.5.2. Products
- 11.2.5.3. SWOT Analysis
- 11.2.5.4. Recent Developments
- 11.2.5.5. Financials (Based on Availability)
- 11.2.6 PURIS Foods
- 11.2.6.1. Overview
- 11.2.6.2. Products
- 11.2.6.3. SWOT Analysis
- 11.2.6.4. Recent Developments
- 11.2.6.5. Financials (Based on Availability)
- 11.2.7 AAK
- 11.2.7.1. Overview
- 11.2.7.2. Products
- 11.2.7.3. SWOT Analysis
- 11.2.7.4. Recent Developments
- 11.2.7.5. Financials (Based on Availability)
- 11.2.8 Nutiva
- 11.2.8.1. Overview
- 11.2.8.2. Products
- 11.2.8.3. SWOT Analysis
- 11.2.8.4. Recent Developments
- 11.2.8.5. Financials (Based on Availability)
- 11.2.9 Miyoko's Creamery
- 11.2.9.1. Overview
- 11.2.9.2. Products
- 11.2.9.3. SWOT Analysis
- 11.2.9.4. Recent Developments
- 11.2.9.5. Financials (Based on Availability)
- 11.2.10 Earth Balance
- 11.2.10.1. Overview
- 11.2.10.2. Products
- 11.2.10.3. SWOT Analysis
- 11.2.10.4. Recent Developments
- 11.2.10.5. Financials (Based on Availability)
- 11.2.11 FrieslandCampina Kievit
- 11.2.11.1. Overview
- 11.2.11.2. Products
- 11.2.11.3. SWOT Analysis
- 11.2.11.4. Recent Developments
- 11.2.11.5. Financials (Based on Availability)
- 11.2.12 Spectrum Organics
- 11.2.12.1. Overview
- 11.2.12.2. Products
- 11.2.12.3. SWOT Analysis
- 11.2.12.4. Recent Developments
- 11.2.12.5. Financials (Based on Availability)
- 11.2.13 Belvita Food
- 11.2.13.1. Overview
- 11.2.13.2. Products
- 11.2.13.3. SWOT Analysis
- 11.2.13.4. Recent Developments
- 11.2.13.5. Financials (Based on Availability)
- 11.2.14 Nutpods
- 11.2.14.1. Overview
- 11.2.14.2. Products
- 11.2.14.3. SWOT Analysis
- 11.2.14.4. Recent Developments
- 11.2.14.5. Financials (Based on Availability)
- 11.2.1 Cargill
List of Figures
- Figure 1: Global Non Dairy Fat Revenue Breakdown (million, %) by Region 2025 & 2033
- Figure 2: North America Non Dairy Fat Revenue (million), by Application 2025 & 2033
- Figure 3: North America Non Dairy Fat Revenue Share (%), by Application 2025 & 2033
- Figure 4: North America Non Dairy Fat Revenue (million), by Type 2025 & 2033
- Figure 5: North America Non Dairy Fat Revenue Share (%), by Type 2025 & 2033
- Figure 6: North America Non Dairy Fat Revenue (million), by Country 2025 & 2033
- Figure 7: North America Non Dairy Fat Revenue Share (%), by Country 2025 & 2033
- Figure 8: South America Non Dairy Fat Revenue (million), by Application 2025 & 2033
- Figure 9: South America Non Dairy Fat Revenue Share (%), by Application 2025 & 2033
- Figure 10: South America Non Dairy Fat Revenue (million), by Type 2025 & 2033
- Figure 11: South America Non Dairy Fat Revenue Share (%), by Type 2025 & 2033
- Figure 12: South America Non Dairy Fat Revenue (million), by Country 2025 & 2033
- Figure 13: South America Non Dairy Fat Revenue Share (%), by Country 2025 & 2033
- Figure 14: Europe Non Dairy Fat Revenue (million), by Application 2025 & 2033
- Figure 15: Europe Non Dairy Fat Revenue Share (%), by Application 2025 & 2033
- Figure 16: Europe Non Dairy Fat Revenue (million), by Type 2025 & 2033
- Figure 17: Europe Non Dairy Fat Revenue Share (%), by Type 2025 & 2033
- Figure 18: Europe Non Dairy Fat Revenue (million), by Country 2025 & 2033
- Figure 19: Europe Non Dairy Fat Revenue Share (%), by Country 2025 & 2033
- Figure 20: Middle East & Africa Non Dairy Fat Revenue (million), by Application 2025 & 2033
- Figure 21: Middle East & Africa Non Dairy Fat Revenue Share (%), by Application 2025 & 2033
- Figure 22: Middle East & Africa Non Dairy Fat Revenue (million), by Type 2025 & 2033
- Figure 23: Middle East & Africa Non Dairy Fat Revenue Share (%), by Type 2025 & 2033
- Figure 24: Middle East & Africa Non Dairy Fat Revenue (million), by Country 2025 & 2033
- Figure 25: Middle East & Africa Non Dairy Fat Revenue Share (%), by Country 2025 & 2033
- Figure 26: Asia Pacific Non Dairy Fat Revenue (million), by Application 2025 & 2033
- Figure 27: Asia Pacific Non Dairy Fat Revenue Share (%), by Application 2025 & 2033
- Figure 28: Asia Pacific Non Dairy Fat Revenue (million), by Type 2025 & 2033
- Figure 29: Asia Pacific Non Dairy Fat Revenue Share (%), by Type 2025 & 2033
- Figure 30: Asia Pacific Non Dairy Fat Revenue (million), by Country 2025 & 2033
- Figure 31: Asia Pacific Non Dairy Fat Revenue Share (%), by Country 2025 & 2033
List of Tables
- Table 1: Global Non Dairy Fat Revenue million Forecast, by Application 2020 & 2033
- Table 2: Global Non Dairy Fat Revenue million Forecast, by Type 2020 & 2033
- Table 3: Global Non Dairy Fat Revenue million Forecast, by Region 2020 & 2033
- Table 4: Global Non Dairy Fat Revenue million Forecast, by Application 2020 & 2033
- Table 5: Global Non Dairy Fat Revenue million Forecast, by Type 2020 & 2033
- Table 6: Global Non Dairy Fat Revenue million Forecast, by Country 2020 & 2033
- Table 7: United States Non Dairy Fat Revenue (million) Forecast, by Application 2020 & 2033
- Table 8: Canada Non Dairy Fat Revenue (million) Forecast, by Application 2020 & 2033
- Table 9: Mexico Non Dairy Fat Revenue (million) Forecast, by Application 2020 & 2033
- Table 10: Global Non Dairy Fat Revenue million Forecast, by Application 2020 & 2033
- Table 11: Global Non Dairy Fat Revenue million Forecast, by Type 2020 & 2033
- Table 12: Global Non Dairy Fat Revenue million Forecast, by Country 2020 & 2033
- Table 13: Brazil Non Dairy Fat Revenue (million) Forecast, by Application 2020 & 2033
- Table 14: Argentina Non Dairy Fat Revenue (million) Forecast, by Application 2020 & 2033
- Table 15: Rest of South America Non Dairy Fat Revenue (million) Forecast, by Application 2020 & 2033
- Table 16: Global Non Dairy Fat Revenue million Forecast, by Application 2020 & 2033
- Table 17: Global Non Dairy Fat Revenue million Forecast, by Type 2020 & 2033
- Table 18: Global Non Dairy Fat Revenue million Forecast, by Country 2020 & 2033
- Table 19: United Kingdom Non Dairy Fat Revenue (million) Forecast, by Application 2020 & 2033
- Table 20: Germany Non Dairy Fat Revenue (million) Forecast, by Application 2020 & 2033
- Table 21: France Non Dairy Fat Revenue (million) Forecast, by Application 2020 & 2033
- Table 22: Italy Non Dairy Fat Revenue (million) Forecast, by Application 2020 & 2033
- Table 23: Spain Non Dairy Fat Revenue (million) Forecast, by Application 2020 & 2033
- Table 24: Russia Non Dairy Fat Revenue (million) Forecast, by Application 2020 & 2033
- Table 25: Benelux Non Dairy Fat Revenue (million) Forecast, by Application 2020 & 2033
- Table 26: Nordics Non Dairy Fat Revenue (million) Forecast, by Application 2020 & 2033
- Table 27: Rest of Europe Non Dairy Fat Revenue (million) Forecast, by Application 2020 & 2033
- Table 28: Global Non Dairy Fat Revenue million Forecast, by Application 2020 & 2033
- Table 29: Global Non Dairy Fat Revenue million Forecast, by Type 2020 & 2033
- Table 30: Global Non Dairy Fat Revenue million Forecast, by Country 2020 & 2033
- Table 31: Turkey Non Dairy Fat Revenue (million) Forecast, by Application 2020 & 2033
- Table 32: Israel Non Dairy Fat Revenue (million) Forecast, by Application 2020 & 2033
- Table 33: GCC Non Dairy Fat Revenue (million) Forecast, by Application 2020 & 2033
- Table 34: North Africa Non Dairy Fat Revenue (million) Forecast, by Application 2020 & 2033
- Table 35: South Africa Non Dairy Fat Revenue (million) Forecast, by Application 2020 & 2033
- Table 36: Rest of Middle East & Africa Non Dairy Fat Revenue (million) Forecast, by Application 2020 & 2033
- Table 37: Global Non Dairy Fat Revenue million Forecast, by Application 2020 & 2033
- Table 38: Global Non Dairy Fat Revenue million Forecast, by Type 2020 & 2033
- Table 39: Global Non Dairy Fat Revenue million Forecast, by Country 2020 & 2033
- Table 40: China Non Dairy Fat Revenue (million) Forecast, by Application 2020 & 2033
- Table 41: India Non Dairy Fat Revenue (million) Forecast, by Application 2020 & 2033
- Table 42: Japan Non Dairy Fat Revenue (million) Forecast, by Application 2020 & 2033
- Table 43: South Korea Non Dairy Fat Revenue (million) Forecast, by Application 2020 & 2033
- Table 44: ASEAN Non Dairy Fat Revenue (million) Forecast, by Application 2020 & 2033
- Table 45: Oceania Non Dairy Fat Revenue (million) Forecast, by Application 2020 & 2033
- Table 46: Rest of Asia Pacific Non Dairy Fat Revenue (million) Forecast, by Application 2020 & 2033
Frequently Asked Questions
1. What is the projected Compound Annual Growth Rate (CAGR) of the Non Dairy Fat?
The projected CAGR is approximately XXX%.
2. Which companies are prominent players in the Non Dairy Fat?
Key companies in the market include Cargill, Kerry Group, Bunge, Wilmar International, ADM, PURIS Foods, AAK, Nutiva, Miyoko's Creamery, Earth Balance, FrieslandCampina Kievit, Spectrum Organics, Belvita Food, Nutpods.
3. What are the main segments of the Non Dairy Fat?
The market segments include Application, Type.
4. Can you provide details about the market size?
The market size is estimated to be USD XXX million as of 2022.
5. What are some drivers contributing to market growth?
N/A
6. What are the notable trends driving market growth?
N/A
7. Are there any restraints impacting market growth?
N/A
8. Can you provide examples of recent developments in the market?
N/A
9. What pricing options are available for accessing the report?
Pricing options include single-user, multi-user, and enterprise licenses priced at USD 2900.00, USD 4350.00, and USD 5800.00 respectively.
10. Is the market size provided in terms of value or volume?
The market size is provided in terms of value, measured in million.
11. Are there any specific market keywords associated with the report?
Yes, the market keyword associated with the report is "Non Dairy Fat," which aids in identifying and referencing the specific market segment covered.
12. How do I determine which pricing option suits my needs best?
The pricing options vary based on user requirements and access needs. Individual users may opt for single-user licenses, while businesses requiring broader access may choose multi-user or enterprise licenses for cost-effective access to the report.
13. Are there any additional resources or data provided in the Non Dairy Fat report?
While the report offers comprehensive insights, it's advisable to review the specific contents or supplementary materials provided to ascertain if additional resources or data are available.
14. How can I stay updated on further developments or reports in the Non Dairy Fat?
To stay informed about further developments, trends, and reports in the Non Dairy Fat, consider subscribing to industry newsletters, following relevant companies and organizations, or regularly checking reputable industry news sources and publications.
Methodology
Step 1 - Identification of Relevant Samples Size from Population Database


Step 2 - Approaches for Defining Global Market Size (Value, Volume* & Price*)

Note*: In applicable scenarios
Step 3 - Data Sources
Primary Research
- Web Analytics
- Survey Reports
- Research Institute
- Latest Research Reports
- Opinion Leaders
Secondary Research
- Annual Reports
- White Paper
- Latest Press Release
- Industry Association
- Paid Database
- Investor Presentations

Step 4 - Data Triangulation
Involves using different sources of information in order to increase the validity of a study
These sources are likely to be stakeholders in a program - participants, other researchers, program staff, other community members, and so on.
Then we put all data in single framework & apply various statistical tools to find out the dynamic on the market.
During the analysis stage, feedback from the stakeholder groups would be compared to determine areas of agreement as well as areas of divergence