

Key Insights
The natural peanut butter market is poised for significant expansion, driven by a growing consumer preference for healthier, minimally processed food options and an increasing awareness of the nutritional benefits of peanuts. The market is projected to reach USD 8.51 billion in 2025, demonstrating a robust compound annual growth rate (CAGR) of 6.88% through 2033. This upward trajectory is further fueled by the rising popularity of plant-based diets, where peanut butter serves as a versatile and protein-rich staple. The demand for natural peanut butter is especially pronounced among health-conscious millennials and Gen Z consumers who actively seek products with fewer artificial ingredients and preservatives. Innovations in product formulations, such as the introduction of flavored natural peanut butters and those with added functional ingredients like chia seeds or flaxseeds, are also contributing to market vitality. Furthermore, the expansion of distribution channels, including direct-to-consumer online sales and specialty health food stores, is making natural peanut butter more accessible to a wider audience.
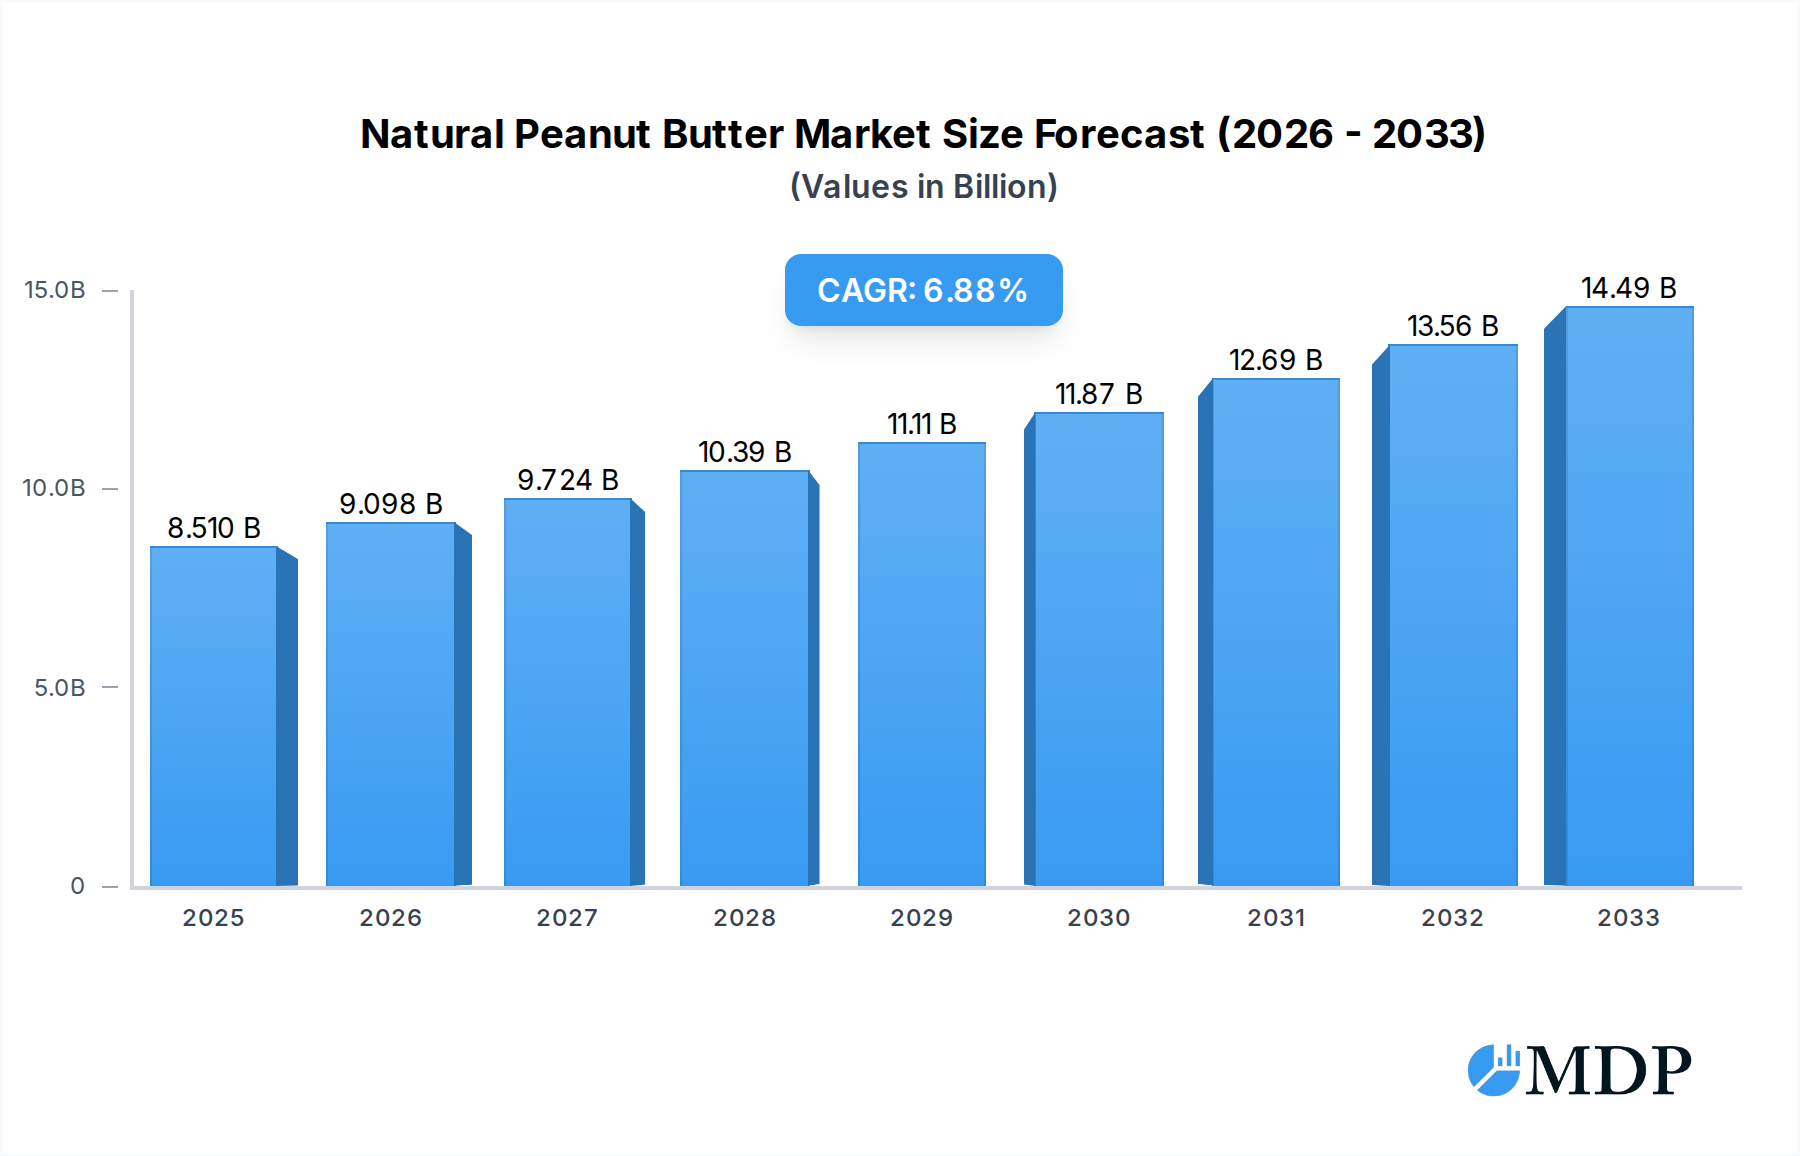
Natural Peanut Butter Market Size (In Billion)
While the market enjoys strong growth, certain factors could present challenges. The availability and pricing of raw materials, particularly peanuts, can be subject to agricultural fluctuations and geopolitical events, potentially impacting profit margins. Additionally, the competitive landscape is intense, with established brands and numerous smaller artisanal producers vying for market share. However, the overall outlook remains highly positive. The increasing focus on clean labels, ethical sourcing, and sustainable production practices will likely benefit manufacturers who prioritize these aspects. Key market segments, such as online sales, are expected to see accelerated growth as e-commerce platforms become more sophisticated and consumers prioritize convenience. Geographically, North America and Europe are anticipated to continue leading the market due to established health and wellness trends, while the Asia Pacific region presents a significant untapped growth opportunity as its economies develop and consumer awareness of healthy eating practices increases.

Natural Peanut Butter Company Market Share
Natural Peanut Butter Market Dynamics & Concentration
The natural peanut butter market is characterized by a moderate to high concentration, with a few dominant players holding significant market share, estimated to be in the range of 70-80 billion dollars by the end of the forecast period. Key innovation drivers include the growing consumer demand for clean label products, increased awareness of the health benefits of peanuts, and advancements in processing technologies that enhance shelf-life and texture without artificial additives. Regulatory frameworks, primarily focused on food safety and labeling standards (e.g., FDA guidelines for "natural" claims), play a crucial role in shaping product development and market entry. Product substitutes, such as almond butter, cashew butter, and other nut and seed butters, present a consistent competitive pressure, with an estimated market share of 15-20 billion dollars for these alternatives. End-user trends reveal a strong preference for organic, non-GMO, and single-ingredient peanut butters, driving product diversification. Mergers and acquisitions (M&A) activity, while not consistently high, is present, with an estimated 5-10 significant M&A deals valued at over 1 billion dollars each occurring throughout the study period, primarily aimed at expanding product portfolios and market reach.
- Key Innovation Drivers:
- Demand for clean label and natural ingredients.
- Health and wellness trends favoring plant-based protein sources.
- Technological advancements in processing and formulation.
- Dominant Companies: Skippy, Jif, Smucker's collectively hold an estimated market share of 40-50 billion dollars.
- M&A Activity: Anticipated 5-10 major acquisitions, each valued at over 1 billion dollars, by 2033.
Natural Peanut Butter Industry Trends & Analysis
The natural peanut butter industry is poised for robust growth, driven by evolving consumer preferences and increasing health consciousness. The market is projected to expand at a Compound Annual Growth Rate (CAGR) of approximately 5-7% over the forecast period (2025–2033), reaching a market size estimated to be in the range of 90-110 billion dollars by 2033. This expansion is fueled by a rising global demand for plant-based protein sources, with natural peanut butter emerging as a convenient and affordable option. Online sales channels are witnessing a significant surge, contributing an estimated 30-40% to the overall market revenue, as consumers increasingly opt for the convenience of e-commerce. Technological disruptions are primarily focused on improving the texture, spreadability, and shelf-stability of natural peanut butter without compromising its "natural" claim. This includes innovations in milling techniques, ingredient stabilization, and advanced packaging solutions. Consumer preferences are shifting towards unsweetened and unsalted varieties, as well as those featuring minimal ingredient lists, prioritizing health and transparency. The competitive landscape is dynamic, with established brands and emerging niche players vying for market share. Key market penetration is estimated to reach 60-70% in developed economies by the end of the forecast period. The increasing prevalence of lifestyle diseases and a greater emphasis on preventative healthcare further contribute to the growing popularity of natural peanut butter as a staple in healthy diets. Furthermore, the versatility of natural peanut butter, extending beyond simple spreads to include its use in baking, smoothies, and savory dishes, contributes significantly to its market penetration and sustained demand across various consumer demographics.
Leading Markets & Segments in Natural Peanut Butter
The Online Sales segment is emerging as a dominant force in the natural peanut butter market, projected to account for an estimated 35-45% of the total market revenue by 2033. This dominance is driven by the convenience offered by e-commerce platforms, which cater to the busy lifestyles of modern consumers. The ease of online purchasing, coupled with wider product availability and competitive pricing, makes online channels particularly attractive for accessing specialty natural peanut butter brands. Another key segment experiencing significant growth is Sweet Peanut Butter, capturing an estimated 30-40% of the market share, largely due to its widespread appeal across age groups, particularly among children. This preference is supported by ongoing product innovations that offer healthier sweetening options, such as natural fruit extracts or minimal use of unrefined sugars.
- Dominant Application: Online Sales
- Key Drivers:
- Growing e-commerce penetration and digital adoption.
- Convenience and accessibility for consumers.
- Wider product selection and competitive pricing on online platforms.
- Direct-to-consumer (DTC) models adopted by niche brands.
- Key Drivers:
- Dominant Type: Sweet Peanut Butter
- Key Drivers:
- Broad consumer appeal, especially among families.
- Ongoing product innovation in healthier sweetening alternatives.
- Versatility in culinary applications, from breakfast to snacks.
- Key Drivers:
The Offline Sales segment, while currently holding a larger share, is expected to see a more moderate growth rate, estimated at 25-35% by 2033. This segment's strength lies in traditional retail channels like supermarkets and hypermarkets, providing consumers with immediate availability and the ability to physically inspect products. However, the rising popularity of online shopping is gradually shifting market share. Among the types of natural peanut butter, Salted Peanut Butter is anticipated to maintain a substantial market presence, estimated at 30-40%, owing to its long-standing popularity and its ability to enhance the flavor profile of dishes.
Natural Peanut Butter Product Developments
Recent product developments in the natural peanut butter sector are heavily focused on enhancing consumer appeal through healthier formulations and innovative flavors. Companies are increasingly prioritizing the use of organic, non-GMO peanuts with minimal processing, leading to a surge in single-ingredient peanut butters and those with natural sweeteners like honey or dates. Technological advancements are enabling improved texture and spreadability without the use of emulsifiers, a key differentiator for the natural peanut butter market. Furthermore, the introduction of flavored varieties, such as chocolate or cinnamon, combined with the inclusion of functional ingredients like chia seeds or flaxseeds, is broadening the appeal and creating unique competitive advantages.
Key Drivers of Natural Peanut Butter Growth
The natural peanut butter market's growth is primarily propelled by several key factors. Rising health consciousness among consumers, coupled with the increasing demand for plant-based protein sources, is a significant driver. The perception of natural peanut butter as a wholesome and nutrient-rich food item, offering healthy fats and essential vitamins, further fuels its consumption. Technological advancements in processing and formulation are enabling the development of cleaner label products with improved taste and texture, meeting consumer expectations for natural ingredients. Supportive regulatory frameworks that promote clear labeling of natural ingredients and nutritional information also contribute to market growth by building consumer trust and facilitating informed purchasing decisions. The expanding accessibility through online sales channels and strategic partnerships with health and wellness influencers are also instrumental in driving market expansion.
Challenges in the Natural Peanut Butter Market
Despite its promising growth trajectory, the natural peanut butter market faces several challenges. Supply chain volatility for raw peanuts, influenced by weather patterns and agricultural yields, can lead to price fluctuations and potential shortages. Stringent regulatory hurdles related to labeling claims, particularly for "natural" and "organic" certifications, can pose barriers to entry for smaller manufacturers and require significant compliance efforts. The competitive pressure from substitute products like almond butter, cashew butter, and other plant-based spreads, which are often perceived as premium alternatives, presents a continuous challenge. Furthermore, maintaining consistent quality and texture in natural peanut butter, which is prone to oil separation and a shorter shelf-life compared to conventional varieties, requires ongoing innovation and careful formulation.
Emerging Opportunities in Natural Peanut Butter
Emerging opportunities in the natural peanut butter market are centered on product innovation, market expansion, and strategic collaborations. The growing demand for functional foods presents an opportunity for natural peanut butter fortified with probiotics, vitamins, or minerals, catering to specific health needs. Expanding into emerging economies with growing disposable incomes and increasing awareness of health and wellness trends offers significant untapped market potential. Strategic partnerships between natural peanut butter manufacturers and food service providers, such as cafes and bakeries, can introduce the product to new consumer bases. Furthermore, advancements in sustainable sourcing and packaging initiatives can resonate with environmentally conscious consumers, creating a unique selling proposition and fostering brand loyalty.
Leading Players in the Natural Peanut Butter Sector
- Skippy
- Peanut Butter & Co.
- Saratoga Peanut Butter Company
- Once Again Nut Butter
- Crazy Richard's
- Adams
- Laura Scudder’s
- Natural Way Food Group
- MaraNatha Nut Butters
- Smucker's
- Jif
- American Dream Nut Butter
Key Milestones in Natural Peanut Butter Industry
- 2019: Increased consumer demand for plant-based diets and "clean label" products accelerates the growth of the natural peanut butter segment.
- 2020: Rise in e-commerce penetration leads to significant growth in online sales of natural peanut butter.
- 2021: Innovations in processing technology allow for improved texture and reduced oil separation in natural peanut butter.
- 2022: Growing consumer awareness regarding the health benefits of peanuts fuels product innovation in unsweetened and unsalted varieties.
- 2023: Several established brands launch their dedicated natural peanut butter lines to capture growing market share.
- 2024: Increased focus on sustainable sourcing and eco-friendly packaging begins to influence product development strategies.
Strategic Outlook for Natural Peanut Butter Market
The strategic outlook for the natural peanut butter market is exceptionally bright, driven by an increasing consumer preference for healthy, plant-based, and minimally processed foods. The market is expected to witness sustained growth, propelled by ongoing product innovations that cater to diverse taste preferences and dietary needs. Expansion into untapped geographical regions and a stronger focus on direct-to-consumer sales channels will be key growth accelerators. Strategic partnerships with health and wellness influencers and the integration of functional ingredients will further enhance market penetration. Companies that prioritize transparency in sourcing, product development, and marketing will likely gain a competitive edge and capture a significant share of the expanding global natural peanut butter market.
Natural Peanut Butter Segmentation
-
1. Application
- 1.1. Online Sales
- 1.2. Offline Sales
-
2. Types
- 2.1. Salted Peanut Butter
- 2.2. Sweet Peanut Butter
Natural Peanut Butter Segmentation By Geography
-
1. North America
- 1.1. United States
- 1.2. Canada
- 1.3. Mexico
-
2. South America
- 2.1. Brazil
- 2.2. Argentina
- 2.3. Rest of South America
-
3. Europe
- 3.1. United Kingdom
- 3.2. Germany
- 3.3. France
- 3.4. Italy
- 3.5. Spain
- 3.6. Russia
- 3.7. Benelux
- 3.8. Nordics
- 3.9. Rest of Europe
-
4. Middle East & Africa
- 4.1. Turkey
- 4.2. Israel
- 4.3. GCC
- 4.4. North Africa
- 4.5. South Africa
- 4.6. Rest of Middle East & Africa
-
5. Asia Pacific
- 5.1. China
- 5.2. India
- 5.3. Japan
- 5.4. South Korea
- 5.5. ASEAN
- 5.6. Oceania
- 5.7. Rest of Asia Pacific
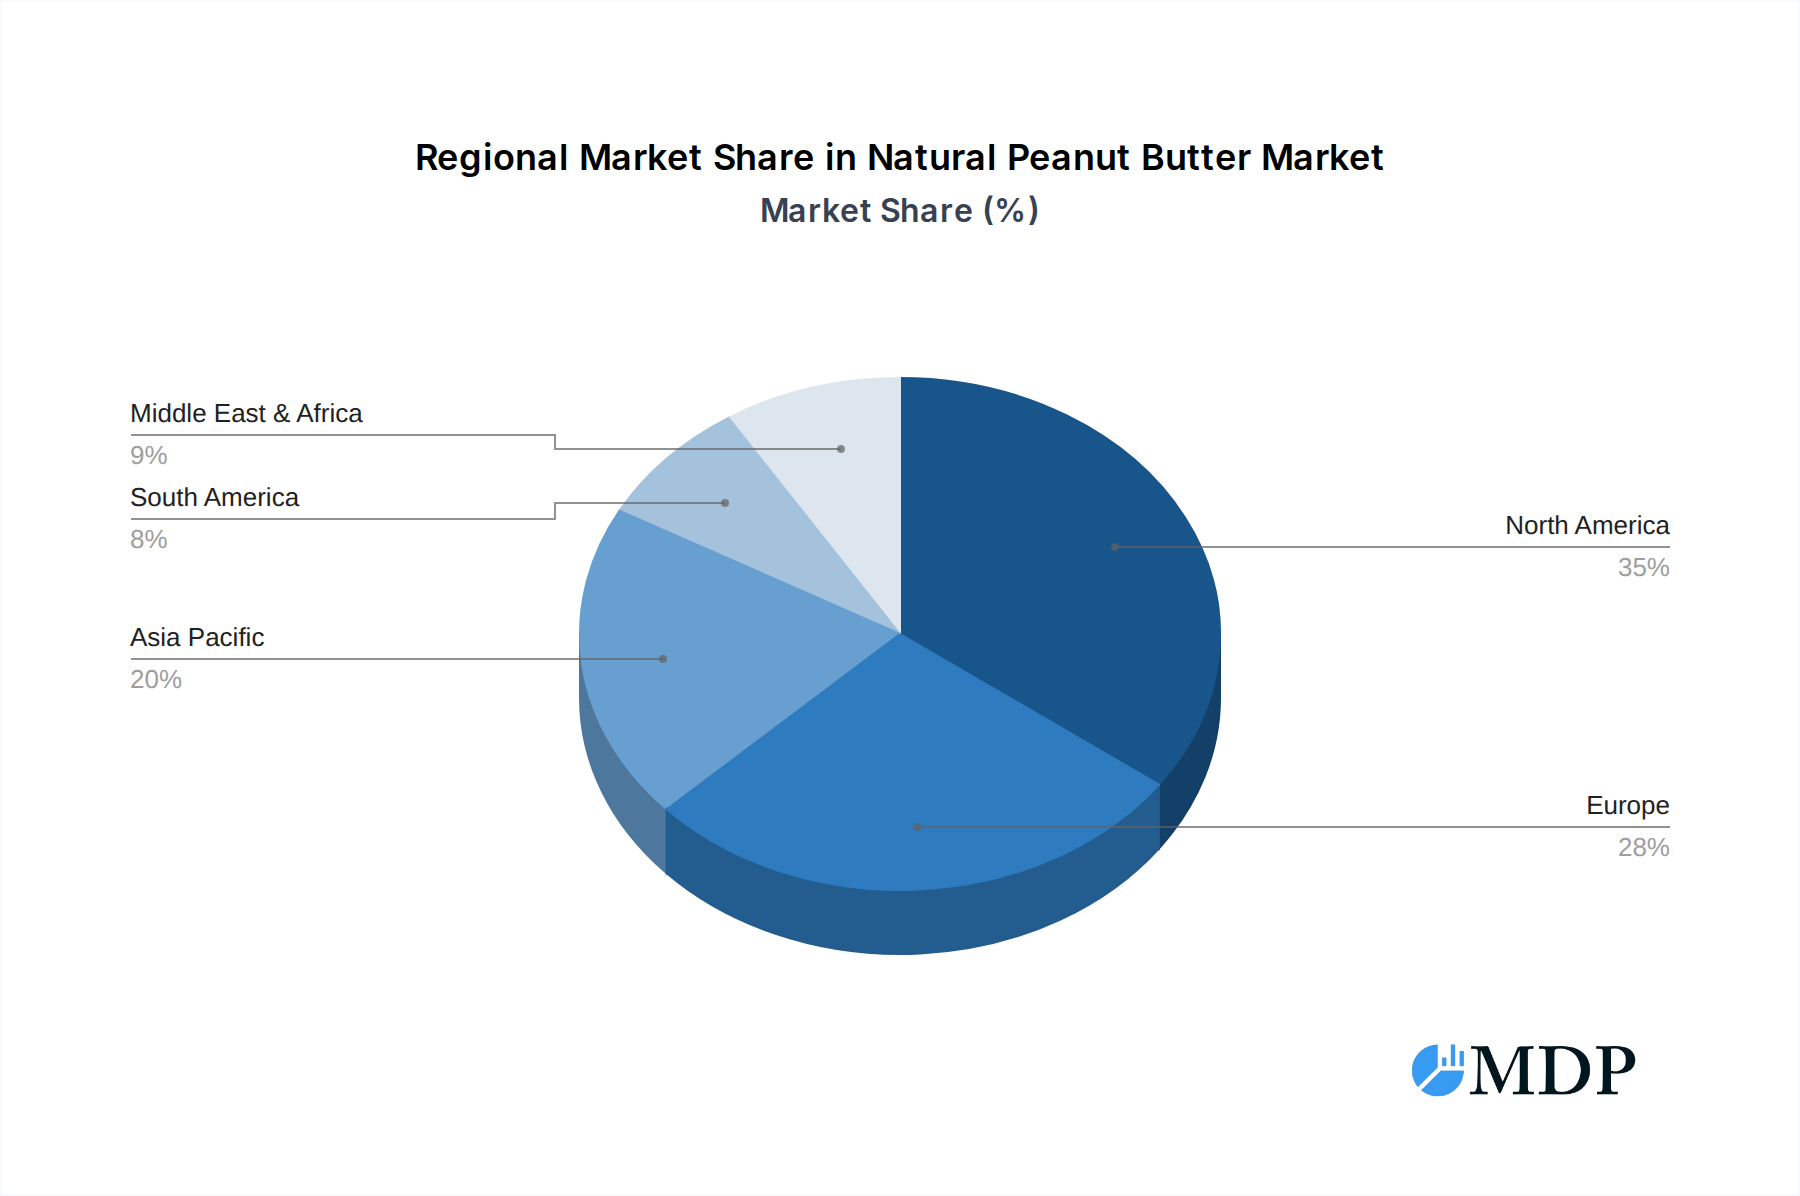
Natural Peanut Butter Regional Market Share
Geographic Coverage of Natural Peanut Butter
Natural Peanut Butter REPORT HIGHLIGHTS
| Aspects | Details |
|---|---|
| Study Period | 2020-2034 |
| Base Year | 2025 |
| Estimated Year | 2026 |
| Forecast Period | 2026-2034 |
| Historical Period | 2020-2025 |
| Growth Rate | CAGR of 6.88% from 2020-2034 |
| Segmentation |
|
Table of Contents
- 1. Introduction
- 1.1. Research Scope
- 1.2. Market Segmentation
- 1.3. Research Methodology
- 1.4. Definitions and Assumptions
- 2. Executive Summary
- 2.1. Introduction
- 3. Market Dynamics
- 3.1. Introduction
- 3.2. Market Drivers
- 3.3. Market Restrains
- 3.4. Market Trends
- 4. Market Factor Analysis
- 4.1. Porters Five Forces
- 4.2. Supply/Value Chain
- 4.3. PESTEL analysis
- 4.4. Market Entropy
- 4.5. Patent/Trademark Analysis
- 5. Global Natural Peanut Butter Analysis, Insights and Forecast, 2020-2032
- 5.1. Market Analysis, Insights and Forecast - by Application
- 5.1.1. Online Sales
- 5.1.2. Offline Sales
- 5.2. Market Analysis, Insights and Forecast - by Types
- 5.2.1. Salted Peanut Butter
- 5.2.2. Sweet Peanut Butter
- 5.3. Market Analysis, Insights and Forecast - by Region
- 5.3.1. North America
- 5.3.2. South America
- 5.3.3. Europe
- 5.3.4. Middle East & Africa
- 5.3.5. Asia Pacific
- 5.1. Market Analysis, Insights and Forecast - by Application
- 6. North America Natural Peanut Butter Analysis, Insights and Forecast, 2020-2032
- 6.1. Market Analysis, Insights and Forecast - by Application
- 6.1.1. Online Sales
- 6.1.2. Offline Sales
- 6.2. Market Analysis, Insights and Forecast - by Types
- 6.2.1. Salted Peanut Butter
- 6.2.2. Sweet Peanut Butter
- 6.1. Market Analysis, Insights and Forecast - by Application
- 7. South America Natural Peanut Butter Analysis, Insights and Forecast, 2020-2032
- 7.1. Market Analysis, Insights and Forecast - by Application
- 7.1.1. Online Sales
- 7.1.2. Offline Sales
- 7.2. Market Analysis, Insights and Forecast - by Types
- 7.2.1. Salted Peanut Butter
- 7.2.2. Sweet Peanut Butter
- 7.1. Market Analysis, Insights and Forecast - by Application
- 8. Europe Natural Peanut Butter Analysis, Insights and Forecast, 2020-2032
- 8.1. Market Analysis, Insights and Forecast - by Application
- 8.1.1. Online Sales
- 8.1.2. Offline Sales
- 8.2. Market Analysis, Insights and Forecast - by Types
- 8.2.1. Salted Peanut Butter
- 8.2.2. Sweet Peanut Butter
- 8.1. Market Analysis, Insights and Forecast - by Application
- 9. Middle East & Africa Natural Peanut Butter Analysis, Insights and Forecast, 2020-2032
- 9.1. Market Analysis, Insights and Forecast - by Application
- 9.1.1. Online Sales
- 9.1.2. Offline Sales
- 9.2. Market Analysis, Insights and Forecast - by Types
- 9.2.1. Salted Peanut Butter
- 9.2.2. Sweet Peanut Butter
- 9.1. Market Analysis, Insights and Forecast - by Application
- 10. Asia Pacific Natural Peanut Butter Analysis, Insights and Forecast, 2020-2032
- 10.1. Market Analysis, Insights and Forecast - by Application
- 10.1.1. Online Sales
- 10.1.2. Offline Sales
- 10.2. Market Analysis, Insights and Forecast - by Types
- 10.2.1. Salted Peanut Butter
- 10.2.2. Sweet Peanut Butter
- 10.1. Market Analysis, Insights and Forecast - by Application
- 11. Competitive Analysis
- 11.1. Global Market Share Analysis 2025
- 11.2. Company Profiles
- 11.2.1 Skippy
- 11.2.1.1. Overview
- 11.2.1.2. Products
- 11.2.1.3. SWOT Analysis
- 11.2.1.4. Recent Developments
- 11.2.1.5. Financials (Based on Availability)
- 11.2.2 Peanut Butter & Co
- 11.2.2.1. Overview
- 11.2.2.2. Products
- 11.2.2.3. SWOT Analysis
- 11.2.2.4. Recent Developments
- 11.2.2.5. Financials (Based on Availability)
- 11.2.3 Saratoga Peanut Butter Company
- 11.2.3.1. Overview
- 11.2.3.2. Products
- 11.2.3.3. SWOT Analysis
- 11.2.3.4. Recent Developments
- 11.2.3.5. Financials (Based on Availability)
- 11.2.4 Once Again
- 11.2.4.1. Overview
- 11.2.4.2. Products
- 11.2.4.3. SWOT Analysis
- 11.2.4.4. Recent Developments
- 11.2.4.5. Financials (Based on Availability)
- 11.2.5 Crazy Richard's
- 11.2.5.1. Overview
- 11.2.5.2. Products
- 11.2.5.3. SWOT Analysis
- 11.2.5.4. Recent Developments
- 11.2.5.5. Financials (Based on Availability)
- 11.2.6 Adams
- 11.2.6.1. Overview
- 11.2.6.2. Products
- 11.2.6.3. SWOT Analysis
- 11.2.6.4. Recent Developments
- 11.2.6.5. Financials (Based on Availability)
- 11.2.7 Laura Scudder’s
- 11.2.7.1. Overview
- 11.2.7.2. Products
- 11.2.7.3. SWOT Analysis
- 11.2.7.4. Recent Developments
- 11.2.7.5. Financials (Based on Availability)
- 11.2.8 Natural Way Food Group
- 11.2.8.1. Overview
- 11.2.8.2. Products
- 11.2.8.3. SWOT Analysis
- 11.2.8.4. Recent Developments
- 11.2.8.5. Financials (Based on Availability)
- 11.2.9 MaraNatha Nut Butters
- 11.2.9.1. Overview
- 11.2.9.2. Products
- 11.2.9.3. SWOT Analysis
- 11.2.9.4. Recent Developments
- 11.2.9.5. Financials (Based on Availability)
- 11.2.10 Smucker's
- 11.2.10.1. Overview
- 11.2.10.2. Products
- 11.2.10.3. SWOT Analysis
- 11.2.10.4. Recent Developments
- 11.2.10.5. Financials (Based on Availability)
- 11.2.11 Jif
- 11.2.11.1. Overview
- 11.2.11.2. Products
- 11.2.11.3. SWOT Analysis
- 11.2.11.4. Recent Developments
- 11.2.11.5. Financials (Based on Availability)
- 11.2.12 American Dream Nut Butter
- 11.2.12.1. Overview
- 11.2.12.2. Products
- 11.2.12.3. SWOT Analysis
- 11.2.12.4. Recent Developments
- 11.2.12.5. Financials (Based on Availability)
- 11.2.1 Skippy
List of Figures
- Figure 1: Global Natural Peanut Butter Revenue Breakdown (billion, %) by Region 2025 & 2033
- Figure 2: Global Natural Peanut Butter Volume Breakdown (K, %) by Region 2025 & 2033
- Figure 3: North America Natural Peanut Butter Revenue (billion), by Application 2025 & 2033
- Figure 4: North America Natural Peanut Butter Volume (K), by Application 2025 & 2033
- Figure 5: North America Natural Peanut Butter Revenue Share (%), by Application 2025 & 2033
- Figure 6: North America Natural Peanut Butter Volume Share (%), by Application 2025 & 2033
- Figure 7: North America Natural Peanut Butter Revenue (billion), by Types 2025 & 2033
- Figure 8: North America Natural Peanut Butter Volume (K), by Types 2025 & 2033
- Figure 9: North America Natural Peanut Butter Revenue Share (%), by Types 2025 & 2033
- Figure 10: North America Natural Peanut Butter Volume Share (%), by Types 2025 & 2033
- Figure 11: North America Natural Peanut Butter Revenue (billion), by Country 2025 & 2033
- Figure 12: North America Natural Peanut Butter Volume (K), by Country 2025 & 2033
- Figure 13: North America Natural Peanut Butter Revenue Share (%), by Country 2025 & 2033
- Figure 14: North America Natural Peanut Butter Volume Share (%), by Country 2025 & 2033
- Figure 15: South America Natural Peanut Butter Revenue (billion), by Application 2025 & 2033
- Figure 16: South America Natural Peanut Butter Volume (K), by Application 2025 & 2033
- Figure 17: South America Natural Peanut Butter Revenue Share (%), by Application 2025 & 2033
- Figure 18: South America Natural Peanut Butter Volume Share (%), by Application 2025 & 2033
- Figure 19: South America Natural Peanut Butter Revenue (billion), by Types 2025 & 2033
- Figure 20: South America Natural Peanut Butter Volume (K), by Types 2025 & 2033
- Figure 21: South America Natural Peanut Butter Revenue Share (%), by Types 2025 & 2033
- Figure 22: South America Natural Peanut Butter Volume Share (%), by Types 2025 & 2033
- Figure 23: South America Natural Peanut Butter Revenue (billion), by Country 2025 & 2033
- Figure 24: South America Natural Peanut Butter Volume (K), by Country 2025 & 2033
- Figure 25: South America Natural Peanut Butter Revenue Share (%), by Country 2025 & 2033
- Figure 26: South America Natural Peanut Butter Volume Share (%), by Country 2025 & 2033
- Figure 27: Europe Natural Peanut Butter Revenue (billion), by Application 2025 & 2033
- Figure 28: Europe Natural Peanut Butter Volume (K), by Application 2025 & 2033
- Figure 29: Europe Natural Peanut Butter Revenue Share (%), by Application 2025 & 2033
- Figure 30: Europe Natural Peanut Butter Volume Share (%), by Application 2025 & 2033
- Figure 31: Europe Natural Peanut Butter Revenue (billion), by Types 2025 & 2033
- Figure 32: Europe Natural Peanut Butter Volume (K), by Types 2025 & 2033
- Figure 33: Europe Natural Peanut Butter Revenue Share (%), by Types 2025 & 2033
- Figure 34: Europe Natural Peanut Butter Volume Share (%), by Types 2025 & 2033
- Figure 35: Europe Natural Peanut Butter Revenue (billion), by Country 2025 & 2033
- Figure 36: Europe Natural Peanut Butter Volume (K), by Country 2025 & 2033
- Figure 37: Europe Natural Peanut Butter Revenue Share (%), by Country 2025 & 2033
- Figure 38: Europe Natural Peanut Butter Volume Share (%), by Country 2025 & 2033
- Figure 39: Middle East & Africa Natural Peanut Butter Revenue (billion), by Application 2025 & 2033
- Figure 40: Middle East & Africa Natural Peanut Butter Volume (K), by Application 2025 & 2033
- Figure 41: Middle East & Africa Natural Peanut Butter Revenue Share (%), by Application 2025 & 2033
- Figure 42: Middle East & Africa Natural Peanut Butter Volume Share (%), by Application 2025 & 2033
- Figure 43: Middle East & Africa Natural Peanut Butter Revenue (billion), by Types 2025 & 2033
- Figure 44: Middle East & Africa Natural Peanut Butter Volume (K), by Types 2025 & 2033
- Figure 45: Middle East & Africa Natural Peanut Butter Revenue Share (%), by Types 2025 & 2033
- Figure 46: Middle East & Africa Natural Peanut Butter Volume Share (%), by Types 2025 & 2033
- Figure 47: Middle East & Africa Natural Peanut Butter Revenue (billion), by Country 2025 & 2033
- Figure 48: Middle East & Africa Natural Peanut Butter Volume (K), by Country 2025 & 2033
- Figure 49: Middle East & Africa Natural Peanut Butter Revenue Share (%), by Country 2025 & 2033
- Figure 50: Middle East & Africa Natural Peanut Butter Volume Share (%), by Country 2025 & 2033
- Figure 51: Asia Pacific Natural Peanut Butter Revenue (billion), by Application 2025 & 2033
- Figure 52: Asia Pacific Natural Peanut Butter Volume (K), by Application 2025 & 2033
- Figure 53: Asia Pacific Natural Peanut Butter Revenue Share (%), by Application 2025 & 2033
- Figure 54: Asia Pacific Natural Peanut Butter Volume Share (%), by Application 2025 & 2033
- Figure 55: Asia Pacific Natural Peanut Butter Revenue (billion), by Types 2025 & 2033
- Figure 56: Asia Pacific Natural Peanut Butter Volume (K), by Types 2025 & 2033
- Figure 57: Asia Pacific Natural Peanut Butter Revenue Share (%), by Types 2025 & 2033
- Figure 58: Asia Pacific Natural Peanut Butter Volume Share (%), by Types 2025 & 2033
- Figure 59: Asia Pacific Natural Peanut Butter Revenue (billion), by Country 2025 & 2033
- Figure 60: Asia Pacific Natural Peanut Butter Volume (K), by Country 2025 & 2033
- Figure 61: Asia Pacific Natural Peanut Butter Revenue Share (%), by Country 2025 & 2033
- Figure 62: Asia Pacific Natural Peanut Butter Volume Share (%), by Country 2025 & 2033
List of Tables
- Table 1: Global Natural Peanut Butter Revenue billion Forecast, by Application 2020 & 2033
- Table 2: Global Natural Peanut Butter Volume K Forecast, by Application 2020 & 2033
- Table 3: Global Natural Peanut Butter Revenue billion Forecast, by Types 2020 & 2033
- Table 4: Global Natural Peanut Butter Volume K Forecast, by Types 2020 & 2033
- Table 5: Global Natural Peanut Butter Revenue billion Forecast, by Region 2020 & 2033
- Table 6: Global Natural Peanut Butter Volume K Forecast, by Region 2020 & 2033
- Table 7: Global Natural Peanut Butter Revenue billion Forecast, by Application 2020 & 2033
- Table 8: Global Natural Peanut Butter Volume K Forecast, by Application 2020 & 2033
- Table 9: Global Natural Peanut Butter Revenue billion Forecast, by Types 2020 & 2033
- Table 10: Global Natural Peanut Butter Volume K Forecast, by Types 2020 & 2033
- Table 11: Global Natural Peanut Butter Revenue billion Forecast, by Country 2020 & 2033
- Table 12: Global Natural Peanut Butter Volume K Forecast, by Country 2020 & 2033
- Table 13: United States Natural Peanut Butter Revenue (billion) Forecast, by Application 2020 & 2033
- Table 14: United States Natural Peanut Butter Volume (K) Forecast, by Application 2020 & 2033
- Table 15: Canada Natural Peanut Butter Revenue (billion) Forecast, by Application 2020 & 2033
- Table 16: Canada Natural Peanut Butter Volume (K) Forecast, by Application 2020 & 2033
- Table 17: Mexico Natural Peanut Butter Revenue (billion) Forecast, by Application 2020 & 2033
- Table 18: Mexico Natural Peanut Butter Volume (K) Forecast, by Application 2020 & 2033
- Table 19: Global Natural Peanut Butter Revenue billion Forecast, by Application 2020 & 2033
- Table 20: Global Natural Peanut Butter Volume K Forecast, by Application 2020 & 2033
- Table 21: Global Natural Peanut Butter Revenue billion Forecast, by Types 2020 & 2033
- Table 22: Global Natural Peanut Butter Volume K Forecast, by Types 2020 & 2033
- Table 23: Global Natural Peanut Butter Revenue billion Forecast, by Country 2020 & 2033
- Table 24: Global Natural Peanut Butter Volume K Forecast, by Country 2020 & 2033
- Table 25: Brazil Natural Peanut Butter Revenue (billion) Forecast, by Application 2020 & 2033
- Table 26: Brazil Natural Peanut Butter Volume (K) Forecast, by Application 2020 & 2033
- Table 27: Argentina Natural Peanut Butter Revenue (billion) Forecast, by Application 2020 & 2033
- Table 28: Argentina Natural Peanut Butter Volume (K) Forecast, by Application 2020 & 2033
- Table 29: Rest of South America Natural Peanut Butter Revenue (billion) Forecast, by Application 2020 & 2033
- Table 30: Rest of South America Natural Peanut Butter Volume (K) Forecast, by Application 2020 & 2033
- Table 31: Global Natural Peanut Butter Revenue billion Forecast, by Application 2020 & 2033
- Table 32: Global Natural Peanut Butter Volume K Forecast, by Application 2020 & 2033
- Table 33: Global Natural Peanut Butter Revenue billion Forecast, by Types 2020 & 2033
- Table 34: Global Natural Peanut Butter Volume K Forecast, by Types 2020 & 2033
- Table 35: Global Natural Peanut Butter Revenue billion Forecast, by Country 2020 & 2033
- Table 36: Global Natural Peanut Butter Volume K Forecast, by Country 2020 & 2033
- Table 37: United Kingdom Natural Peanut Butter Revenue (billion) Forecast, by Application 2020 & 2033
- Table 38: United Kingdom Natural Peanut Butter Volume (K) Forecast, by Application 2020 & 2033
- Table 39: Germany Natural Peanut Butter Revenue (billion) Forecast, by Application 2020 & 2033
- Table 40: Germany Natural Peanut Butter Volume (K) Forecast, by Application 2020 & 2033
- Table 41: France Natural Peanut Butter Revenue (billion) Forecast, by Application 2020 & 2033
- Table 42: France Natural Peanut Butter Volume (K) Forecast, by Application 2020 & 2033
- Table 43: Italy Natural Peanut Butter Revenue (billion) Forecast, by Application 2020 & 2033
- Table 44: Italy Natural Peanut Butter Volume (K) Forecast, by Application 2020 & 2033
- Table 45: Spain Natural Peanut Butter Revenue (billion) Forecast, by Application 2020 & 2033
- Table 46: Spain Natural Peanut Butter Volume (K) Forecast, by Application 2020 & 2033
- Table 47: Russia Natural Peanut Butter Revenue (billion) Forecast, by Application 2020 & 2033
- Table 48: Russia Natural Peanut Butter Volume (K) Forecast, by Application 2020 & 2033
- Table 49: Benelux Natural Peanut Butter Revenue (billion) Forecast, by Application 2020 & 2033
- Table 50: Benelux Natural Peanut Butter Volume (K) Forecast, by Application 2020 & 2033
- Table 51: Nordics Natural Peanut Butter Revenue (billion) Forecast, by Application 2020 & 2033
- Table 52: Nordics Natural Peanut Butter Volume (K) Forecast, by Application 2020 & 2033
- Table 53: Rest of Europe Natural Peanut Butter Revenue (billion) Forecast, by Application 2020 & 2033
- Table 54: Rest of Europe Natural Peanut Butter Volume (K) Forecast, by Application 2020 & 2033
- Table 55: Global Natural Peanut Butter Revenue billion Forecast, by Application 2020 & 2033
- Table 56: Global Natural Peanut Butter Volume K Forecast, by Application 2020 & 2033
- Table 57: Global Natural Peanut Butter Revenue billion Forecast, by Types 2020 & 2033
- Table 58: Global Natural Peanut Butter Volume K Forecast, by Types 2020 & 2033
- Table 59: Global Natural Peanut Butter Revenue billion Forecast, by Country 2020 & 2033
- Table 60: Global Natural Peanut Butter Volume K Forecast, by Country 2020 & 2033
- Table 61: Turkey Natural Peanut Butter Revenue (billion) Forecast, by Application 2020 & 2033
- Table 62: Turkey Natural Peanut Butter Volume (K) Forecast, by Application 2020 & 2033
- Table 63: Israel Natural Peanut Butter Revenue (billion) Forecast, by Application 2020 & 2033
- Table 64: Israel Natural Peanut Butter Volume (K) Forecast, by Application 2020 & 2033
- Table 65: GCC Natural Peanut Butter Revenue (billion) Forecast, by Application 2020 & 2033
- Table 66: GCC Natural Peanut Butter Volume (K) Forecast, by Application 2020 & 2033
- Table 67: North Africa Natural Peanut Butter Revenue (billion) Forecast, by Application 2020 & 2033
- Table 68: North Africa Natural Peanut Butter Volume (K) Forecast, by Application 2020 & 2033
- Table 69: South Africa Natural Peanut Butter Revenue (billion) Forecast, by Application 2020 & 2033
- Table 70: South Africa Natural Peanut Butter Volume (K) Forecast, by Application 2020 & 2033
- Table 71: Rest of Middle East & Africa Natural Peanut Butter Revenue (billion) Forecast, by Application 2020 & 2033
- Table 72: Rest of Middle East & Africa Natural Peanut Butter Volume (K) Forecast, by Application 2020 & 2033
- Table 73: Global Natural Peanut Butter Revenue billion Forecast, by Application 2020 & 2033
- Table 74: Global Natural Peanut Butter Volume K Forecast, by Application 2020 & 2033
- Table 75: Global Natural Peanut Butter Revenue billion Forecast, by Types 2020 & 2033
- Table 76: Global Natural Peanut Butter Volume K Forecast, by Types 2020 & 2033
- Table 77: Global Natural Peanut Butter Revenue billion Forecast, by Country 2020 & 2033
- Table 78: Global Natural Peanut Butter Volume K Forecast, by Country 2020 & 2033
- Table 79: China Natural Peanut Butter Revenue (billion) Forecast, by Application 2020 & 2033
- Table 80: China Natural Peanut Butter Volume (K) Forecast, by Application 2020 & 2033
- Table 81: India Natural Peanut Butter Revenue (billion) Forecast, by Application 2020 & 2033
- Table 82: India Natural Peanut Butter Volume (K) Forecast, by Application 2020 & 2033
- Table 83: Japan Natural Peanut Butter Revenue (billion) Forecast, by Application 2020 & 2033
- Table 84: Japan Natural Peanut Butter Volume (K) Forecast, by Application 2020 & 2033
- Table 85: South Korea Natural Peanut Butter Revenue (billion) Forecast, by Application 2020 & 2033
- Table 86: South Korea Natural Peanut Butter Volume (K) Forecast, by Application 2020 & 2033
- Table 87: ASEAN Natural Peanut Butter Revenue (billion) Forecast, by Application 2020 & 2033
- Table 88: ASEAN Natural Peanut Butter Volume (K) Forecast, by Application 2020 & 2033
- Table 89: Oceania Natural Peanut Butter Revenue (billion) Forecast, by Application 2020 & 2033
- Table 90: Oceania Natural Peanut Butter Volume (K) Forecast, by Application 2020 & 2033
- Table 91: Rest of Asia Pacific Natural Peanut Butter Revenue (billion) Forecast, by Application 2020 & 2033
- Table 92: Rest of Asia Pacific Natural Peanut Butter Volume (K) Forecast, by Application 2020 & 2033
Frequently Asked Questions
1. What is the projected Compound Annual Growth Rate (CAGR) of the Natural Peanut Butter?
The projected CAGR is approximately 6.88%.
2. Which companies are prominent players in the Natural Peanut Butter?
Key companies in the market include Skippy, Peanut Butter & Co, Saratoga Peanut Butter Company, Once Again, Crazy Richard's, Adams, Laura Scudder’s, Natural Way Food Group, MaraNatha Nut Butters, Smucker's, Jif, American Dream Nut Butter.
3. What are the main segments of the Natural Peanut Butter?
The market segments include Application, Types.
4. Can you provide details about the market size?
The market size is estimated to be USD 8.51 billion as of 2022.
5. What are some drivers contributing to market growth?
N/A
6. What are the notable trends driving market growth?
N/A
7. Are there any restraints impacting market growth?
N/A
8. Can you provide examples of recent developments in the market?
N/A
9. What pricing options are available for accessing the report?
Pricing options include single-user, multi-user, and enterprise licenses priced at USD 3950.00, USD 5925.00, and USD 7900.00 respectively.
10. Is the market size provided in terms of value or volume?
The market size is provided in terms of value, measured in billion and volume, measured in K.
11. Are there any specific market keywords associated with the report?
Yes, the market keyword associated with the report is "Natural Peanut Butter," which aids in identifying and referencing the specific market segment covered.
12. How do I determine which pricing option suits my needs best?
The pricing options vary based on user requirements and access needs. Individual users may opt for single-user licenses, while businesses requiring broader access may choose multi-user or enterprise licenses for cost-effective access to the report.
13. Are there any additional resources or data provided in the Natural Peanut Butter report?
While the report offers comprehensive insights, it's advisable to review the specific contents or supplementary materials provided to ascertain if additional resources or data are available.
14. How can I stay updated on further developments or reports in the Natural Peanut Butter?
To stay informed about further developments, trends, and reports in the Natural Peanut Butter, consider subscribing to industry newsletters, following relevant companies and organizations, or regularly checking reputable industry news sources and publications.
Methodology
Step 1 - Identification of Relevant Samples Size from Population Database


Step 2 - Approaches for Defining Global Market Size (Value, Volume* & Price*)

Note*: In applicable scenarios
Step 3 - Data Sources
Primary Research
- Web Analytics
- Survey Reports
- Research Institute
- Latest Research Reports
- Opinion Leaders
Secondary Research
- Annual Reports
- White Paper
- Latest Press Release
- Industry Association
- Paid Database
- Investor Presentations

Step 4 - Data Triangulation
Involves using different sources of information in order to increase the validity of a study
These sources are likely to be stakeholders in a program - participants, other researchers, program staff, other community members, and so on.
Then we put all data in single framework & apply various statistical tools to find out the dynamic on the market.
During the analysis stage, feedback from the stakeholder groups would be compared to determine areas of agreement as well as areas of divergence