

Key Insights
The global medical waste disposal container market is poised for significant expansion, driven by escalating healthcare expenditures, a rise in infectious disease prevalence, and stringent medical waste management regulations. The market is segmented by application, including hospitals, clinics, long-term care facilities, and others, and by container type, such as chemo waste, pharmaceutical waste, sharps disposal, RCRA hazardous waste, and biohazardous waste. Hospitals currently lead in waste generation volume. However, the long-term care segment is projected for robust growth, supported by an aging global population and increased demand for geriatric care. Sharps disposal containers command a substantial market share due to the critical need to mitigate needlestick injury risks and ensure safe disposal practices. Geographically, North America and Europe lead in market share, attributed to well-established healthcare infrastructure and strict regulatory frameworks. Conversely, emerging economies in Asia-Pacific are expected to experience considerable growth, fueled by increasing healthcare awareness and infrastructure investments. The competitive landscape features established multinational corporations and specialized manufacturers, indicating a dynamic market with both mature and emerging players. Technological advancements in container design, enhancing safety and efficiency, further bolster market growth. Potential restraints include fluctuating raw material costs and substantial initial investment requirements for manufacturing.
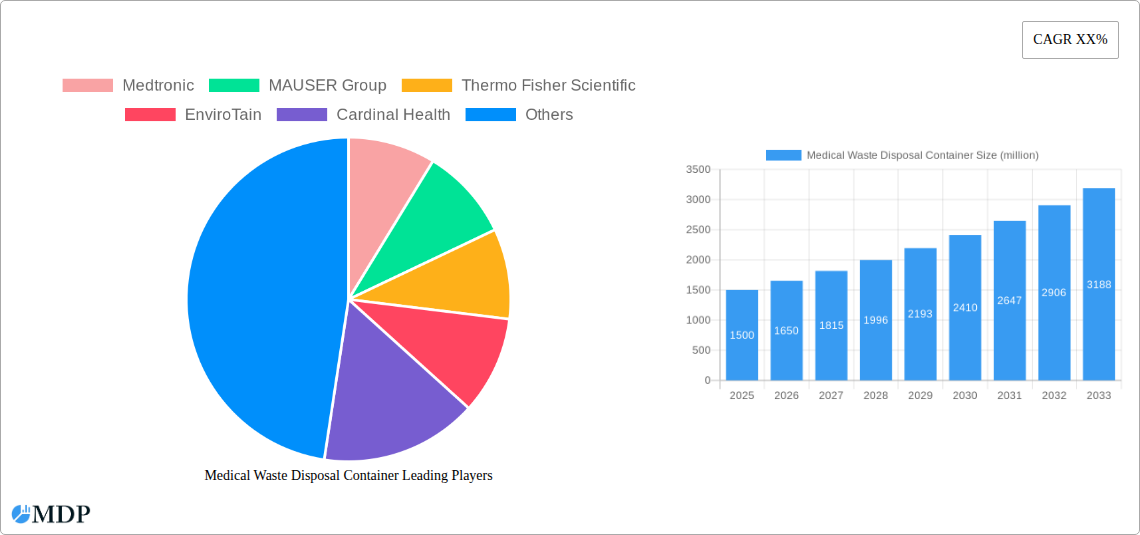
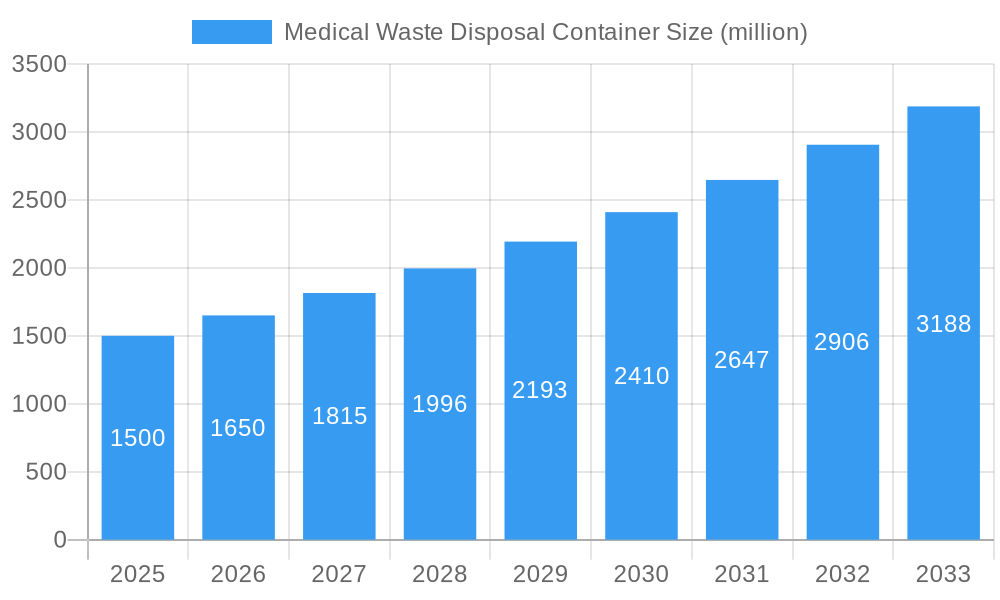
Medical Waste Disposal Container Market Size (In Million)
The forecast period (2025-2033) predicts sustained market growth, propelled by the adoption of advanced waste management technologies and an intensified focus on infection control. Key market strategies include developing innovative, color-coded containers for streamlined waste segregation and enhancing designs for superior safety and leak-proof capabilities. Government initiatives promoting sustainable waste management and increased awareness among healthcare professionals are also key growth drivers. Regional growth rates will vary based on healthcare infrastructure, regulatory landscapes, and economic development. Market consolidation is anticipated, with larger entities potentially acquiring smaller firms to broaden product offerings and geographical presence. Future trends point towards a rising demand for eco-friendly and reusable containers, alongside the integration of smart technologies for real-time waste tracking and management. The market size is projected to reach 563.85 million by 2025, with a compound annual growth rate (CAGR) of 4.53% from the base year 2025.
Medical Waste Disposal Container Company Market Share
Medical Waste Disposal Container Market Report: A Comprehensive Analysis (2019-2033)
This comprehensive report provides an in-depth analysis of the global Medical Waste Disposal Container market, projecting a market value exceeding $XX million by 2033. The study covers the period from 2019 to 2033, with 2025 serving as the base and estimated year. This report is essential for stakeholders including manufacturers, distributors, investors, and regulatory bodies seeking actionable insights into this crucial sector. The analysis incorporates detailed market segmentation by application (Hospitals, Clinics, Long Term Care Centers, Other) and type (Chemo Waste Container, Pharmaceutical Waste Container, Sharps Disposal Container, RCRA Hazardous Waste Container, Biohazardous Waste Container), examining key trends, growth drivers, and challenges. Leading players such as Medtronic, MAUSER Group, Thermo Fisher Scientific, and others are profiled, highlighting their market share and strategic initiatives. The report also forecasts the market's future trajectory, offering invaluable strategic insights for informed decision-making.
Medical Waste Disposal Container Market Dynamics & Concentration
The global medical waste disposal container market exhibits moderate concentration, with a few major players holding significant market share. However, a considerable number of smaller companies contribute to the overall market volume. Innovation is driven by stringent regulatory requirements concerning waste management and the increasing need for safer, more efficient disposal solutions. The market is also influenced by mergers and acquisitions (M&A) activity, with approximately XX M&A deals recorded between 2019 and 2024, resulting in consolidation and increased market share for larger players. The market share for the top five players is estimated to be XX% in 2025. Product substitutes, such as incineration and autoclaving, exert competitive pressure, but the convenience and safety of dedicated containers maintain strong demand. End-user trends show a growing preference for single-use, leak-proof containers.
- Market Concentration: Moderately concentrated, with top 5 players holding XX% market share (2025).
- Innovation Drivers: Stringent regulations, safety concerns, and demand for improved efficiency.
- Regulatory Framework: Significant influence, driving adoption of safer and more compliant containers.
- Product Substitutes: Incineration, autoclaving; however, container-based disposal remains dominant.
- M&A Activity: Approximately XX deals between 2019-2024, leading to market consolidation.
Medical Waste Disposal Container Industry Trends & Analysis
The medical waste disposal container market is experiencing robust growth, projected to achieve a CAGR of XX% during the forecast period (2025-2033). This growth is primarily fueled by increasing healthcare expenditure globally, rising incidence of infectious diseases, and stringent regulations regarding medical waste disposal. Technological advancements, such as the introduction of smart containers with integrated tracking and monitoring systems, are disrupting the market. Consumer preferences are shifting towards eco-friendly and sustainable disposal solutions. Competitive dynamics are shaped by innovation, pricing strategies, and the expansion of distribution networks. Market penetration of smart containers is currently estimated at XX% in 2025 and is expected to reach XX% by 2033.
Leading Markets & Segments in Medical Waste Disposal Container
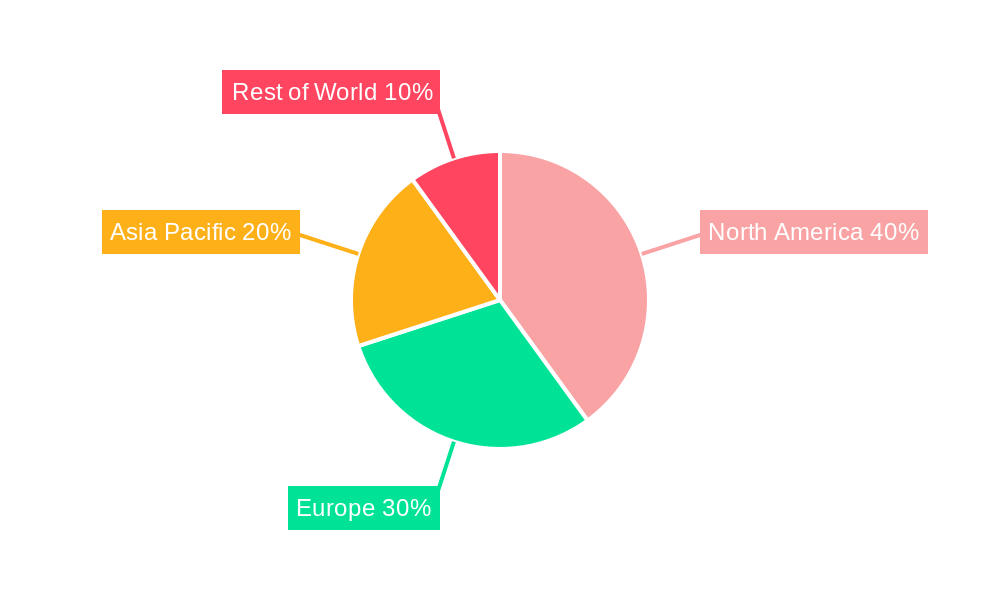
The Hospitals segment dominates the application segment, accounting for approximately XX% of the market in 2025. This is driven by the high volume of medical waste generated in hospitals and stringent infection control protocols. Geographically, North America holds the largest market share due to advanced healthcare infrastructure and robust regulatory frameworks. Within container types, Sharps Disposal Containers are the largest segment, reflecting the significant volume of sharps waste generated across various healthcare settings.
Key Drivers for Hospitals Segment: High volume of medical waste, stringent infection control protocols, and advanced healthcare infrastructure.
Key Drivers for North American Market: Robust regulatory framework, advanced healthcare infrastructure, and high healthcare spending.
Key Drivers for Sharps Disposal Container Segment: Significant volume of sharps waste and stringent safety regulations.
Dominant Region: North America
Dominant Application: Hospitals
Dominant Type: Sharps Disposal Containers
Medical Waste Disposal Container Product Developments
Recent innovations focus on enhancing safety, efficiency, and sustainability. This includes the development of tamper-proof containers, improved leak-proof designs, and eco-friendly materials. Smart containers with integrated tracking and data logging capabilities are gaining traction, improving waste management processes and ensuring compliance. These innovations provide competitive advantages by improving safety, streamlining logistics, and offering enhanced traceability.
Key Drivers of Medical Waste Disposal Container Growth
The market's growth is primarily driven by factors such as stringent government regulations on medical waste management, the increasing prevalence of infectious diseases, technological advancements in container design and manufacturing, rising healthcare expenditure, and a growing awareness of infection control measures. The implementation of stricter regulations necessitates the adoption of safer and more efficient disposal methods, driving demand for specialized containers.
Challenges in the Medical Waste Disposal Container Market
The market faces challenges such as fluctuating raw material prices, the complexity of regulatory compliance across different regions, and the potential for disruptions in the supply chain. These factors can lead to increased production costs and affect market stability. Furthermore, intense competition among manufacturers can put pressure on profit margins. The estimated impact of these challenges on overall market growth is approximately XX% annually.
Emerging Opportunities in Medical Waste Disposal Container
Significant opportunities exist in developing and implementing advanced waste management technologies, such as smart containers with real-time monitoring capabilities. Strategic partnerships between manufacturers and waste management companies can create synergies and enhance market reach. Expansion into emerging markets with growing healthcare sectors represents a significant growth avenue. The adoption of sustainable and eco-friendly materials also presents a compelling opportunity.
Leading Players in the Medical Waste Disposal Container Sector
- Medtronic
- MAUSER Group
- Thermo Fisher Scientific
- EnviroTain
- Cardinal Health
- Bemis Manufacturing Company
- Terra Universal
- Daniels Health
- GPC Medical
- Sharps Compliance
- Bondtech Corporation
Key Milestones in Medical Waste Disposal Container Industry
- 2020: Introduction of a new, tamper-evident sharps container by Medtronic.
- 2021: MAUSER Group launched a line of sustainable medical waste containers.
- 2022: Acquisition of a smaller medical waste container manufacturer by Thermo Fisher Scientific.
- 2023: Implementation of stricter waste management regulations in several key markets.
- 2024: Launch of a smart container with integrated tracking by a new market entrant.
Strategic Outlook for Medical Waste Disposal Container Market
The medical waste disposal container market presents significant long-term growth potential driven by several factors, including stricter regulations, technological advancements, and a heightened focus on infection control. Companies that prioritize innovation, sustainability, and strategic partnerships are well-positioned to capture a greater market share and capitalize on emerging opportunities. The market is expected to witness continued consolidation through M&A activities and the emergence of new technologies.
Medical Waste Disposal Container Segmentation
-
1. Application
- 1.1. Hospitals
- 1.2. Clinics
- 1.3. Long Term Care Center
- 1.4. Other
-
2. Types
- 2.1. Chemo Waste Container
- 2.2. Pharmaceutical Waste Container
- 2.3. Sharps Disposal Container
- 2.4. RCRA Hazardous Waste Container
- 2.5. Biohazardous Waste Container
Medical Waste Disposal Container Segmentation By Geography
-
1. North America
- 1.1. United States
- 1.2. Canada
- 1.3. Mexico
-
2. South America
- 2.1. Brazil
- 2.2. Argentina
- 2.3. Rest of South America
-
3. Europe
- 3.1. United Kingdom
- 3.2. Germany
- 3.3. France
- 3.4. Italy
- 3.5. Spain
- 3.6. Russia
- 3.7. Benelux
- 3.8. Nordics
- 3.9. Rest of Europe
-
4. Middle East & Africa
- 4.1. Turkey
- 4.2. Israel
- 4.3. GCC
- 4.4. North Africa
- 4.5. South Africa
- 4.6. Rest of Middle East & Africa
-
5. Asia Pacific
- 5.1. China
- 5.2. India
- 5.3. Japan
- 5.4. South Korea
- 5.5. ASEAN
- 5.6. Oceania
- 5.7. Rest of Asia Pacific
Medical Waste Disposal Container Regional Market Share
Geographic Coverage of Medical Waste Disposal Container
Medical Waste Disposal Container REPORT HIGHLIGHTS
| Aspects | Details |
|---|---|
| Study Period | 2020-2034 |
| Base Year | 2025 |
| Estimated Year | 2026 |
| Forecast Period | 2026-2034 |
| Historical Period | 2020-2025 |
| Growth Rate | CAGR of 4.53% from 2020-2034 |
| Segmentation |
|
Table of Contents
- 1. Introduction
- 1.1. Research Scope
- 1.2. Market Segmentation
- 1.3. Research Methodology
- 1.4. Definitions and Assumptions
- 2. Executive Summary
- 2.1. Introduction
- 3. Market Dynamics
- 3.1. Introduction
- 3.2. Market Drivers
- 3.3. Market Restrains
- 3.4. Market Trends
- 4. Market Factor Analysis
- 4.1. Porters Five Forces
- 4.2. Supply/Value Chain
- 4.3. PESTEL analysis
- 4.4. Market Entropy
- 4.5. Patent/Trademark Analysis
- 5. Global Medical Waste Disposal Container Analysis, Insights and Forecast, 2020-2032
- 5.1. Market Analysis, Insights and Forecast - by Application
- 5.1.1. Hospitals
- 5.1.2. Clinics
- 5.1.3. Long Term Care Center
- 5.1.4. Other
- 5.2. Market Analysis, Insights and Forecast - by Types
- 5.2.1. Chemo Waste Container
- 5.2.2. Pharmaceutical Waste Container
- 5.2.3. Sharps Disposal Container
- 5.2.4. RCRA Hazardous Waste Container
- 5.2.5. Biohazardous Waste Container
- 5.3. Market Analysis, Insights and Forecast - by Region
- 5.3.1. North America
- 5.3.2. South America
- 5.3.3. Europe
- 5.3.4. Middle East & Africa
- 5.3.5. Asia Pacific
- 5.1. Market Analysis, Insights and Forecast - by Application
- 6. North America Medical Waste Disposal Container Analysis, Insights and Forecast, 2020-2032
- 6.1. Market Analysis, Insights and Forecast - by Application
- 6.1.1. Hospitals
- 6.1.2. Clinics
- 6.1.3. Long Term Care Center
- 6.1.4. Other
- 6.2. Market Analysis, Insights and Forecast - by Types
- 6.2.1. Chemo Waste Container
- 6.2.2. Pharmaceutical Waste Container
- 6.2.3. Sharps Disposal Container
- 6.2.4. RCRA Hazardous Waste Container
- 6.2.5. Biohazardous Waste Container
- 6.1. Market Analysis, Insights and Forecast - by Application
- 7. South America Medical Waste Disposal Container Analysis, Insights and Forecast, 2020-2032
- 7.1. Market Analysis, Insights and Forecast - by Application
- 7.1.1. Hospitals
- 7.1.2. Clinics
- 7.1.3. Long Term Care Center
- 7.1.4. Other
- 7.2. Market Analysis, Insights and Forecast - by Types
- 7.2.1. Chemo Waste Container
- 7.2.2. Pharmaceutical Waste Container
- 7.2.3. Sharps Disposal Container
- 7.2.4. RCRA Hazardous Waste Container
- 7.2.5. Biohazardous Waste Container
- 7.1. Market Analysis, Insights and Forecast - by Application
- 8. Europe Medical Waste Disposal Container Analysis, Insights and Forecast, 2020-2032
- 8.1. Market Analysis, Insights and Forecast - by Application
- 8.1.1. Hospitals
- 8.1.2. Clinics
- 8.1.3. Long Term Care Center
- 8.1.4. Other
- 8.2. Market Analysis, Insights and Forecast - by Types
- 8.2.1. Chemo Waste Container
- 8.2.2. Pharmaceutical Waste Container
- 8.2.3. Sharps Disposal Container
- 8.2.4. RCRA Hazardous Waste Container
- 8.2.5. Biohazardous Waste Container
- 8.1. Market Analysis, Insights and Forecast - by Application
- 9. Middle East & Africa Medical Waste Disposal Container Analysis, Insights and Forecast, 2020-2032
- 9.1. Market Analysis, Insights and Forecast - by Application
- 9.1.1. Hospitals
- 9.1.2. Clinics
- 9.1.3. Long Term Care Center
- 9.1.4. Other
- 9.2. Market Analysis, Insights and Forecast - by Types
- 9.2.1. Chemo Waste Container
- 9.2.2. Pharmaceutical Waste Container
- 9.2.3. Sharps Disposal Container
- 9.2.4. RCRA Hazardous Waste Container
- 9.2.5. Biohazardous Waste Container
- 9.1. Market Analysis, Insights and Forecast - by Application
- 10. Asia Pacific Medical Waste Disposal Container Analysis, Insights and Forecast, 2020-2032
- 10.1. Market Analysis, Insights and Forecast - by Application
- 10.1.1. Hospitals
- 10.1.2. Clinics
- 10.1.3. Long Term Care Center
- 10.1.4. Other
- 10.2. Market Analysis, Insights and Forecast - by Types
- 10.2.1. Chemo Waste Container
- 10.2.2. Pharmaceutical Waste Container
- 10.2.3. Sharps Disposal Container
- 10.2.4. RCRA Hazardous Waste Container
- 10.2.5. Biohazardous Waste Container
- 10.1. Market Analysis, Insights and Forecast - by Application
- 11. Competitive Analysis
- 11.1. Global Market Share Analysis 2025
- 11.2. Company Profiles
- 11.2.1 Medtronic
- 11.2.1.1. Overview
- 11.2.1.2. Products
- 11.2.1.3. SWOT Analysis
- 11.2.1.4. Recent Developments
- 11.2.1.5. Financials (Based on Availability)
- 11.2.2 MAUSER Group
- 11.2.2.1. Overview
- 11.2.2.2. Products
- 11.2.2.3. SWOT Analysis
- 11.2.2.4. Recent Developments
- 11.2.2.5. Financials (Based on Availability)
- 11.2.3 Thermo Fisher Scientific
- 11.2.3.1. Overview
- 11.2.3.2. Products
- 11.2.3.3. SWOT Analysis
- 11.2.3.4. Recent Developments
- 11.2.3.5. Financials (Based on Availability)
- 11.2.4 EnviroTain
- 11.2.4.1. Overview
- 11.2.4.2. Products
- 11.2.4.3. SWOT Analysis
- 11.2.4.4. Recent Developments
- 11.2.4.5. Financials (Based on Availability)
- 11.2.5 Cardinal Health
- 11.2.5.1. Overview
- 11.2.5.2. Products
- 11.2.5.3. SWOT Analysis
- 11.2.5.4. Recent Developments
- 11.2.5.5. Financials (Based on Availability)
- 11.2.6 Bemis Manufacturing Company
- 11.2.6.1. Overview
- 11.2.6.2. Products
- 11.2.6.3. SWOT Analysis
- 11.2.6.4. Recent Developments
- 11.2.6.5. Financials (Based on Availability)
- 11.2.7 Terra Universal
- 11.2.7.1. Overview
- 11.2.7.2. Products
- 11.2.7.3. SWOT Analysis
- 11.2.7.4. Recent Developments
- 11.2.7.5. Financials (Based on Availability)
- 11.2.8 Daniels Health
- 11.2.8.1. Overview
- 11.2.8.2. Products
- 11.2.8.3. SWOT Analysis
- 11.2.8.4. Recent Developments
- 11.2.8.5. Financials (Based on Availability)
- 11.2.9 GPC Medical
- 11.2.9.1. Overview
- 11.2.9.2. Products
- 11.2.9.3. SWOT Analysis
- 11.2.9.4. Recent Developments
- 11.2.9.5. Financials (Based on Availability)
- 11.2.10 Sharps Compliance
- 11.2.10.1. Overview
- 11.2.10.2. Products
- 11.2.10.3. SWOT Analysis
- 11.2.10.4. Recent Developments
- 11.2.10.5. Financials (Based on Availability)
- 11.2.11 Bondtech Corporation
- 11.2.11.1. Overview
- 11.2.11.2. Products
- 11.2.11.3. SWOT Analysis
- 11.2.11.4. Recent Developments
- 11.2.11.5. Financials (Based on Availability)
- 11.2.1 Medtronic
List of Figures
- Figure 1: Global Medical Waste Disposal Container Revenue Breakdown (million, %) by Region 2025 & 2033
- Figure 2: Global Medical Waste Disposal Container Volume Breakdown (K, %) by Region 2025 & 2033
- Figure 3: North America Medical Waste Disposal Container Revenue (million), by Application 2025 & 2033
- Figure 4: North America Medical Waste Disposal Container Volume (K), by Application 2025 & 2033
- Figure 5: North America Medical Waste Disposal Container Revenue Share (%), by Application 2025 & 2033
- Figure 6: North America Medical Waste Disposal Container Volume Share (%), by Application 2025 & 2033
- Figure 7: North America Medical Waste Disposal Container Revenue (million), by Types 2025 & 2033
- Figure 8: North America Medical Waste Disposal Container Volume (K), by Types 2025 & 2033
- Figure 9: North America Medical Waste Disposal Container Revenue Share (%), by Types 2025 & 2033
- Figure 10: North America Medical Waste Disposal Container Volume Share (%), by Types 2025 & 2033
- Figure 11: North America Medical Waste Disposal Container Revenue (million), by Country 2025 & 2033
- Figure 12: North America Medical Waste Disposal Container Volume (K), by Country 2025 & 2033
- Figure 13: North America Medical Waste Disposal Container Revenue Share (%), by Country 2025 & 2033
- Figure 14: North America Medical Waste Disposal Container Volume Share (%), by Country 2025 & 2033
- Figure 15: South America Medical Waste Disposal Container Revenue (million), by Application 2025 & 2033
- Figure 16: South America Medical Waste Disposal Container Volume (K), by Application 2025 & 2033
- Figure 17: South America Medical Waste Disposal Container Revenue Share (%), by Application 2025 & 2033
- Figure 18: South America Medical Waste Disposal Container Volume Share (%), by Application 2025 & 2033
- Figure 19: South America Medical Waste Disposal Container Revenue (million), by Types 2025 & 2033
- Figure 20: South America Medical Waste Disposal Container Volume (K), by Types 2025 & 2033
- Figure 21: South America Medical Waste Disposal Container Revenue Share (%), by Types 2025 & 2033
- Figure 22: South America Medical Waste Disposal Container Volume Share (%), by Types 2025 & 2033
- Figure 23: South America Medical Waste Disposal Container Revenue (million), by Country 2025 & 2033
- Figure 24: South America Medical Waste Disposal Container Volume (K), by Country 2025 & 2033
- Figure 25: South America Medical Waste Disposal Container Revenue Share (%), by Country 2025 & 2033
- Figure 26: South America Medical Waste Disposal Container Volume Share (%), by Country 2025 & 2033
- Figure 27: Europe Medical Waste Disposal Container Revenue (million), by Application 2025 & 2033
- Figure 28: Europe Medical Waste Disposal Container Volume (K), by Application 2025 & 2033
- Figure 29: Europe Medical Waste Disposal Container Revenue Share (%), by Application 2025 & 2033
- Figure 30: Europe Medical Waste Disposal Container Volume Share (%), by Application 2025 & 2033
- Figure 31: Europe Medical Waste Disposal Container Revenue (million), by Types 2025 & 2033
- Figure 32: Europe Medical Waste Disposal Container Volume (K), by Types 2025 & 2033
- Figure 33: Europe Medical Waste Disposal Container Revenue Share (%), by Types 2025 & 2033
- Figure 34: Europe Medical Waste Disposal Container Volume Share (%), by Types 2025 & 2033
- Figure 35: Europe Medical Waste Disposal Container Revenue (million), by Country 2025 & 2033
- Figure 36: Europe Medical Waste Disposal Container Volume (K), by Country 2025 & 2033
- Figure 37: Europe Medical Waste Disposal Container Revenue Share (%), by Country 2025 & 2033
- Figure 38: Europe Medical Waste Disposal Container Volume Share (%), by Country 2025 & 2033
- Figure 39: Middle East & Africa Medical Waste Disposal Container Revenue (million), by Application 2025 & 2033
- Figure 40: Middle East & Africa Medical Waste Disposal Container Volume (K), by Application 2025 & 2033
- Figure 41: Middle East & Africa Medical Waste Disposal Container Revenue Share (%), by Application 2025 & 2033
- Figure 42: Middle East & Africa Medical Waste Disposal Container Volume Share (%), by Application 2025 & 2033
- Figure 43: Middle East & Africa Medical Waste Disposal Container Revenue (million), by Types 2025 & 2033
- Figure 44: Middle East & Africa Medical Waste Disposal Container Volume (K), by Types 2025 & 2033
- Figure 45: Middle East & Africa Medical Waste Disposal Container Revenue Share (%), by Types 2025 & 2033
- Figure 46: Middle East & Africa Medical Waste Disposal Container Volume Share (%), by Types 2025 & 2033
- Figure 47: Middle East & Africa Medical Waste Disposal Container Revenue (million), by Country 2025 & 2033
- Figure 48: Middle East & Africa Medical Waste Disposal Container Volume (K), by Country 2025 & 2033
- Figure 49: Middle East & Africa Medical Waste Disposal Container Revenue Share (%), by Country 2025 & 2033
- Figure 50: Middle East & Africa Medical Waste Disposal Container Volume Share (%), by Country 2025 & 2033
- Figure 51: Asia Pacific Medical Waste Disposal Container Revenue (million), by Application 2025 & 2033
- Figure 52: Asia Pacific Medical Waste Disposal Container Volume (K), by Application 2025 & 2033
- Figure 53: Asia Pacific Medical Waste Disposal Container Revenue Share (%), by Application 2025 & 2033
- Figure 54: Asia Pacific Medical Waste Disposal Container Volume Share (%), by Application 2025 & 2033
- Figure 55: Asia Pacific Medical Waste Disposal Container Revenue (million), by Types 2025 & 2033
- Figure 56: Asia Pacific Medical Waste Disposal Container Volume (K), by Types 2025 & 2033
- Figure 57: Asia Pacific Medical Waste Disposal Container Revenue Share (%), by Types 2025 & 2033
- Figure 58: Asia Pacific Medical Waste Disposal Container Volume Share (%), by Types 2025 & 2033
- Figure 59: Asia Pacific Medical Waste Disposal Container Revenue (million), by Country 2025 & 2033
- Figure 60: Asia Pacific Medical Waste Disposal Container Volume (K), by Country 2025 & 2033
- Figure 61: Asia Pacific Medical Waste Disposal Container Revenue Share (%), by Country 2025 & 2033
- Figure 62: Asia Pacific Medical Waste Disposal Container Volume Share (%), by Country 2025 & 2033
List of Tables
- Table 1: Global Medical Waste Disposal Container Revenue million Forecast, by Application 2020 & 2033
- Table 2: Global Medical Waste Disposal Container Volume K Forecast, by Application 2020 & 2033
- Table 3: Global Medical Waste Disposal Container Revenue million Forecast, by Types 2020 & 2033
- Table 4: Global Medical Waste Disposal Container Volume K Forecast, by Types 2020 & 2033
- Table 5: Global Medical Waste Disposal Container Revenue million Forecast, by Region 2020 & 2033
- Table 6: Global Medical Waste Disposal Container Volume K Forecast, by Region 2020 & 2033
- Table 7: Global Medical Waste Disposal Container Revenue million Forecast, by Application 2020 & 2033
- Table 8: Global Medical Waste Disposal Container Volume K Forecast, by Application 2020 & 2033
- Table 9: Global Medical Waste Disposal Container Revenue million Forecast, by Types 2020 & 2033
- Table 10: Global Medical Waste Disposal Container Volume K Forecast, by Types 2020 & 2033
- Table 11: Global Medical Waste Disposal Container Revenue million Forecast, by Country 2020 & 2033
- Table 12: Global Medical Waste Disposal Container Volume K Forecast, by Country 2020 & 2033
- Table 13: United States Medical Waste Disposal Container Revenue (million) Forecast, by Application 2020 & 2033
- Table 14: United States Medical Waste Disposal Container Volume (K) Forecast, by Application 2020 & 2033
- Table 15: Canada Medical Waste Disposal Container Revenue (million) Forecast, by Application 2020 & 2033
- Table 16: Canada Medical Waste Disposal Container Volume (K) Forecast, by Application 2020 & 2033
- Table 17: Mexico Medical Waste Disposal Container Revenue (million) Forecast, by Application 2020 & 2033
- Table 18: Mexico Medical Waste Disposal Container Volume (K) Forecast, by Application 2020 & 2033
- Table 19: Global Medical Waste Disposal Container Revenue million Forecast, by Application 2020 & 2033
- Table 20: Global Medical Waste Disposal Container Volume K Forecast, by Application 2020 & 2033
- Table 21: Global Medical Waste Disposal Container Revenue million Forecast, by Types 2020 & 2033
- Table 22: Global Medical Waste Disposal Container Volume K Forecast, by Types 2020 & 2033
- Table 23: Global Medical Waste Disposal Container Revenue million Forecast, by Country 2020 & 2033
- Table 24: Global Medical Waste Disposal Container Volume K Forecast, by Country 2020 & 2033
- Table 25: Brazil Medical Waste Disposal Container Revenue (million) Forecast, by Application 2020 & 2033
- Table 26: Brazil Medical Waste Disposal Container Volume (K) Forecast, by Application 2020 & 2033
- Table 27: Argentina Medical Waste Disposal Container Revenue (million) Forecast, by Application 2020 & 2033
- Table 28: Argentina Medical Waste Disposal Container Volume (K) Forecast, by Application 2020 & 2033
- Table 29: Rest of South America Medical Waste Disposal Container Revenue (million) Forecast, by Application 2020 & 2033
- Table 30: Rest of South America Medical Waste Disposal Container Volume (K) Forecast, by Application 2020 & 2033
- Table 31: Global Medical Waste Disposal Container Revenue million Forecast, by Application 2020 & 2033
- Table 32: Global Medical Waste Disposal Container Volume K Forecast, by Application 2020 & 2033
- Table 33: Global Medical Waste Disposal Container Revenue million Forecast, by Types 2020 & 2033
- Table 34: Global Medical Waste Disposal Container Volume K Forecast, by Types 2020 & 2033
- Table 35: Global Medical Waste Disposal Container Revenue million Forecast, by Country 2020 & 2033
- Table 36: Global Medical Waste Disposal Container Volume K Forecast, by Country 2020 & 2033
- Table 37: United Kingdom Medical Waste Disposal Container Revenue (million) Forecast, by Application 2020 & 2033
- Table 38: United Kingdom Medical Waste Disposal Container Volume (K) Forecast, by Application 2020 & 2033
- Table 39: Germany Medical Waste Disposal Container Revenue (million) Forecast, by Application 2020 & 2033
- Table 40: Germany Medical Waste Disposal Container Volume (K) Forecast, by Application 2020 & 2033
- Table 41: France Medical Waste Disposal Container Revenue (million) Forecast, by Application 2020 & 2033
- Table 42: France Medical Waste Disposal Container Volume (K) Forecast, by Application 2020 & 2033
- Table 43: Italy Medical Waste Disposal Container Revenue (million) Forecast, by Application 2020 & 2033
- Table 44: Italy Medical Waste Disposal Container Volume (K) Forecast, by Application 2020 & 2033
- Table 45: Spain Medical Waste Disposal Container Revenue (million) Forecast, by Application 2020 & 2033
- Table 46: Spain Medical Waste Disposal Container Volume (K) Forecast, by Application 2020 & 2033
- Table 47: Russia Medical Waste Disposal Container Revenue (million) Forecast, by Application 2020 & 2033
- Table 48: Russia Medical Waste Disposal Container Volume (K) Forecast, by Application 2020 & 2033
- Table 49: Benelux Medical Waste Disposal Container Revenue (million) Forecast, by Application 2020 & 2033
- Table 50: Benelux Medical Waste Disposal Container Volume (K) Forecast, by Application 2020 & 2033
- Table 51: Nordics Medical Waste Disposal Container Revenue (million) Forecast, by Application 2020 & 2033
- Table 52: Nordics Medical Waste Disposal Container Volume (K) Forecast, by Application 2020 & 2033
- Table 53: Rest of Europe Medical Waste Disposal Container Revenue (million) Forecast, by Application 2020 & 2033
- Table 54: Rest of Europe Medical Waste Disposal Container Volume (K) Forecast, by Application 2020 & 2033
- Table 55: Global Medical Waste Disposal Container Revenue million Forecast, by Application 2020 & 2033
- Table 56: Global Medical Waste Disposal Container Volume K Forecast, by Application 2020 & 2033
- Table 57: Global Medical Waste Disposal Container Revenue million Forecast, by Types 2020 & 2033
- Table 58: Global Medical Waste Disposal Container Volume K Forecast, by Types 2020 & 2033
- Table 59: Global Medical Waste Disposal Container Revenue million Forecast, by Country 2020 & 2033
- Table 60: Global Medical Waste Disposal Container Volume K Forecast, by Country 2020 & 2033
- Table 61: Turkey Medical Waste Disposal Container Revenue (million) Forecast, by Application 2020 & 2033
- Table 62: Turkey Medical Waste Disposal Container Volume (K) Forecast, by Application 2020 & 2033
- Table 63: Israel Medical Waste Disposal Container Revenue (million) Forecast, by Application 2020 & 2033
- Table 64: Israel Medical Waste Disposal Container Volume (K) Forecast, by Application 2020 & 2033
- Table 65: GCC Medical Waste Disposal Container Revenue (million) Forecast, by Application 2020 & 2033
- Table 66: GCC Medical Waste Disposal Container Volume (K) Forecast, by Application 2020 & 2033
- Table 67: North Africa Medical Waste Disposal Container Revenue (million) Forecast, by Application 2020 & 2033
- Table 68: North Africa Medical Waste Disposal Container Volume (K) Forecast, by Application 2020 & 2033
- Table 69: South Africa Medical Waste Disposal Container Revenue (million) Forecast, by Application 2020 & 2033
- Table 70: South Africa Medical Waste Disposal Container Volume (K) Forecast, by Application 2020 & 2033
- Table 71: Rest of Middle East & Africa Medical Waste Disposal Container Revenue (million) Forecast, by Application 2020 & 2033
- Table 72: Rest of Middle East & Africa Medical Waste Disposal Container Volume (K) Forecast, by Application 2020 & 2033
- Table 73: Global Medical Waste Disposal Container Revenue million Forecast, by Application 2020 & 2033
- Table 74: Global Medical Waste Disposal Container Volume K Forecast, by Application 2020 & 2033
- Table 75: Global Medical Waste Disposal Container Revenue million Forecast, by Types 2020 & 2033
- Table 76: Global Medical Waste Disposal Container Volume K Forecast, by Types 2020 & 2033
- Table 77: Global Medical Waste Disposal Container Revenue million Forecast, by Country 2020 & 2033
- Table 78: Global Medical Waste Disposal Container Volume K Forecast, by Country 2020 & 2033
- Table 79: China Medical Waste Disposal Container Revenue (million) Forecast, by Application 2020 & 2033
- Table 80: China Medical Waste Disposal Container Volume (K) Forecast, by Application 2020 & 2033
- Table 81: India Medical Waste Disposal Container Revenue (million) Forecast, by Application 2020 & 2033
- Table 82: India Medical Waste Disposal Container Volume (K) Forecast, by Application 2020 & 2033
- Table 83: Japan Medical Waste Disposal Container Revenue (million) Forecast, by Application 2020 & 2033
- Table 84: Japan Medical Waste Disposal Container Volume (K) Forecast, by Application 2020 & 2033
- Table 85: South Korea Medical Waste Disposal Container Revenue (million) Forecast, by Application 2020 & 2033
- Table 86: South Korea Medical Waste Disposal Container Volume (K) Forecast, by Application 2020 & 2033
- Table 87: ASEAN Medical Waste Disposal Container Revenue (million) Forecast, by Application 2020 & 2033
- Table 88: ASEAN Medical Waste Disposal Container Volume (K) Forecast, by Application 2020 & 2033
- Table 89: Oceania Medical Waste Disposal Container Revenue (million) Forecast, by Application 2020 & 2033
- Table 90: Oceania Medical Waste Disposal Container Volume (K) Forecast, by Application 2020 & 2033
- Table 91: Rest of Asia Pacific Medical Waste Disposal Container Revenue (million) Forecast, by Application 2020 & 2033
- Table 92: Rest of Asia Pacific Medical Waste Disposal Container Volume (K) Forecast, by Application 2020 & 2033
Frequently Asked Questions
1. What is the projected Compound Annual Growth Rate (CAGR) of the Medical Waste Disposal Container?
The projected CAGR is approximately 4.53%.
2. Which companies are prominent players in the Medical Waste Disposal Container?
Key companies in the market include Medtronic, MAUSER Group, Thermo Fisher Scientific, EnviroTain, Cardinal Health, Bemis Manufacturing Company, Terra Universal, Daniels Health, GPC Medical, Sharps Compliance, Bondtech Corporation.
3. What are the main segments of the Medical Waste Disposal Container?
The market segments include Application, Types.
4. Can you provide details about the market size?
The market size is estimated to be USD 563.85 million as of 2022.
5. What are some drivers contributing to market growth?
N/A
6. What are the notable trends driving market growth?
N/A
7. Are there any restraints impacting market growth?
N/A
8. Can you provide examples of recent developments in the market?
N/A
9. What pricing options are available for accessing the report?
Pricing options include single-user, multi-user, and enterprise licenses priced at USD 3950.00, USD 5925.00, and USD 7900.00 respectively.
10. Is the market size provided in terms of value or volume?
The market size is provided in terms of value, measured in million and volume, measured in K.
11. Are there any specific market keywords associated with the report?
Yes, the market keyword associated with the report is "Medical Waste Disposal Container," which aids in identifying and referencing the specific market segment covered.
12. How do I determine which pricing option suits my needs best?
The pricing options vary based on user requirements and access needs. Individual users may opt for single-user licenses, while businesses requiring broader access may choose multi-user or enterprise licenses for cost-effective access to the report.
13. Are there any additional resources or data provided in the Medical Waste Disposal Container report?
While the report offers comprehensive insights, it's advisable to review the specific contents or supplementary materials provided to ascertain if additional resources or data are available.
14. How can I stay updated on further developments or reports in the Medical Waste Disposal Container?
To stay informed about further developments, trends, and reports in the Medical Waste Disposal Container, consider subscribing to industry newsletters, following relevant companies and organizations, or regularly checking reputable industry news sources and publications.
Methodology
Step 1 - Identification of Relevant Samples Size from Population Database


Step 2 - Approaches for Defining Global Market Size (Value, Volume* & Price*)

Note*: In applicable scenarios
Step 3 - Data Sources
Primary Research
- Web Analytics
- Survey Reports
- Research Institute
- Latest Research Reports
- Opinion Leaders
Secondary Research
- Annual Reports
- White Paper
- Latest Press Release
- Industry Association
- Paid Database
- Investor Presentations

Step 4 - Data Triangulation
Involves using different sources of information in order to increase the validity of a study
These sources are likely to be stakeholders in a program - participants, other researchers, program staff, other community members, and so on.
Then we put all data in single framework & apply various statistical tools to find out the dynamic on the market.
During the analysis stage, feedback from the stakeholder groups would be compared to determine areas of agreement as well as areas of divergence