

Key Insights
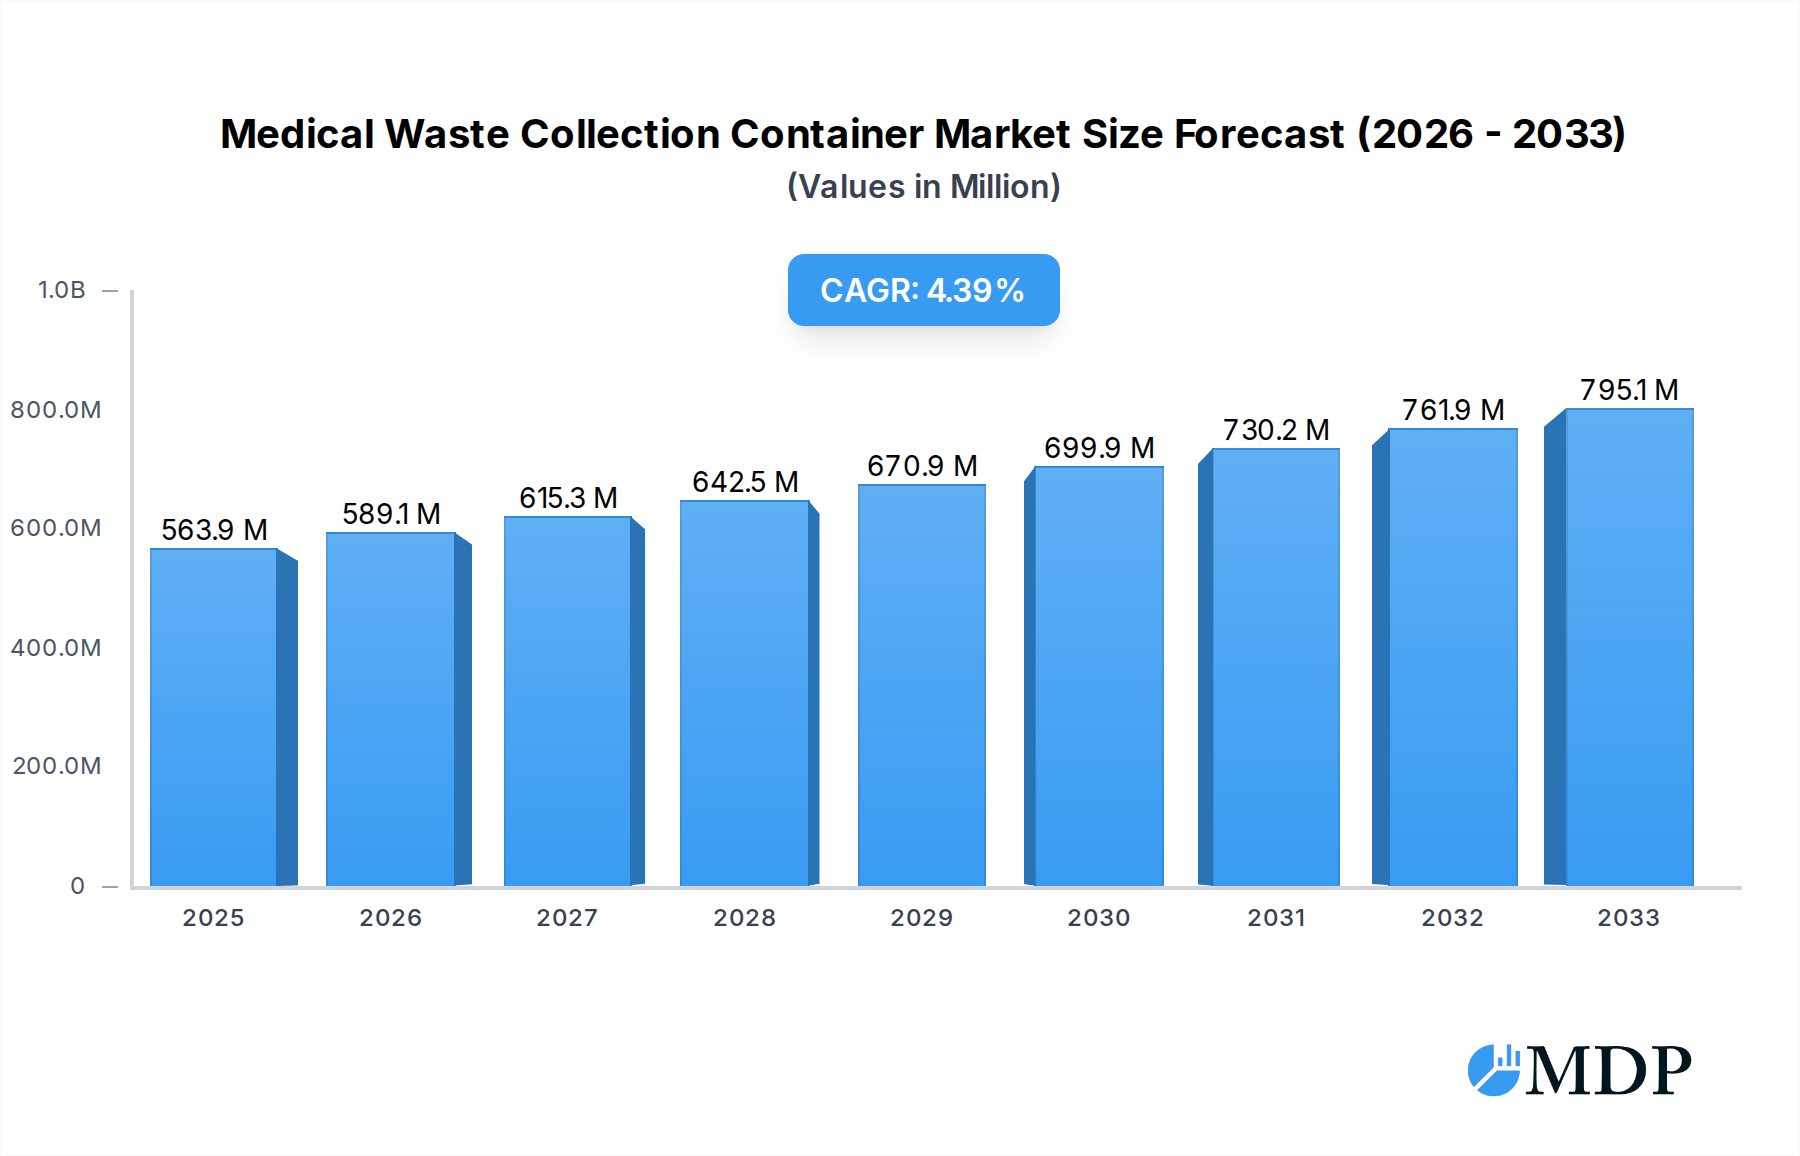
The global Medical Waste Collection Container market is poised for robust growth, projected to reach an estimated $563.85 million in 2025. This expansion is driven by a confluence of factors, including the escalating volume of healthcare-generated waste, increasing stringent regulations surrounding medical waste disposal, and a growing awareness among healthcare providers about the critical importance of safe and effective containment solutions. The 4.53% CAGR anticipated over the forecast period (2025-2033) underscores a sustained demand for reliable and compliant medical waste management. Key applications within hospitals and clinics are expected to remain the primary consumers, necessitating a continuous supply of secure sharps containers and biohazard waste containers. Emerging economies, with their rapidly developing healthcare infrastructure and increasing patient volumes, are also anticipated to contribute significantly to market expansion. Furthermore, technological advancements leading to more durable, leak-proof, and user-friendly container designs will further stimulate market penetration.

Medical Waste Collection Container Market Size (In Million)
The competitive landscape is characterized by a mix of established global players and emerging regional manufacturers, each vying for market share through product innovation, strategic partnerships, and cost-effective solutions. Companies like Cardinal Health, Stericycle, and Becton Dickinson are expected to maintain a strong presence, leveraging their extensive distribution networks and brand recognition. However, regional players such as Beijing BLGL and Shenyang Kangzhiyuan are gaining traction in their respective markets by offering specialized solutions tailored to local regulatory requirements and price sensitivities. The market is also witnessing a trend towards sustainable and environmentally friendly waste management practices, which may influence the development of novel container materials and disposal methods in the long term. Addressing the challenges associated with improper disposal, such as the risk of infection and environmental contamination, remains a paramount concern that fuels the demand for advanced medical waste collection containers.
Medical Waste Collection Container Company Market Share
Comprehensive Medical Waste Collection Container Market Report: Trends, Opportunities, and Leading Players (2019-2033)
This in-depth report offers a meticulous analysis of the global Medical Waste Collection Container market, providing actionable insights for industry stakeholders, manufacturers, distributors, and investors. Spanning the historical period of 2019–2024, the base year of 2025, and a comprehensive forecast period extending to 2033, this report details market dynamics, technological advancements, regulatory landscapes, and emerging opportunities. With an estimated market size projected to reach millions by 2025, this study is an indispensable resource for navigating the complexities and capitalizing on the growth potential of this vital sector.
Medical Waste Collection Container Market Dynamics & Concentration
The Medical Waste Collection Container market exhibits a moderate to high concentration, with key players such as Cardinal Health, Stericycle, and Becton Dickinson holding significant market share, estimated to be in the range of 30-40 million for the top three entities. Innovation drivers are primarily fueled by the increasing demand for enhanced safety features, improved containment solutions, and eco-friendly materials. Regulatory frameworks, particularly those focused on infectious waste management and sharps disposal, play a pivotal role in shaping market entry and product development. Product substitutes, while limited in terms of direct replacement for specialized containers, can include less regulated or reusable containment methods, though these are increasingly being phased out due to safety concerns. End-user trends are characterized by a growing emphasis on user convenience, cost-effectiveness, and compliance with stringent disposal protocols across healthcare facilities. Mergers and acquisitions (M&A) activities are a notable feature, with an estimated 5-10 significant deals annually, aimed at consolidating market presence, acquiring new technologies, and expanding geographical reach.
Medical Waste Collection Container Industry Trends & Analysis
The global Medical Waste Collection Container industry is poised for robust growth, driven by an escalating volume of healthcare waste generated worldwide. The increasing prevalence of chronic diseases, aging global populations, and a surge in diagnostic and treatment procedures are directly contributing to the demand for effective waste containment solutions. Technological disruptions are a key theme, with advancements in material science leading to the development of more durable, puncture-resistant, and leak-proof containers. Smart container technologies, incorporating features like fill level indicators and tamper-evident seals, are gaining traction, enhancing safety and traceability. Consumer preferences are shifting towards sustainable and environmentally friendly products, prompting manufacturers to explore biodegradable and recyclable materials without compromising on safety and regulatory compliance. Competitive dynamics are intensifying, with both established global players and emerging regional manufacturers vying for market share. The average annual growth rate (CAGR) for the market is projected to be between 6-8%, with market penetration expected to reach over 70% in developed economies by 2033. The increasing awareness regarding the health hazards associated with improper medical waste disposal is a significant catalyst for market expansion, driving demand across all segments.
Leading Markets & Segments in Medical Waste Collection Container
The Hospital segment dominates the Medical Waste Collection Container market, accounting for an estimated 50-60% of the global revenue. This dominance is driven by the high volume of diverse medical waste generated within these facilities, including sharps, biohazardous materials, and pathological waste. Strict regulatory mandates and the inherent risk of infection transmission necessitate the use of specialized and compliant collection containers. The Clinic segment represents the second-largest market, with a projected share of 25-35%, driven by the growing number of outpatient facilities and specialized medical centers. The Others segment, encompassing laboratories, research institutions, and home healthcare, is a rapidly expanding segment, expected to grow at a higher CAGR due to increasing decentralization of healthcare services.
Within the Types segmentation, Sharps Containers command the largest market share, estimated at 40-50%, due to their critical role in preventing needlestick injuries and the safe disposal of needles, syringes, and other sharp medical instruments. Biohazard Waste Containers follow closely, holding approximately 30-40% of the market, essential for the containment of infectious materials, contaminated items, and laboratory waste. The Others category, which includes specialized containers for chemotherapy waste, pharmaceutical waste, and general medical waste, is experiencing significant growth, driven by evolving waste management protocols and the increasing diversification of medical treatments. Key drivers for the dominance of these segments include stringent governmental regulations, the inherent safety risks associated with these waste types, and the availability of a wide range of specialized products tailored to specific containment needs. Economic policies supporting healthcare infrastructure development and robust waste management systems further bolster the market for these essential collection containers.
Medical Waste Collection Container Product Developments
Product development in the Medical Waste Collection Container market is heavily focused on enhancing user safety and environmental sustainability. Innovations include the introduction of self-sealing mechanisms, advanced puncture-resistant materials, and integrated tamper-evident closures to prevent unauthorized access and leakage. Biodegradable and recyclable container options are gaining traction, addressing growing environmental concerns. Many new products feature ergonomic designs for ease of handling and disposal, alongside improved visual indicators for fill levels. These advancements offer a competitive advantage by meeting the evolving demands for safer, more convenient, and eco-conscious medical waste management solutions.
Key Drivers of Medical Waste Collection Container Growth
The growth of the Medical Waste Collection Container market is propelled by several key factors. Stringent government regulations concerning the safe disposal of medical waste, particularly infectious and hazardous materials, are a primary driver. The increasing global burden of healthcare-associated infections and the need to prevent their spread further elevate the demand for compliant collection containers. Technological advancements in material science are enabling the development of more robust and safer containers. Furthermore, the expanding healthcare infrastructure, particularly in emerging economies, and the rising awareness among healthcare professionals and the public about the importance of proper waste management are significantly contributing to market expansion.
Challenges in the Medical Waste Collection Container Market
Despite the strong growth prospects, the Medical Waste Collection Container market faces several challenges. Stringent regulatory compliance across different regions can lead to high costs for manufacturers and hinder market entry for smaller players. Fluctuations in raw material prices, such as plastics and specialized resins, can impact profit margins. The logistical complexities and costs associated with the collection, transportation, and disposal of medical waste can also act as a restraint. Moreover, intense competition among established and new entrants, coupled with pricing pressures, can affect market profitability.
Emerging Opportunities in Medical Waste Collection Container
Emerging opportunities in the Medical Waste Collection Container market lie in the development of smart and connected container solutions that offer enhanced tracking and monitoring capabilities. The growing demand for sustainable and eco-friendly waste management practices presents significant opportunities for manufacturers focusing on biodegradable and recyclable materials. The expansion of healthcare services into remote and underserved areas, coupled with the rise of home healthcare, creates new markets for accessible and user-friendly collection containers. Strategic partnerships between container manufacturers and waste management service providers can also unlock synergistic growth opportunities.
Leading Players in the Medical Waste Collection Container Sector
- Cardinal Health
- Stericycle
- Becton Dickinson
- Daniels Health
- MedSharps
- AdirMed
- Bondtech
- Sharps Compliance
- EnviroTain
- Henry Schein
- Beijing BLGL
- Shenyang Kangzhiyuan
- Jiangxi Lvya
Key Milestones in Medical Waste Collection Container Industry
- 2019: Increased adoption of needleless injection systems, driving innovation in sharps container design.
- 2020: Global pandemic heightens awareness and demand for biohazard waste containment.
- 2021: Introduction of advanced puncture-resistant polymer materials for sharps containers.
- 2022: Growing emphasis on sustainability leads to the development of pilot programs for biodegradable medical waste containers.
- 2023: Regulatory updates in several key regions mandate stricter disposal protocols for specific medical waste streams.
- 2024: Advancements in smart container technology, including RFID integration for improved traceability, begin to gain market traction.
Strategic Outlook for Medical Waste Collection Container Market
The strategic outlook for the Medical Waste Collection Container market is highly positive, characterized by sustained growth driven by increasing healthcare expenditures, evolving regulatory landscapes, and technological advancements. Future market success will hinge on a company's ability to innovate in areas of safety, sustainability, and cost-effectiveness. Strategic collaborations with healthcare providers and waste management firms will be crucial for expanding market reach and developing comprehensive waste management solutions. Companies that prioritize the development of eco-friendly alternatives and smart container technologies are well-positioned to capture significant market share in the coming years, ensuring both environmental responsibility and commercial success.
Medical Waste Collection Container Segmentation
-
1. Application
- 1.1. Hospital
- 1.2. Clinic
- 1.3. Others
-
2. Types
- 2.1. Sharps Containers
- 2.2. Biohazard Waste Containers
- 2.3. Others
Medical Waste Collection Container Segmentation By Geography
-
1. North America
- 1.1. United States
- 1.2. Canada
- 1.3. Mexico
-
2. South America
- 2.1. Brazil
- 2.2. Argentina
- 2.3. Rest of South America
-
3. Europe
- 3.1. United Kingdom
- 3.2. Germany
- 3.3. France
- 3.4. Italy
- 3.5. Spain
- 3.6. Russia
- 3.7. Benelux
- 3.8. Nordics
- 3.9. Rest of Europe
-
4. Middle East & Africa
- 4.1. Turkey
- 4.2. Israel
- 4.3. GCC
- 4.4. North Africa
- 4.5. South Africa
- 4.6. Rest of Middle East & Africa
-
5. Asia Pacific
- 5.1. China
- 5.2. India
- 5.3. Japan
- 5.4. South Korea
- 5.5. ASEAN
- 5.6. Oceania
- 5.7. Rest of Asia Pacific
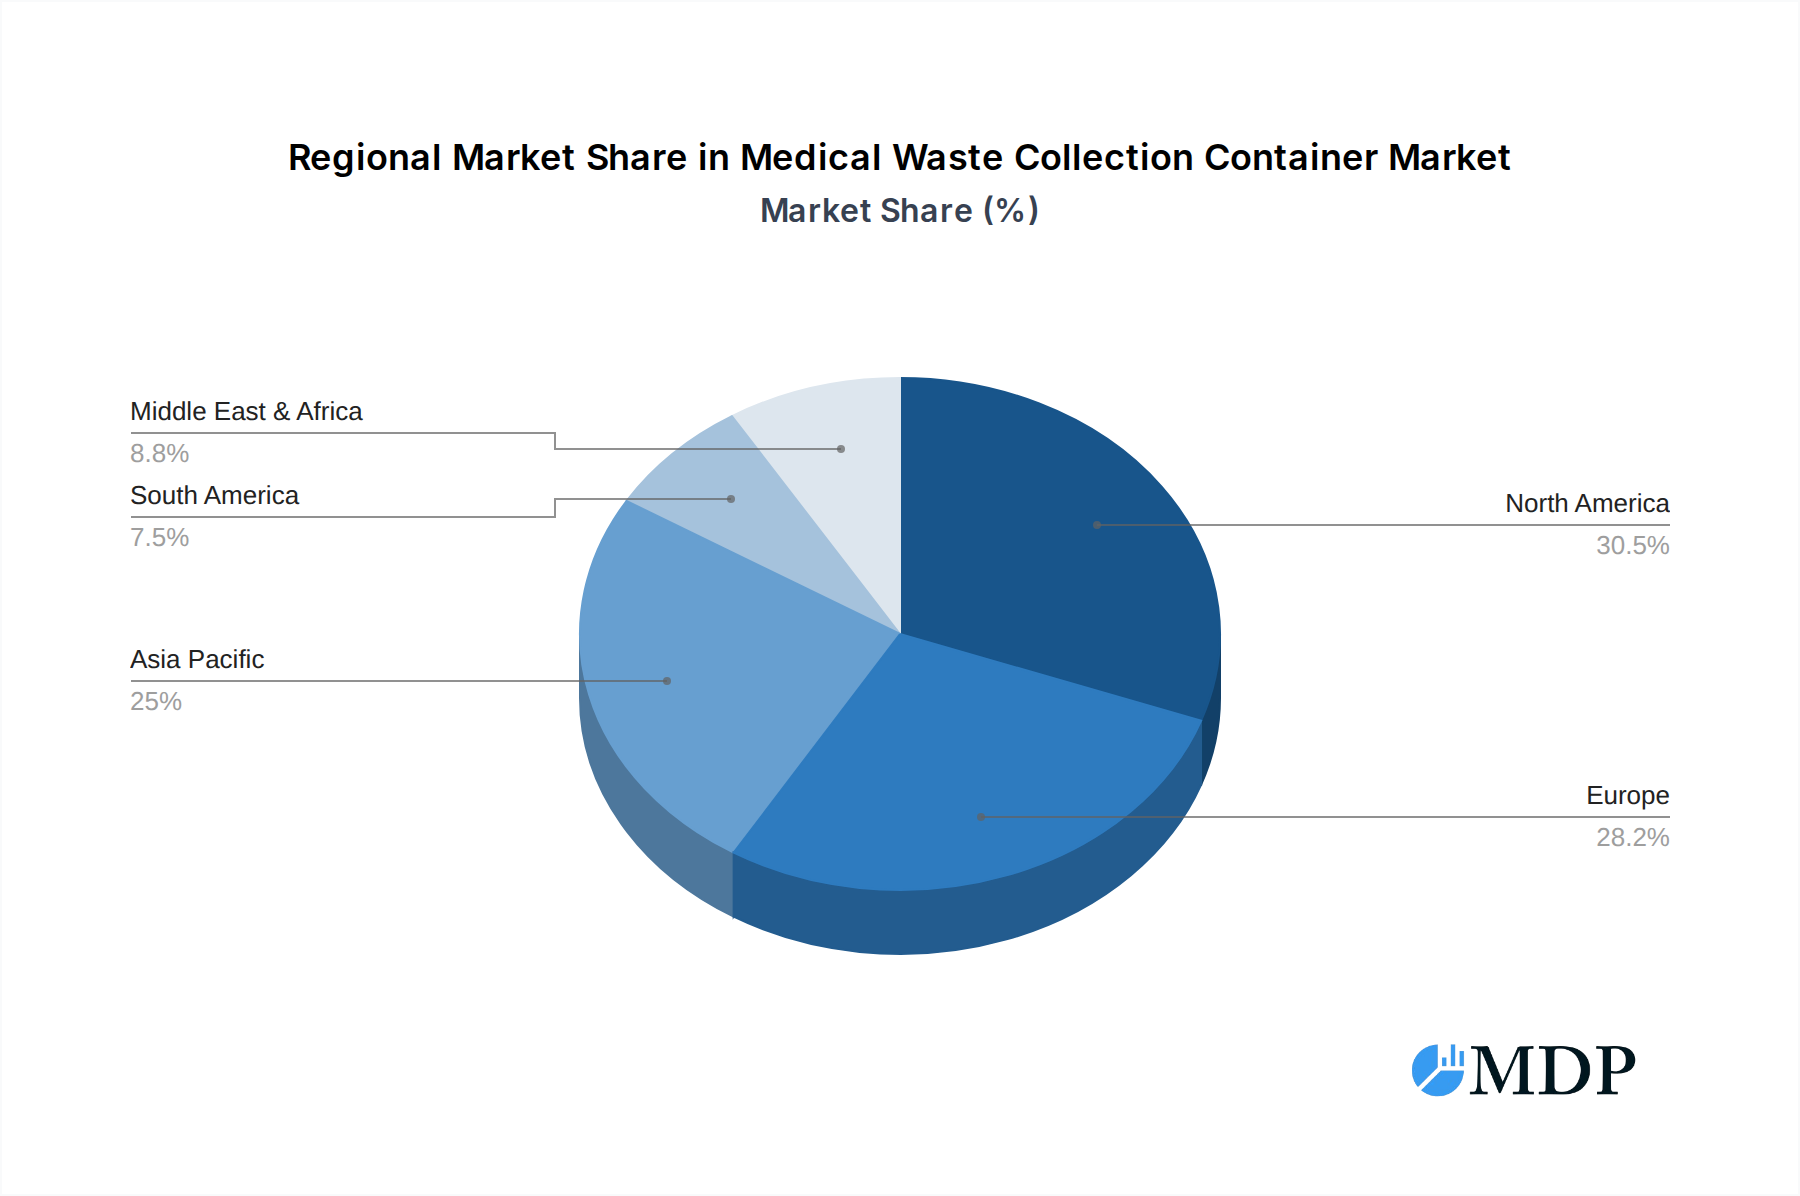
Medical Waste Collection Container Regional Market Share
Geographic Coverage of Medical Waste Collection Container
Medical Waste Collection Container REPORT HIGHLIGHTS
| Aspects | Details |
|---|---|
| Study Period | 2020-2034 |
| Base Year | 2025 |
| Estimated Year | 2026 |
| Forecast Period | 2026-2034 |
| Historical Period | 2020-2025 |
| Growth Rate | CAGR of 4.53% from 2020-2034 |
| Segmentation |
|
Table of Contents
- 1. Introduction
- 1.1. Research Scope
- 1.2. Market Segmentation
- 1.3. Research Methodology
- 1.4. Definitions and Assumptions
- 2. Executive Summary
- 2.1. Introduction
- 3. Market Dynamics
- 3.1. Introduction
- 3.2. Market Drivers
- 3.3. Market Restrains
- 3.4. Market Trends
- 4. Market Factor Analysis
- 4.1. Porters Five Forces
- 4.2. Supply/Value Chain
- 4.3. PESTEL analysis
- 4.4. Market Entropy
- 4.5. Patent/Trademark Analysis
- 5. Global Medical Waste Collection Container Analysis, Insights and Forecast, 2020-2032
- 5.1. Market Analysis, Insights and Forecast - by Application
- 5.1.1. Hospital
- 5.1.2. Clinic
- 5.1.3. Others
- 5.2. Market Analysis, Insights and Forecast - by Types
- 5.2.1. Sharps Containers
- 5.2.2. Biohazard Waste Containers
- 5.2.3. Others
- 5.3. Market Analysis, Insights and Forecast - by Region
- 5.3.1. North America
- 5.3.2. South America
- 5.3.3. Europe
- 5.3.4. Middle East & Africa
- 5.3.5. Asia Pacific
- 5.1. Market Analysis, Insights and Forecast - by Application
- 6. North America Medical Waste Collection Container Analysis, Insights and Forecast, 2020-2032
- 6.1. Market Analysis, Insights and Forecast - by Application
- 6.1.1. Hospital
- 6.1.2. Clinic
- 6.1.3. Others
- 6.2. Market Analysis, Insights and Forecast - by Types
- 6.2.1. Sharps Containers
- 6.2.2. Biohazard Waste Containers
- 6.2.3. Others
- 6.1. Market Analysis, Insights and Forecast - by Application
- 7. South America Medical Waste Collection Container Analysis, Insights and Forecast, 2020-2032
- 7.1. Market Analysis, Insights and Forecast - by Application
- 7.1.1. Hospital
- 7.1.2. Clinic
- 7.1.3. Others
- 7.2. Market Analysis, Insights and Forecast - by Types
- 7.2.1. Sharps Containers
- 7.2.2. Biohazard Waste Containers
- 7.2.3. Others
- 7.1. Market Analysis, Insights and Forecast - by Application
- 8. Europe Medical Waste Collection Container Analysis, Insights and Forecast, 2020-2032
- 8.1. Market Analysis, Insights and Forecast - by Application
- 8.1.1. Hospital
- 8.1.2. Clinic
- 8.1.3. Others
- 8.2. Market Analysis, Insights and Forecast - by Types
- 8.2.1. Sharps Containers
- 8.2.2. Biohazard Waste Containers
- 8.2.3. Others
- 8.1. Market Analysis, Insights and Forecast - by Application
- 9. Middle East & Africa Medical Waste Collection Container Analysis, Insights and Forecast, 2020-2032
- 9.1. Market Analysis, Insights and Forecast - by Application
- 9.1.1. Hospital
- 9.1.2. Clinic
- 9.1.3. Others
- 9.2. Market Analysis, Insights and Forecast - by Types
- 9.2.1. Sharps Containers
- 9.2.2. Biohazard Waste Containers
- 9.2.3. Others
- 9.1. Market Analysis, Insights and Forecast - by Application
- 10. Asia Pacific Medical Waste Collection Container Analysis, Insights and Forecast, 2020-2032
- 10.1. Market Analysis, Insights and Forecast - by Application
- 10.1.1. Hospital
- 10.1.2. Clinic
- 10.1.3. Others
- 10.2. Market Analysis, Insights and Forecast - by Types
- 10.2.1. Sharps Containers
- 10.2.2. Biohazard Waste Containers
- 10.2.3. Others
- 10.1. Market Analysis, Insights and Forecast - by Application
- 11. Competitive Analysis
- 11.1. Global Market Share Analysis 2025
- 11.2. Company Profiles
- 11.2.1 Cardinal Health
- 11.2.1.1. Overview
- 11.2.1.2. Products
- 11.2.1.3. SWOT Analysis
- 11.2.1.4. Recent Developments
- 11.2.1.5. Financials (Based on Availability)
- 11.2.2 Stericycle
- 11.2.2.1. Overview
- 11.2.2.2. Products
- 11.2.2.3. SWOT Analysis
- 11.2.2.4. Recent Developments
- 11.2.2.5. Financials (Based on Availability)
- 11.2.3 Becton Dickinson
- 11.2.3.1. Overview
- 11.2.3.2. Products
- 11.2.3.3. SWOT Analysis
- 11.2.3.4. Recent Developments
- 11.2.3.5. Financials (Based on Availability)
- 11.2.4 Daniels Health
- 11.2.4.1. Overview
- 11.2.4.2. Products
- 11.2.4.3. SWOT Analysis
- 11.2.4.4. Recent Developments
- 11.2.4.5. Financials (Based on Availability)
- 11.2.5 MedSharps
- 11.2.5.1. Overview
- 11.2.5.2. Products
- 11.2.5.3. SWOT Analysis
- 11.2.5.4. Recent Developments
- 11.2.5.5. Financials (Based on Availability)
- 11.2.6 AdirMed
- 11.2.6.1. Overview
- 11.2.6.2. Products
- 11.2.6.3. SWOT Analysis
- 11.2.6.4. Recent Developments
- 11.2.6.5. Financials (Based on Availability)
- 11.2.7 Bondtech
- 11.2.7.1. Overview
- 11.2.7.2. Products
- 11.2.7.3. SWOT Analysis
- 11.2.7.4. Recent Developments
- 11.2.7.5. Financials (Based on Availability)
- 11.2.8 Sharps Compliance
- 11.2.8.1. Overview
- 11.2.8.2. Products
- 11.2.8.3. SWOT Analysis
- 11.2.8.4. Recent Developments
- 11.2.8.5. Financials (Based on Availability)
- 11.2.9 EnviroTain
- 11.2.9.1. Overview
- 11.2.9.2. Products
- 11.2.9.3. SWOT Analysis
- 11.2.9.4. Recent Developments
- 11.2.9.5. Financials (Based on Availability)
- 11.2.10 Henry Schein
- 11.2.10.1. Overview
- 11.2.10.2. Products
- 11.2.10.3. SWOT Analysis
- 11.2.10.4. Recent Developments
- 11.2.10.5. Financials (Based on Availability)
- 11.2.11 Beijing BLGL
- 11.2.11.1. Overview
- 11.2.11.2. Products
- 11.2.11.3. SWOT Analysis
- 11.2.11.4. Recent Developments
- 11.2.11.5. Financials (Based on Availability)
- 11.2.12 Shenyang Kangzhiyuan
- 11.2.12.1. Overview
- 11.2.12.2. Products
- 11.2.12.3. SWOT Analysis
- 11.2.12.4. Recent Developments
- 11.2.12.5. Financials (Based on Availability)
- 11.2.13 Jiangxi Lvya
- 11.2.13.1. Overview
- 11.2.13.2. Products
- 11.2.13.3. SWOT Analysis
- 11.2.13.4. Recent Developments
- 11.2.13.5. Financials (Based on Availability)
- 11.2.1 Cardinal Health
List of Figures
- Figure 1: Global Medical Waste Collection Container Revenue Breakdown (undefined, %) by Region 2025 & 2033
- Figure 2: Global Medical Waste Collection Container Volume Breakdown (K, %) by Region 2025 & 2033
- Figure 3: North America Medical Waste Collection Container Revenue (undefined), by Application 2025 & 2033
- Figure 4: North America Medical Waste Collection Container Volume (K), by Application 2025 & 2033
- Figure 5: North America Medical Waste Collection Container Revenue Share (%), by Application 2025 & 2033
- Figure 6: North America Medical Waste Collection Container Volume Share (%), by Application 2025 & 2033
- Figure 7: North America Medical Waste Collection Container Revenue (undefined), by Types 2025 & 2033
- Figure 8: North America Medical Waste Collection Container Volume (K), by Types 2025 & 2033
- Figure 9: North America Medical Waste Collection Container Revenue Share (%), by Types 2025 & 2033
- Figure 10: North America Medical Waste Collection Container Volume Share (%), by Types 2025 & 2033
- Figure 11: North America Medical Waste Collection Container Revenue (undefined), by Country 2025 & 2033
- Figure 12: North America Medical Waste Collection Container Volume (K), by Country 2025 & 2033
- Figure 13: North America Medical Waste Collection Container Revenue Share (%), by Country 2025 & 2033
- Figure 14: North America Medical Waste Collection Container Volume Share (%), by Country 2025 & 2033
- Figure 15: South America Medical Waste Collection Container Revenue (undefined), by Application 2025 & 2033
- Figure 16: South America Medical Waste Collection Container Volume (K), by Application 2025 & 2033
- Figure 17: South America Medical Waste Collection Container Revenue Share (%), by Application 2025 & 2033
- Figure 18: South America Medical Waste Collection Container Volume Share (%), by Application 2025 & 2033
- Figure 19: South America Medical Waste Collection Container Revenue (undefined), by Types 2025 & 2033
- Figure 20: South America Medical Waste Collection Container Volume (K), by Types 2025 & 2033
- Figure 21: South America Medical Waste Collection Container Revenue Share (%), by Types 2025 & 2033
- Figure 22: South America Medical Waste Collection Container Volume Share (%), by Types 2025 & 2033
- Figure 23: South America Medical Waste Collection Container Revenue (undefined), by Country 2025 & 2033
- Figure 24: South America Medical Waste Collection Container Volume (K), by Country 2025 & 2033
- Figure 25: South America Medical Waste Collection Container Revenue Share (%), by Country 2025 & 2033
- Figure 26: South America Medical Waste Collection Container Volume Share (%), by Country 2025 & 2033
- Figure 27: Europe Medical Waste Collection Container Revenue (undefined), by Application 2025 & 2033
- Figure 28: Europe Medical Waste Collection Container Volume (K), by Application 2025 & 2033
- Figure 29: Europe Medical Waste Collection Container Revenue Share (%), by Application 2025 & 2033
- Figure 30: Europe Medical Waste Collection Container Volume Share (%), by Application 2025 & 2033
- Figure 31: Europe Medical Waste Collection Container Revenue (undefined), by Types 2025 & 2033
- Figure 32: Europe Medical Waste Collection Container Volume (K), by Types 2025 & 2033
- Figure 33: Europe Medical Waste Collection Container Revenue Share (%), by Types 2025 & 2033
- Figure 34: Europe Medical Waste Collection Container Volume Share (%), by Types 2025 & 2033
- Figure 35: Europe Medical Waste Collection Container Revenue (undefined), by Country 2025 & 2033
- Figure 36: Europe Medical Waste Collection Container Volume (K), by Country 2025 & 2033
- Figure 37: Europe Medical Waste Collection Container Revenue Share (%), by Country 2025 & 2033
- Figure 38: Europe Medical Waste Collection Container Volume Share (%), by Country 2025 & 2033
- Figure 39: Middle East & Africa Medical Waste Collection Container Revenue (undefined), by Application 2025 & 2033
- Figure 40: Middle East & Africa Medical Waste Collection Container Volume (K), by Application 2025 & 2033
- Figure 41: Middle East & Africa Medical Waste Collection Container Revenue Share (%), by Application 2025 & 2033
- Figure 42: Middle East & Africa Medical Waste Collection Container Volume Share (%), by Application 2025 & 2033
- Figure 43: Middle East & Africa Medical Waste Collection Container Revenue (undefined), by Types 2025 & 2033
- Figure 44: Middle East & Africa Medical Waste Collection Container Volume (K), by Types 2025 & 2033
- Figure 45: Middle East & Africa Medical Waste Collection Container Revenue Share (%), by Types 2025 & 2033
- Figure 46: Middle East & Africa Medical Waste Collection Container Volume Share (%), by Types 2025 & 2033
- Figure 47: Middle East & Africa Medical Waste Collection Container Revenue (undefined), by Country 2025 & 2033
- Figure 48: Middle East & Africa Medical Waste Collection Container Volume (K), by Country 2025 & 2033
- Figure 49: Middle East & Africa Medical Waste Collection Container Revenue Share (%), by Country 2025 & 2033
- Figure 50: Middle East & Africa Medical Waste Collection Container Volume Share (%), by Country 2025 & 2033
- Figure 51: Asia Pacific Medical Waste Collection Container Revenue (undefined), by Application 2025 & 2033
- Figure 52: Asia Pacific Medical Waste Collection Container Volume (K), by Application 2025 & 2033
- Figure 53: Asia Pacific Medical Waste Collection Container Revenue Share (%), by Application 2025 & 2033
- Figure 54: Asia Pacific Medical Waste Collection Container Volume Share (%), by Application 2025 & 2033
- Figure 55: Asia Pacific Medical Waste Collection Container Revenue (undefined), by Types 2025 & 2033
- Figure 56: Asia Pacific Medical Waste Collection Container Volume (K), by Types 2025 & 2033
- Figure 57: Asia Pacific Medical Waste Collection Container Revenue Share (%), by Types 2025 & 2033
- Figure 58: Asia Pacific Medical Waste Collection Container Volume Share (%), by Types 2025 & 2033
- Figure 59: Asia Pacific Medical Waste Collection Container Revenue (undefined), by Country 2025 & 2033
- Figure 60: Asia Pacific Medical Waste Collection Container Volume (K), by Country 2025 & 2033
- Figure 61: Asia Pacific Medical Waste Collection Container Revenue Share (%), by Country 2025 & 2033
- Figure 62: Asia Pacific Medical Waste Collection Container Volume Share (%), by Country 2025 & 2033
List of Tables
- Table 1: Global Medical Waste Collection Container Revenue undefined Forecast, by Application 2020 & 2033
- Table 2: Global Medical Waste Collection Container Volume K Forecast, by Application 2020 & 2033
- Table 3: Global Medical Waste Collection Container Revenue undefined Forecast, by Types 2020 & 2033
- Table 4: Global Medical Waste Collection Container Volume K Forecast, by Types 2020 & 2033
- Table 5: Global Medical Waste Collection Container Revenue undefined Forecast, by Region 2020 & 2033
- Table 6: Global Medical Waste Collection Container Volume K Forecast, by Region 2020 & 2033
- Table 7: Global Medical Waste Collection Container Revenue undefined Forecast, by Application 2020 & 2033
- Table 8: Global Medical Waste Collection Container Volume K Forecast, by Application 2020 & 2033
- Table 9: Global Medical Waste Collection Container Revenue undefined Forecast, by Types 2020 & 2033
- Table 10: Global Medical Waste Collection Container Volume K Forecast, by Types 2020 & 2033
- Table 11: Global Medical Waste Collection Container Revenue undefined Forecast, by Country 2020 & 2033
- Table 12: Global Medical Waste Collection Container Volume K Forecast, by Country 2020 & 2033
- Table 13: United States Medical Waste Collection Container Revenue (undefined) Forecast, by Application 2020 & 2033
- Table 14: United States Medical Waste Collection Container Volume (K) Forecast, by Application 2020 & 2033
- Table 15: Canada Medical Waste Collection Container Revenue (undefined) Forecast, by Application 2020 & 2033
- Table 16: Canada Medical Waste Collection Container Volume (K) Forecast, by Application 2020 & 2033
- Table 17: Mexico Medical Waste Collection Container Revenue (undefined) Forecast, by Application 2020 & 2033
- Table 18: Mexico Medical Waste Collection Container Volume (K) Forecast, by Application 2020 & 2033
- Table 19: Global Medical Waste Collection Container Revenue undefined Forecast, by Application 2020 & 2033
- Table 20: Global Medical Waste Collection Container Volume K Forecast, by Application 2020 & 2033
- Table 21: Global Medical Waste Collection Container Revenue undefined Forecast, by Types 2020 & 2033
- Table 22: Global Medical Waste Collection Container Volume K Forecast, by Types 2020 & 2033
- Table 23: Global Medical Waste Collection Container Revenue undefined Forecast, by Country 2020 & 2033
- Table 24: Global Medical Waste Collection Container Volume K Forecast, by Country 2020 & 2033
- Table 25: Brazil Medical Waste Collection Container Revenue (undefined) Forecast, by Application 2020 & 2033
- Table 26: Brazil Medical Waste Collection Container Volume (K) Forecast, by Application 2020 & 2033
- Table 27: Argentina Medical Waste Collection Container Revenue (undefined) Forecast, by Application 2020 & 2033
- Table 28: Argentina Medical Waste Collection Container Volume (K) Forecast, by Application 2020 & 2033
- Table 29: Rest of South America Medical Waste Collection Container Revenue (undefined) Forecast, by Application 2020 & 2033
- Table 30: Rest of South America Medical Waste Collection Container Volume (K) Forecast, by Application 2020 & 2033
- Table 31: Global Medical Waste Collection Container Revenue undefined Forecast, by Application 2020 & 2033
- Table 32: Global Medical Waste Collection Container Volume K Forecast, by Application 2020 & 2033
- Table 33: Global Medical Waste Collection Container Revenue undefined Forecast, by Types 2020 & 2033
- Table 34: Global Medical Waste Collection Container Volume K Forecast, by Types 2020 & 2033
- Table 35: Global Medical Waste Collection Container Revenue undefined Forecast, by Country 2020 & 2033
- Table 36: Global Medical Waste Collection Container Volume K Forecast, by Country 2020 & 2033
- Table 37: United Kingdom Medical Waste Collection Container Revenue (undefined) Forecast, by Application 2020 & 2033
- Table 38: United Kingdom Medical Waste Collection Container Volume (K) Forecast, by Application 2020 & 2033
- Table 39: Germany Medical Waste Collection Container Revenue (undefined) Forecast, by Application 2020 & 2033
- Table 40: Germany Medical Waste Collection Container Volume (K) Forecast, by Application 2020 & 2033
- Table 41: France Medical Waste Collection Container Revenue (undefined) Forecast, by Application 2020 & 2033
- Table 42: France Medical Waste Collection Container Volume (K) Forecast, by Application 2020 & 2033
- Table 43: Italy Medical Waste Collection Container Revenue (undefined) Forecast, by Application 2020 & 2033
- Table 44: Italy Medical Waste Collection Container Volume (K) Forecast, by Application 2020 & 2033
- Table 45: Spain Medical Waste Collection Container Revenue (undefined) Forecast, by Application 2020 & 2033
- Table 46: Spain Medical Waste Collection Container Volume (K) Forecast, by Application 2020 & 2033
- Table 47: Russia Medical Waste Collection Container Revenue (undefined) Forecast, by Application 2020 & 2033
- Table 48: Russia Medical Waste Collection Container Volume (K) Forecast, by Application 2020 & 2033
- Table 49: Benelux Medical Waste Collection Container Revenue (undefined) Forecast, by Application 2020 & 2033
- Table 50: Benelux Medical Waste Collection Container Volume (K) Forecast, by Application 2020 & 2033
- Table 51: Nordics Medical Waste Collection Container Revenue (undefined) Forecast, by Application 2020 & 2033
- Table 52: Nordics Medical Waste Collection Container Volume (K) Forecast, by Application 2020 & 2033
- Table 53: Rest of Europe Medical Waste Collection Container Revenue (undefined) Forecast, by Application 2020 & 2033
- Table 54: Rest of Europe Medical Waste Collection Container Volume (K) Forecast, by Application 2020 & 2033
- Table 55: Global Medical Waste Collection Container Revenue undefined Forecast, by Application 2020 & 2033
- Table 56: Global Medical Waste Collection Container Volume K Forecast, by Application 2020 & 2033
- Table 57: Global Medical Waste Collection Container Revenue undefined Forecast, by Types 2020 & 2033
- Table 58: Global Medical Waste Collection Container Volume K Forecast, by Types 2020 & 2033
- Table 59: Global Medical Waste Collection Container Revenue undefined Forecast, by Country 2020 & 2033
- Table 60: Global Medical Waste Collection Container Volume K Forecast, by Country 2020 & 2033
- Table 61: Turkey Medical Waste Collection Container Revenue (undefined) Forecast, by Application 2020 & 2033
- Table 62: Turkey Medical Waste Collection Container Volume (K) Forecast, by Application 2020 & 2033
- Table 63: Israel Medical Waste Collection Container Revenue (undefined) Forecast, by Application 2020 & 2033
- Table 64: Israel Medical Waste Collection Container Volume (K) Forecast, by Application 2020 & 2033
- Table 65: GCC Medical Waste Collection Container Revenue (undefined) Forecast, by Application 2020 & 2033
- Table 66: GCC Medical Waste Collection Container Volume (K) Forecast, by Application 2020 & 2033
- Table 67: North Africa Medical Waste Collection Container Revenue (undefined) Forecast, by Application 2020 & 2033
- Table 68: North Africa Medical Waste Collection Container Volume (K) Forecast, by Application 2020 & 2033
- Table 69: South Africa Medical Waste Collection Container Revenue (undefined) Forecast, by Application 2020 & 2033
- Table 70: South Africa Medical Waste Collection Container Volume (K) Forecast, by Application 2020 & 2033
- Table 71: Rest of Middle East & Africa Medical Waste Collection Container Revenue (undefined) Forecast, by Application 2020 & 2033
- Table 72: Rest of Middle East & Africa Medical Waste Collection Container Volume (K) Forecast, by Application 2020 & 2033
- Table 73: Global Medical Waste Collection Container Revenue undefined Forecast, by Application 2020 & 2033
- Table 74: Global Medical Waste Collection Container Volume K Forecast, by Application 2020 & 2033
- Table 75: Global Medical Waste Collection Container Revenue undefined Forecast, by Types 2020 & 2033
- Table 76: Global Medical Waste Collection Container Volume K Forecast, by Types 2020 & 2033
- Table 77: Global Medical Waste Collection Container Revenue undefined Forecast, by Country 2020 & 2033
- Table 78: Global Medical Waste Collection Container Volume K Forecast, by Country 2020 & 2033
- Table 79: China Medical Waste Collection Container Revenue (undefined) Forecast, by Application 2020 & 2033
- Table 80: China Medical Waste Collection Container Volume (K) Forecast, by Application 2020 & 2033
- Table 81: India Medical Waste Collection Container Revenue (undefined) Forecast, by Application 2020 & 2033
- Table 82: India Medical Waste Collection Container Volume (K) Forecast, by Application 2020 & 2033
- Table 83: Japan Medical Waste Collection Container Revenue (undefined) Forecast, by Application 2020 & 2033
- Table 84: Japan Medical Waste Collection Container Volume (K) Forecast, by Application 2020 & 2033
- Table 85: South Korea Medical Waste Collection Container Revenue (undefined) Forecast, by Application 2020 & 2033
- Table 86: South Korea Medical Waste Collection Container Volume (K) Forecast, by Application 2020 & 2033
- Table 87: ASEAN Medical Waste Collection Container Revenue (undefined) Forecast, by Application 2020 & 2033
- Table 88: ASEAN Medical Waste Collection Container Volume (K) Forecast, by Application 2020 & 2033
- Table 89: Oceania Medical Waste Collection Container Revenue (undefined) Forecast, by Application 2020 & 2033
- Table 90: Oceania Medical Waste Collection Container Volume (K) Forecast, by Application 2020 & 2033
- Table 91: Rest of Asia Pacific Medical Waste Collection Container Revenue (undefined) Forecast, by Application 2020 & 2033
- Table 92: Rest of Asia Pacific Medical Waste Collection Container Volume (K) Forecast, by Application 2020 & 2033
Frequently Asked Questions
1. What is the projected Compound Annual Growth Rate (CAGR) of the Medical Waste Collection Container?
The projected CAGR is approximately 4.53%.
2. Which companies are prominent players in the Medical Waste Collection Container?
Key companies in the market include Cardinal Health, Stericycle, Becton Dickinson, Daniels Health, MedSharps, AdirMed, Bondtech, Sharps Compliance, EnviroTain, Henry Schein, Beijing BLGL, Shenyang Kangzhiyuan, Jiangxi Lvya.
3. What are the main segments of the Medical Waste Collection Container?
The market segments include Application, Types.
4. Can you provide details about the market size?
The market size is estimated to be USD XXX N/A as of 2022.
5. What are some drivers contributing to market growth?
N/A
6. What are the notable trends driving market growth?
N/A
7. Are there any restraints impacting market growth?
N/A
8. Can you provide examples of recent developments in the market?
N/A
9. What pricing options are available for accessing the report?
Pricing options include single-user, multi-user, and enterprise licenses priced at USD 3350.00, USD 5025.00, and USD 6700.00 respectively.
10. Is the market size provided in terms of value or volume?
The market size is provided in terms of value, measured in N/A and volume, measured in K.
11. Are there any specific market keywords associated with the report?
Yes, the market keyword associated with the report is "Medical Waste Collection Container," which aids in identifying and referencing the specific market segment covered.
12. How do I determine which pricing option suits my needs best?
The pricing options vary based on user requirements and access needs. Individual users may opt for single-user licenses, while businesses requiring broader access may choose multi-user or enterprise licenses for cost-effective access to the report.
13. Are there any additional resources or data provided in the Medical Waste Collection Container report?
While the report offers comprehensive insights, it's advisable to review the specific contents or supplementary materials provided to ascertain if additional resources or data are available.
14. How can I stay updated on further developments or reports in the Medical Waste Collection Container?
To stay informed about further developments, trends, and reports in the Medical Waste Collection Container, consider subscribing to industry newsletters, following relevant companies and organizations, or regularly checking reputable industry news sources and publications.
Methodology
Step 1 - Identification of Relevant Samples Size from Population Database


Step 2 - Approaches for Defining Global Market Size (Value, Volume* & Price*)

Note*: In applicable scenarios
Step 3 - Data Sources
Primary Research
- Web Analytics
- Survey Reports
- Research Institute
- Latest Research Reports
- Opinion Leaders
Secondary Research
- Annual Reports
- White Paper
- Latest Press Release
- Industry Association
- Paid Database
- Investor Presentations

Step 4 - Data Triangulation
Involves using different sources of information in order to increase the validity of a study
These sources are likely to be stakeholders in a program - participants, other researchers, program staff, other community members, and so on.
Then we put all data in single framework & apply various statistical tools to find out the dynamic on the market.
During the analysis stage, feedback from the stakeholder groups would be compared to determine areas of agreement as well as areas of divergence