

Key Insights
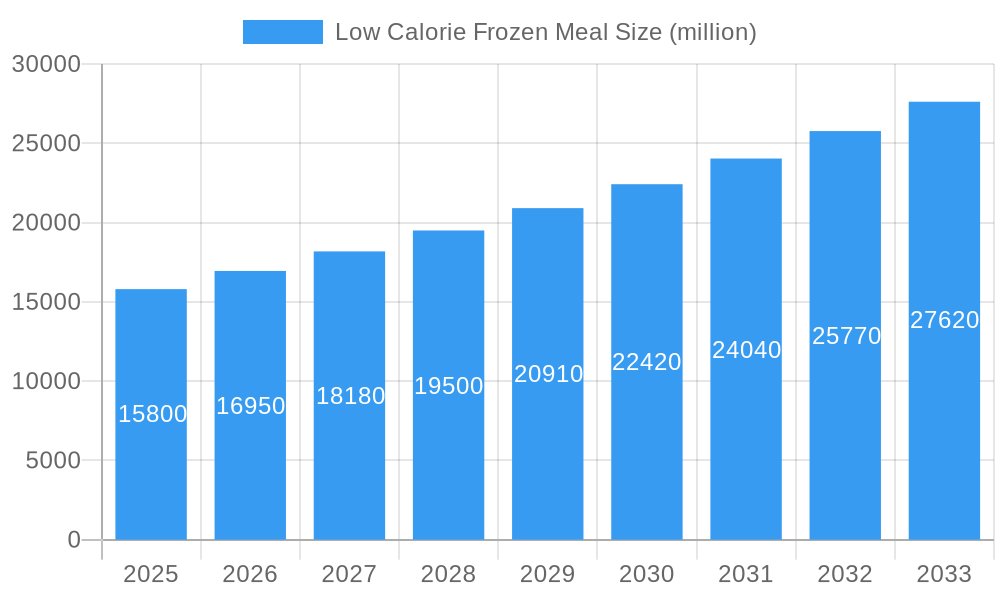
The global Low Calorie Frozen Meal market is poised for significant expansion, projected to reach an estimated market size of approximately $15.8 billion by 2025, with a robust Compound Annual Growth Rate (CAGR) of around 7.2% expected throughout the forecast period of 2025-2033. This growth is largely propelled by increasing consumer demand for convenient, health-conscious food options. The rising prevalence of lifestyle diseases, coupled with a greater awareness of dietary impacts on well-being, is driving consumers towards pre-portioned, calorie-controlled meals. Key market drivers include the growing adoption of frozen meals among busy professionals and families seeking quick yet nutritious meal solutions, the expanding retail infrastructure, and the significant growth of online grocery platforms that enhance accessibility to these products. Furthermore, a growing segment of the population actively monitors their calorie intake for weight management or fitness goals, directly fueling the demand for low-calorie frozen meals within the 300-400 calorie range.
Low Calorie Frozen Meal Market Size (In Billion)
The market's trajectory is further shaped by evolving consumer preferences, with a notable trend towards "clean label" products, featuring natural ingredients and minimal processing. This has spurred innovation among manufacturers, leading to a wider variety of low-calorie frozen meal options catering to diverse dietary needs and preferences, including plant-based and gluten-free varieties. While the market is on an upward swing, potential restraints include consumer perceptions of frozen foods being less fresh or flavorful than their chilled counterparts, and the ongoing price sensitivity of some consumer segments. However, advancements in freezing technology and product formulation are steadily addressing these concerns. The market is segmented by application, with retail stores and supermarkets forming the dominant distribution channels, though internet sales are experiencing rapid growth. Geographically, North America and Europe are leading markets, driven by established health consciousness and a strong presence of key players, while the Asia Pacific region presents substantial untapped growth potential due to its burgeoning middle class and increasing disposable incomes.
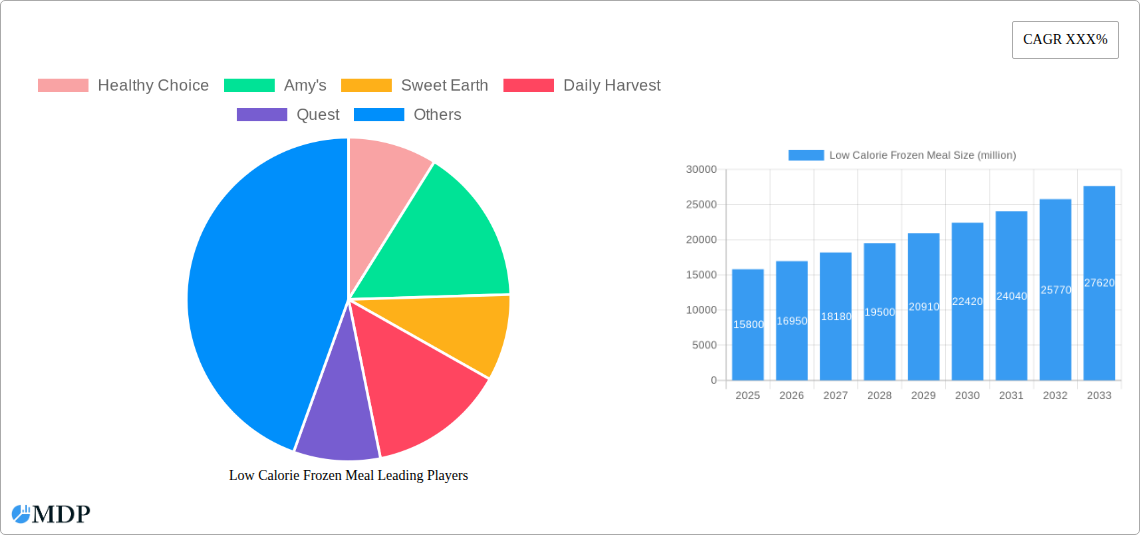
Low Calorie Frozen Meal Company Market Share
Low Calorie Frozen Meal Market: Comprehensive Analysis & Growth Forecast (2019-2033)
This in-depth report provides a meticulously researched overview of the Low Calorie Frozen Meal market, a rapidly expanding segment driven by increasing health consciousness and demand for convenient, nutritious food options. Spanning the historical period of 2019–2024, the base year of 2025, and a comprehensive forecast period extending to 2033, this analysis offers critical insights for industry stakeholders, including manufacturers, retailers, investors, and product developers. With an estimated market size expected to reach xx million by 2025 and project to grow significantly throughout the forecast period, this report will equip you with actionable intelligence to navigate the evolving landscape of healthy frozen meals.
Low Calorie Frozen Meal Market Dynamics & Concentration
The Low Calorie Frozen Meal market exhibits moderate to high concentration, with a few dominant players holding substantial market share, estimated to be around xx million by the base year 2025. Innovation is a key driver, fueled by advancements in food technology, ingredient sourcing, and packaging, leading to a surge in new product development across various calorie segments. Regulatory frameworks, primarily focused on food safety, labeling accuracy, and nutritional claims, play a crucial role in shaping market entry and product formulations. The threat of product substitutes, ranging from fresh meal kits to plant-based alternatives, remains a constant challenge, pushing manufacturers to continuously differentiate their offerings. End-user trends are overwhelmingly leaning towards demand for convenient, ready-to-eat meals that cater to specific dietary needs, such as high-protein, low-carb, or allergen-free options. Merger and acquisition (M&A) activities are present, though not exceptionally high, with a few strategic deals estimated in the range of xx million to xx million, aimed at expanding product portfolios and market reach. The number of M&A deals is projected to be around xx to xx annually over the forecast period.
Low Calorie Frozen Meal Industry Trends & Analysis
The Low Calorie Frozen Meal industry is experiencing robust growth, with an estimated Compound Annual Growth Rate (CAGR) of xx% during the forecast period (2025–2033). This expansion is primarily driven by escalating consumer awareness regarding health and wellness, leading to a sustained demand for diet-friendly frozen meals. Technological disruptions, including advancements in freezing techniques that preserve nutritional value and texture, alongside innovative ingredient formulations utilizing alternative proteins and plant-based components, are transforming product offerings. Consumer preferences are increasingly sophisticated, with a strong emphasis on natural ingredients, transparent labeling, and functional benefits beyond calorie reduction. The market penetration of healthy frozen dinners is expected to rise significantly, reaching xx% by 2033. Competitive dynamics are intense, characterized by continuous product innovation, aggressive marketing campaigns, and strategic pricing by key players vying for market dominance. The increasing adoption of online grocery shopping and direct-to-consumer models is also reshaping distribution channels, further amplifying market reach and accessibility for low-calorie frozen food. The global market size is projected to reach xx million by 2033, a substantial increase from xx million in the historical period.
Leading Markets & Segments in Low Calorie Frozen Meal
The Low Calorie Frozen Meal market is dominated by Retail Store and Supermarket applications, accounting for an estimated xx% and xx% of market share, respectively, in 2025. These traditional channels benefit from high foot traffic and established consumer purchasing habits. However, Internet Sales are exhibiting the fastest growth trajectory, projected to reach xx% market share by 2033, driven by the convenience and expanding reach of e-commerce platforms.
Within product types, the 300-400 Calories segment currently holds the largest market share, estimated at xx% in 2025, appealing to a broad consumer base seeking balanced meal options. The 200-300 Calories segment is rapidly gaining traction, driven by a growing demographic focused on strict calorie control and weight management, projected to capture xx% of the market by 2033.
Key Drivers for Retail Store & Supermarket Dominance:
- Established Infrastructure: Extensive network of physical stores providing immediate accessibility.
- Impulse Purchases: Prominent product placement and promotional displays encourage unplanned purchases.
- Consumer Trust: Long-standing familiarity and trust associated with these retail environments.
- Variety and Choice: Ability to offer a wide array of brands and product options, catering to diverse preferences.
Key Drivers for Internet Sales Growth:
- Convenience and Time-Saving: Easy online ordering and home delivery options for busy consumers.
- Wider Selection: Access to niche brands and specialized low-calorie options not readily available in all physical stores.
- Personalized Recommendations: Algorithmic suggestions based on dietary preferences and past purchases.
- Subscription Models: Recurring delivery services offering convenience and potential cost savings.
Key Drivers for 300-400 Calories Segment Dominance:
- Balanced Nutrition: Perceived as providing a satiating and nutritionally complete meal.
- Broad Appeal: Caters to a wide range of dietary goals and lifestyle choices.
- Versatile Meal Replacement: Suitable for lunch or dinner options for a significant portion of the population.
Key Drivers for 200-300 Calories Segment Growth:
- Weight Management Focus: Directly addresses the needs of individuals actively trying to lose or manage weight.
- Increasing Health Consciousness: Growing segment of the population prioritizing meticulous calorie tracking.
- Targeted Dietary Plans: Aligns with popular low-calorie and ketogenic diets.
The North America region is anticipated to remain the largest market, contributing approximately xx% to the global market revenue in 2025, owing to high disposable incomes and a well-established health and wellness culture. However, the Asia Pacific region is projected to witness the most significant growth rate during the forecast period, driven by rising urbanization, increasing disposable incomes, and a burgeoning middle class adopting Western dietary habits.
Low Calorie Frozen Meal Product Developments
Product innovation in the Low Calorie Frozen Meal market is characterized by a surge in plant-based and gluten-free options, catering to evolving dietary needs and preferences. Companies are focusing on enhancing the nutritional profile of meals by incorporating more protein and fiber while reducing sodium and sugar content. Advanced freezing technologies are being utilized to preserve freshness and texture, minimizing the perception of compromise associated with frozen foods. Competitive advantages are being built through unique flavor profiles, culturally diverse cuisines, and the use of premium, ethically sourced ingredients. The market is also seeing the development of specialized meal lines targeting specific health concerns and dietary regimes, such as diabetic-friendly or gut-health-focused frozen meals.
Key Drivers of Low Calorie Frozen Meal Growth
Several key factors are propelling the growth of the Low Calorie Frozen Meal market. Technologically, advancements in food science are enabling the creation of more palatable and nutritious frozen meals with extended shelf lives. Economically, rising disposable incomes globally are allowing consumers to invest more in convenient and health-conscious food options. Regulatory frameworks, while sometimes posing challenges, also encourage innovation by setting clear guidelines for nutritional labeling and product claims, fostering consumer trust. The increasing prevalence of lifestyle-related diseases and a growing global emphasis on preventative healthcare are significant societal drivers pushing demand for calorie-controlled food products.
Challenges in the Low Calorie Frozen Meal Market
Despite its promising growth, the Low Calorie Frozen Meal market faces several challenges. Regulatory hurdles related to ingredient sourcing, processing standards, and unsubstantiated health claims can impact product development and market entry. Supply chain disruptions, particularly those related to the cold chain logistics required for frozen products, can lead to increased costs and potential product spoilage. Intense competitive pressures from both established brands and emerging players necessitate continuous innovation and aggressive marketing strategies. Furthermore, consumer perception regarding the taste, texture, and perceived "processed" nature of frozen meals remains a barrier for some segments of the population. The estimated impact of these challenges on market growth is around xx% to xx% annually.
Emerging Opportunities in Low Calorie Frozen Meal
Emerging opportunities in the Low Calorie Frozen Meal market are abundant, driven by several catalysts. Technological breakthroughs in plant-based protein replication and fermentation offer avenues for creating highly appealing meat alternatives. Strategic partnerships between food manufacturers and health and wellness influencers or platforms can significantly enhance brand visibility and consumer adoption. Market expansion into emerging economies with growing middle classes and increasing demand for convenient food solutions presents a substantial growth avenue. The development of personalized nutrition platforms integrated with frozen meal offerings, utilizing AI and consumer data, represents a significant future opportunity for tailored and convenient healthy eating.
Leading Players in the Low Calorie Frozen Meal Sector
- Healthy Choice
- Amy's
- Sweet Earth
- Daily Harvest
- Quest
- Primal Kitchen
- Cedarlane
- Good Food Made
- Trader
- Lean Cuisine
- Smart Ones
- Kashi
- Evol
Key Milestones in Low Calorie Frozen Meal Industry
- 2019: Increased consumer focus on plant-based diets leads to a surge in vegan-friendly low-calorie frozen meal options.
- 2020: The COVID-19 pandemic accelerates the adoption of online grocery shopping and demand for convenient meal solutions, boosting the low-calorie frozen meal segment.
- 2021: Innovations in packaging technology improve sustainability and extend shelf life for frozen meals.
- 2022: Growing awareness of gut health drives the development of low-calorie frozen meals incorporating prebiotics and probiotics.
- 2023: Major brands expand their offerings to include more diverse international cuisines in low-calorie frozen meal formats.
- 2024: Increased investment in research and development for clean-label and minimally processed frozen meal options.
Strategic Outlook for Low Calorie Frozen Meal Market
The strategic outlook for the Low Calorie Frozen Meal market is exceptionally positive, driven by a confluence of accelerating consumer trends and ongoing technological advancements. Growth accelerators include the continued expansion of e-commerce channels, enabling wider reach and convenience; the increasing demand for personalized nutrition solutions, leading to specialized product development; and a persistent global emphasis on health and wellness, driving adoption of calorie-controlled diets. Companies that focus on ingredient transparency, sustainable practices, and innovative flavor profiles will be best positioned to capture market share and foster long-term customer loyalty in this dynamic and expanding sector. Strategic opportunities lie in tapping into emerging markets and developing integrated offerings that combine frozen meals with digital health platforms.
Low Calorie Frozen Meal Segmentation
-
1. Application
- 1.1. Retail Store
- 1.2. Supermarket
- 1.3. Internet Sales
-
2. Type
- 2.1. 200-300 Calories
- 2.2. 300-400 Calories
- 2.3. Other
Low Calorie Frozen Meal Segmentation By Geography
-
1. North America
- 1.1. United States
- 1.2. Canada
- 1.3. Mexico
-
2. South America
- 2.1. Brazil
- 2.2. Argentina
- 2.3. Rest of South America
-
3. Europe
- 3.1. United Kingdom
- 3.2. Germany
- 3.3. France
- 3.4. Italy
- 3.5. Spain
- 3.6. Russia
- 3.7. Benelux
- 3.8. Nordics
- 3.9. Rest of Europe
-
4. Middle East & Africa
- 4.1. Turkey
- 4.2. Israel
- 4.3. GCC
- 4.4. North Africa
- 4.5. South Africa
- 4.6. Rest of Middle East & Africa
-
5. Asia Pacific
- 5.1. China
- 5.2. India
- 5.3. Japan
- 5.4. South Korea
- 5.5. ASEAN
- 5.6. Oceania
- 5.7. Rest of Asia Pacific
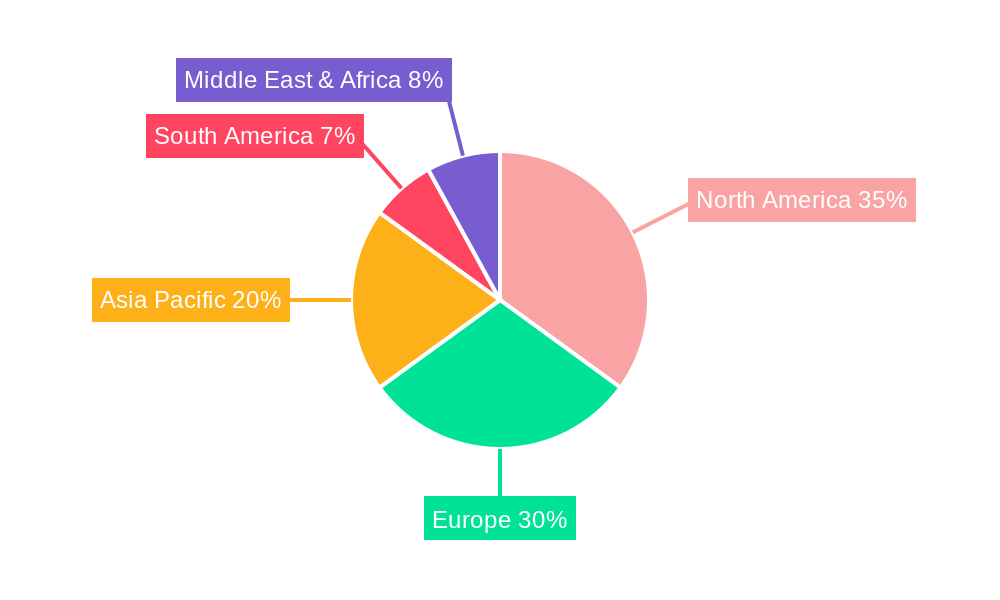
Low Calorie Frozen Meal Regional Market Share
Geographic Coverage of Low Calorie Frozen Meal
Low Calorie Frozen Meal REPORT HIGHLIGHTS
| Aspects | Details |
|---|---|
| Study Period | 2020-2034 |
| Base Year | 2025 |
| Estimated Year | 2026 |
| Forecast Period | 2026-2034 |
| Historical Period | 2020-2025 |
| Growth Rate | CAGR of XXX% from 2020-2034 |
| Segmentation |
|
Table of Contents
- 1. Introduction
- 1.1. Research Scope
- 1.2. Market Segmentation
- 1.3. Research Methodology
- 1.4. Definitions and Assumptions
- 2. Executive Summary
- 2.1. Introduction
- 3. Market Dynamics
- 3.1. Introduction
- 3.2. Market Drivers
- 3.3. Market Restrains
- 3.4. Market Trends
- 4. Market Factor Analysis
- 4.1. Porters Five Forces
- 4.2. Supply/Value Chain
- 4.3. PESTEL analysis
- 4.4. Market Entropy
- 4.5. Patent/Trademark Analysis
- 5. Global Low Calorie Frozen Meal Analysis, Insights and Forecast, 2020-2032
- 5.1. Market Analysis, Insights and Forecast - by Application
- 5.1.1. Retail Store
- 5.1.2. Supermarket
- 5.1.3. Internet Sales
- 5.2. Market Analysis, Insights and Forecast - by Type
- 5.2.1. 200-300 Calories
- 5.2.2. 300-400 Calories
- 5.2.3. Other
- 5.3. Market Analysis, Insights and Forecast - by Region
- 5.3.1. North America
- 5.3.2. South America
- 5.3.3. Europe
- 5.3.4. Middle East & Africa
- 5.3.5. Asia Pacific
- 5.1. Market Analysis, Insights and Forecast - by Application
- 6. North America Low Calorie Frozen Meal Analysis, Insights and Forecast, 2020-2032
- 6.1. Market Analysis, Insights and Forecast - by Application
- 6.1.1. Retail Store
- 6.1.2. Supermarket
- 6.1.3. Internet Sales
- 6.2. Market Analysis, Insights and Forecast - by Type
- 6.2.1. 200-300 Calories
- 6.2.2. 300-400 Calories
- 6.2.3. Other
- 6.1. Market Analysis, Insights and Forecast - by Application
- 7. South America Low Calorie Frozen Meal Analysis, Insights and Forecast, 2020-2032
- 7.1. Market Analysis, Insights and Forecast - by Application
- 7.1.1. Retail Store
- 7.1.2. Supermarket
- 7.1.3. Internet Sales
- 7.2. Market Analysis, Insights and Forecast - by Type
- 7.2.1. 200-300 Calories
- 7.2.2. 300-400 Calories
- 7.2.3. Other
- 7.1. Market Analysis, Insights and Forecast - by Application
- 8. Europe Low Calorie Frozen Meal Analysis, Insights and Forecast, 2020-2032
- 8.1. Market Analysis, Insights and Forecast - by Application
- 8.1.1. Retail Store
- 8.1.2. Supermarket
- 8.1.3. Internet Sales
- 8.2. Market Analysis, Insights and Forecast - by Type
- 8.2.1. 200-300 Calories
- 8.2.2. 300-400 Calories
- 8.2.3. Other
- 8.1. Market Analysis, Insights and Forecast - by Application
- 9. Middle East & Africa Low Calorie Frozen Meal Analysis, Insights and Forecast, 2020-2032
- 9.1. Market Analysis, Insights and Forecast - by Application
- 9.1.1. Retail Store
- 9.1.2. Supermarket
- 9.1.3. Internet Sales
- 9.2. Market Analysis, Insights and Forecast - by Type
- 9.2.1. 200-300 Calories
- 9.2.2. 300-400 Calories
- 9.2.3. Other
- 9.1. Market Analysis, Insights and Forecast - by Application
- 10. Asia Pacific Low Calorie Frozen Meal Analysis, Insights and Forecast, 2020-2032
- 10.1. Market Analysis, Insights and Forecast - by Application
- 10.1.1. Retail Store
- 10.1.2. Supermarket
- 10.1.3. Internet Sales
- 10.2. Market Analysis, Insights and Forecast - by Type
- 10.2.1. 200-300 Calories
- 10.2.2. 300-400 Calories
- 10.2.3. Other
- 10.1. Market Analysis, Insights and Forecast - by Application
- 11. Competitive Analysis
- 11.1. Global Market Share Analysis 2025
- 11.2. Company Profiles
- 11.2.1 Healthy Choice
- 11.2.1.1. Overview
- 11.2.1.2. Products
- 11.2.1.3. SWOT Analysis
- 11.2.1.4. Recent Developments
- 11.2.1.5. Financials (Based on Availability)
- 11.2.2 Amy's
- 11.2.2.1. Overview
- 11.2.2.2. Products
- 11.2.2.3. SWOT Analysis
- 11.2.2.4. Recent Developments
- 11.2.2.5. Financials (Based on Availability)
- 11.2.3 Sweet Earth
- 11.2.3.1. Overview
- 11.2.3.2. Products
- 11.2.3.3. SWOT Analysis
- 11.2.3.4. Recent Developments
- 11.2.3.5. Financials (Based on Availability)
- 11.2.4 Daily Harvest
- 11.2.4.1. Overview
- 11.2.4.2. Products
- 11.2.4.3. SWOT Analysis
- 11.2.4.4. Recent Developments
- 11.2.4.5. Financials (Based on Availability)
- 11.2.5 Quest
- 11.2.5.1. Overview
- 11.2.5.2. Products
- 11.2.5.3. SWOT Analysis
- 11.2.5.4. Recent Developments
- 11.2.5.5. Financials (Based on Availability)
- 11.2.6 Primal Kitchen
- 11.2.6.1. Overview
- 11.2.6.2. Products
- 11.2.6.3. SWOT Analysis
- 11.2.6.4. Recent Developments
- 11.2.6.5. Financials (Based on Availability)
- 11.2.7 Cedarlane
- 11.2.7.1. Overview
- 11.2.7.2. Products
- 11.2.7.3. SWOT Analysis
- 11.2.7.4. Recent Developments
- 11.2.7.5. Financials (Based on Availability)
- 11.2.8 Good Food Made
- 11.2.8.1. Overview
- 11.2.8.2. Products
- 11.2.8.3. SWOT Analysis
- 11.2.8.4. Recent Developments
- 11.2.8.5. Financials (Based on Availability)
- 11.2.9 Trader
- 11.2.9.1. Overview
- 11.2.9.2. Products
- 11.2.9.3. SWOT Analysis
- 11.2.9.4. Recent Developments
- 11.2.9.5. Financials (Based on Availability)
- 11.2.10 Lean Cuisine
- 11.2.10.1. Overview
- 11.2.10.2. Products
- 11.2.10.3. SWOT Analysis
- 11.2.10.4. Recent Developments
- 11.2.10.5. Financials (Based on Availability)
- 11.2.11 Smart Ones
- 11.2.11.1. Overview
- 11.2.11.2. Products
- 11.2.11.3. SWOT Analysis
- 11.2.11.4. Recent Developments
- 11.2.11.5. Financials (Based on Availability)
- 11.2.12 Kashi
- 11.2.12.1. Overview
- 11.2.12.2. Products
- 11.2.12.3. SWOT Analysis
- 11.2.12.4. Recent Developments
- 11.2.12.5. Financials (Based on Availability)
- 11.2.13 Evol
- 11.2.13.1. Overview
- 11.2.13.2. Products
- 11.2.13.3. SWOT Analysis
- 11.2.13.4. Recent Developments
- 11.2.13.5. Financials (Based on Availability)
- 11.2.1 Healthy Choice
List of Figures
- Figure 1: Global Low Calorie Frozen Meal Revenue Breakdown (million, %) by Region 2025 & 2033
- Figure 2: North America Low Calorie Frozen Meal Revenue (million), by Application 2025 & 2033
- Figure 3: North America Low Calorie Frozen Meal Revenue Share (%), by Application 2025 & 2033
- Figure 4: North America Low Calorie Frozen Meal Revenue (million), by Type 2025 & 2033
- Figure 5: North America Low Calorie Frozen Meal Revenue Share (%), by Type 2025 & 2033
- Figure 6: North America Low Calorie Frozen Meal Revenue (million), by Country 2025 & 2033
- Figure 7: North America Low Calorie Frozen Meal Revenue Share (%), by Country 2025 & 2033
- Figure 8: South America Low Calorie Frozen Meal Revenue (million), by Application 2025 & 2033
- Figure 9: South America Low Calorie Frozen Meal Revenue Share (%), by Application 2025 & 2033
- Figure 10: South America Low Calorie Frozen Meal Revenue (million), by Type 2025 & 2033
- Figure 11: South America Low Calorie Frozen Meal Revenue Share (%), by Type 2025 & 2033
- Figure 12: South America Low Calorie Frozen Meal Revenue (million), by Country 2025 & 2033
- Figure 13: South America Low Calorie Frozen Meal Revenue Share (%), by Country 2025 & 2033
- Figure 14: Europe Low Calorie Frozen Meal Revenue (million), by Application 2025 & 2033
- Figure 15: Europe Low Calorie Frozen Meal Revenue Share (%), by Application 2025 & 2033
- Figure 16: Europe Low Calorie Frozen Meal Revenue (million), by Type 2025 & 2033
- Figure 17: Europe Low Calorie Frozen Meal Revenue Share (%), by Type 2025 & 2033
- Figure 18: Europe Low Calorie Frozen Meal Revenue (million), by Country 2025 & 2033
- Figure 19: Europe Low Calorie Frozen Meal Revenue Share (%), by Country 2025 & 2033
- Figure 20: Middle East & Africa Low Calorie Frozen Meal Revenue (million), by Application 2025 & 2033
- Figure 21: Middle East & Africa Low Calorie Frozen Meal Revenue Share (%), by Application 2025 & 2033
- Figure 22: Middle East & Africa Low Calorie Frozen Meal Revenue (million), by Type 2025 & 2033
- Figure 23: Middle East & Africa Low Calorie Frozen Meal Revenue Share (%), by Type 2025 & 2033
- Figure 24: Middle East & Africa Low Calorie Frozen Meal Revenue (million), by Country 2025 & 2033
- Figure 25: Middle East & Africa Low Calorie Frozen Meal Revenue Share (%), by Country 2025 & 2033
- Figure 26: Asia Pacific Low Calorie Frozen Meal Revenue (million), by Application 2025 & 2033
- Figure 27: Asia Pacific Low Calorie Frozen Meal Revenue Share (%), by Application 2025 & 2033
- Figure 28: Asia Pacific Low Calorie Frozen Meal Revenue (million), by Type 2025 & 2033
- Figure 29: Asia Pacific Low Calorie Frozen Meal Revenue Share (%), by Type 2025 & 2033
- Figure 30: Asia Pacific Low Calorie Frozen Meal Revenue (million), by Country 2025 & 2033
- Figure 31: Asia Pacific Low Calorie Frozen Meal Revenue Share (%), by Country 2025 & 2033
List of Tables
- Table 1: Global Low Calorie Frozen Meal Revenue million Forecast, by Application 2020 & 2033
- Table 2: Global Low Calorie Frozen Meal Revenue million Forecast, by Type 2020 & 2033
- Table 3: Global Low Calorie Frozen Meal Revenue million Forecast, by Region 2020 & 2033
- Table 4: Global Low Calorie Frozen Meal Revenue million Forecast, by Application 2020 & 2033
- Table 5: Global Low Calorie Frozen Meal Revenue million Forecast, by Type 2020 & 2033
- Table 6: Global Low Calorie Frozen Meal Revenue million Forecast, by Country 2020 & 2033
- Table 7: United States Low Calorie Frozen Meal Revenue (million) Forecast, by Application 2020 & 2033
- Table 8: Canada Low Calorie Frozen Meal Revenue (million) Forecast, by Application 2020 & 2033
- Table 9: Mexico Low Calorie Frozen Meal Revenue (million) Forecast, by Application 2020 & 2033
- Table 10: Global Low Calorie Frozen Meal Revenue million Forecast, by Application 2020 & 2033
- Table 11: Global Low Calorie Frozen Meal Revenue million Forecast, by Type 2020 & 2033
- Table 12: Global Low Calorie Frozen Meal Revenue million Forecast, by Country 2020 & 2033
- Table 13: Brazil Low Calorie Frozen Meal Revenue (million) Forecast, by Application 2020 & 2033
- Table 14: Argentina Low Calorie Frozen Meal Revenue (million) Forecast, by Application 2020 & 2033
- Table 15: Rest of South America Low Calorie Frozen Meal Revenue (million) Forecast, by Application 2020 & 2033
- Table 16: Global Low Calorie Frozen Meal Revenue million Forecast, by Application 2020 & 2033
- Table 17: Global Low Calorie Frozen Meal Revenue million Forecast, by Type 2020 & 2033
- Table 18: Global Low Calorie Frozen Meal Revenue million Forecast, by Country 2020 & 2033
- Table 19: United Kingdom Low Calorie Frozen Meal Revenue (million) Forecast, by Application 2020 & 2033
- Table 20: Germany Low Calorie Frozen Meal Revenue (million) Forecast, by Application 2020 & 2033
- Table 21: France Low Calorie Frozen Meal Revenue (million) Forecast, by Application 2020 & 2033
- Table 22: Italy Low Calorie Frozen Meal Revenue (million) Forecast, by Application 2020 & 2033
- Table 23: Spain Low Calorie Frozen Meal Revenue (million) Forecast, by Application 2020 & 2033
- Table 24: Russia Low Calorie Frozen Meal Revenue (million) Forecast, by Application 2020 & 2033
- Table 25: Benelux Low Calorie Frozen Meal Revenue (million) Forecast, by Application 2020 & 2033
- Table 26: Nordics Low Calorie Frozen Meal Revenue (million) Forecast, by Application 2020 & 2033
- Table 27: Rest of Europe Low Calorie Frozen Meal Revenue (million) Forecast, by Application 2020 & 2033
- Table 28: Global Low Calorie Frozen Meal Revenue million Forecast, by Application 2020 & 2033
- Table 29: Global Low Calorie Frozen Meal Revenue million Forecast, by Type 2020 & 2033
- Table 30: Global Low Calorie Frozen Meal Revenue million Forecast, by Country 2020 & 2033
- Table 31: Turkey Low Calorie Frozen Meal Revenue (million) Forecast, by Application 2020 & 2033
- Table 32: Israel Low Calorie Frozen Meal Revenue (million) Forecast, by Application 2020 & 2033
- Table 33: GCC Low Calorie Frozen Meal Revenue (million) Forecast, by Application 2020 & 2033
- Table 34: North Africa Low Calorie Frozen Meal Revenue (million) Forecast, by Application 2020 & 2033
- Table 35: South Africa Low Calorie Frozen Meal Revenue (million) Forecast, by Application 2020 & 2033
- Table 36: Rest of Middle East & Africa Low Calorie Frozen Meal Revenue (million) Forecast, by Application 2020 & 2033
- Table 37: Global Low Calorie Frozen Meal Revenue million Forecast, by Application 2020 & 2033
- Table 38: Global Low Calorie Frozen Meal Revenue million Forecast, by Type 2020 & 2033
- Table 39: Global Low Calorie Frozen Meal Revenue million Forecast, by Country 2020 & 2033
- Table 40: China Low Calorie Frozen Meal Revenue (million) Forecast, by Application 2020 & 2033
- Table 41: India Low Calorie Frozen Meal Revenue (million) Forecast, by Application 2020 & 2033
- Table 42: Japan Low Calorie Frozen Meal Revenue (million) Forecast, by Application 2020 & 2033
- Table 43: South Korea Low Calorie Frozen Meal Revenue (million) Forecast, by Application 2020 & 2033
- Table 44: ASEAN Low Calorie Frozen Meal Revenue (million) Forecast, by Application 2020 & 2033
- Table 45: Oceania Low Calorie Frozen Meal Revenue (million) Forecast, by Application 2020 & 2033
- Table 46: Rest of Asia Pacific Low Calorie Frozen Meal Revenue (million) Forecast, by Application 2020 & 2033
Frequently Asked Questions
1. What is the projected Compound Annual Growth Rate (CAGR) of the Low Calorie Frozen Meal?
The projected CAGR is approximately XXX%.
2. Which companies are prominent players in the Low Calorie Frozen Meal?
Key companies in the market include Healthy Choice, Amy's, Sweet Earth, Daily Harvest, Quest, Primal Kitchen, Cedarlane, Good Food Made, Trader, Lean Cuisine, Smart Ones, Kashi, Evol.
3. What are the main segments of the Low Calorie Frozen Meal?
The market segments include Application, Type.
4. Can you provide details about the market size?
The market size is estimated to be USD XXX million as of 2022.
5. What are some drivers contributing to market growth?
N/A
6. What are the notable trends driving market growth?
N/A
7. Are there any restraints impacting market growth?
N/A
8. Can you provide examples of recent developments in the market?
N/A
9. What pricing options are available for accessing the report?
Pricing options include single-user, multi-user, and enterprise licenses priced at USD 2900.00, USD 4350.00, and USD 5800.00 respectively.
10. Is the market size provided in terms of value or volume?
The market size is provided in terms of value, measured in million.
11. Are there any specific market keywords associated with the report?
Yes, the market keyword associated with the report is "Low Calorie Frozen Meal," which aids in identifying and referencing the specific market segment covered.
12. How do I determine which pricing option suits my needs best?
The pricing options vary based on user requirements and access needs. Individual users may opt for single-user licenses, while businesses requiring broader access may choose multi-user or enterprise licenses for cost-effective access to the report.
13. Are there any additional resources or data provided in the Low Calorie Frozen Meal report?
While the report offers comprehensive insights, it's advisable to review the specific contents or supplementary materials provided to ascertain if additional resources or data are available.
14. How can I stay updated on further developments or reports in the Low Calorie Frozen Meal?
To stay informed about further developments, trends, and reports in the Low Calorie Frozen Meal, consider subscribing to industry newsletters, following relevant companies and organizations, or regularly checking reputable industry news sources and publications.
Methodology
Step 1 - Identification of Relevant Samples Size from Population Database


Step 2 - Approaches for Defining Global Market Size (Value, Volume* & Price*)

Note*: In applicable scenarios
Step 3 - Data Sources
Primary Research
- Web Analytics
- Survey Reports
- Research Institute
- Latest Research Reports
- Opinion Leaders
Secondary Research
- Annual Reports
- White Paper
- Latest Press Release
- Industry Association
- Paid Database
- Investor Presentations

Step 4 - Data Triangulation
Involves using different sources of information in order to increase the validity of a study
These sources are likely to be stakeholders in a program - participants, other researchers, program staff, other community members, and so on.
Then we put all data in single framework & apply various statistical tools to find out the dynamic on the market.
During the analysis stage, feedback from the stakeholder groups would be compared to determine areas of agreement as well as areas of divergence