

Key Insights
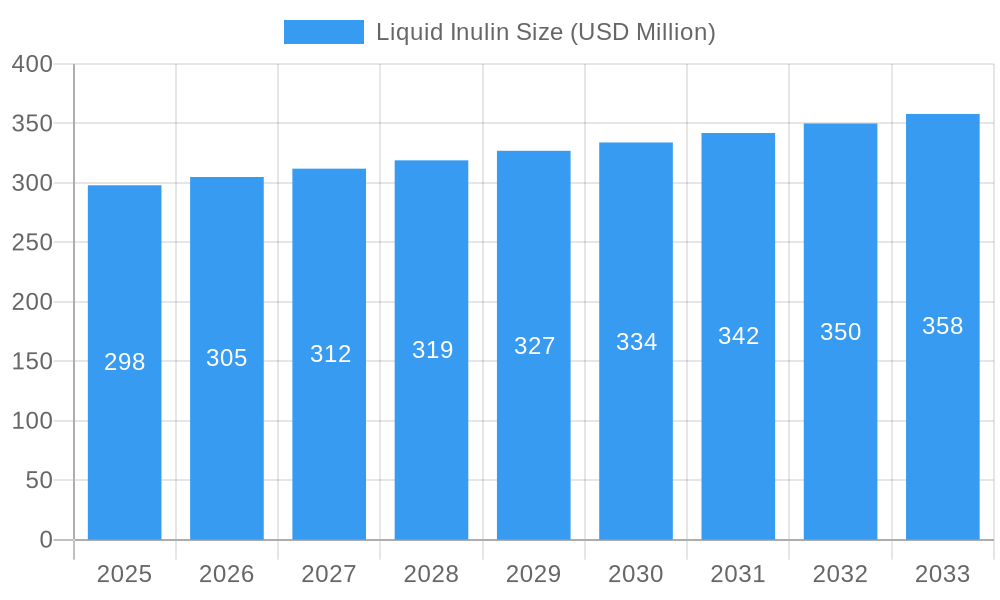
The global Liquid Inulin market is projected to reach an estimated $298 million in 2025, exhibiting a Compound Annual Growth Rate (CAGR) of 2.4% during the forecast period of 2025-2033. This steady growth is propelled by increasing consumer demand for natural and functional food ingredients, particularly those offering prebiotic benefits. The rising awareness of gut health and its impact on overall well-being is a significant driver, leading to greater adoption of inulin in dairy products, health supplements, and beverages. Manufacturers are actively innovating, developing diverse inulin formulations and applications to cater to evolving dietary preferences and health consciousness.
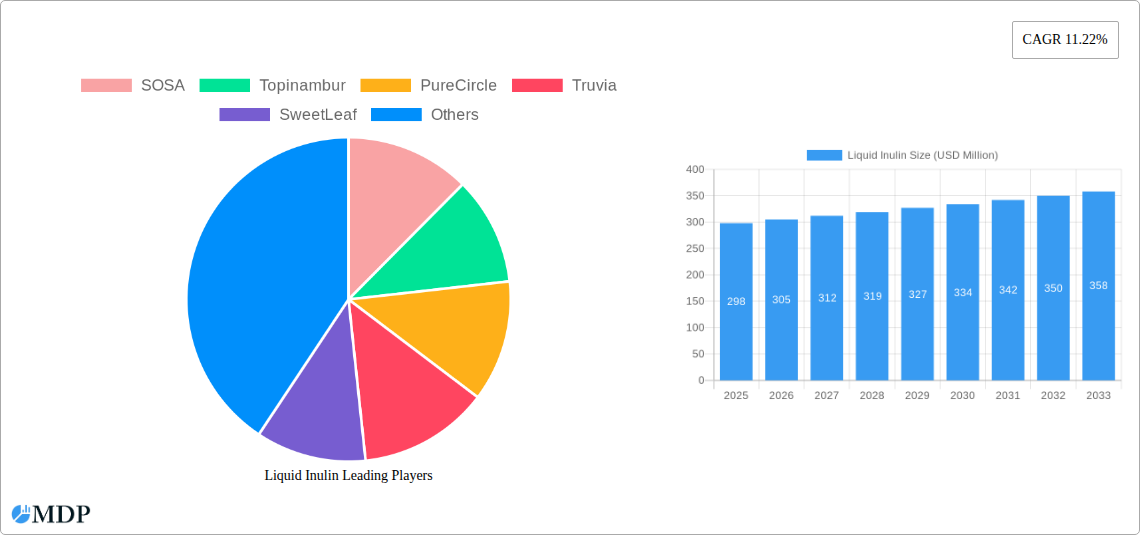
Liquid Inulin Market Size (In Million)
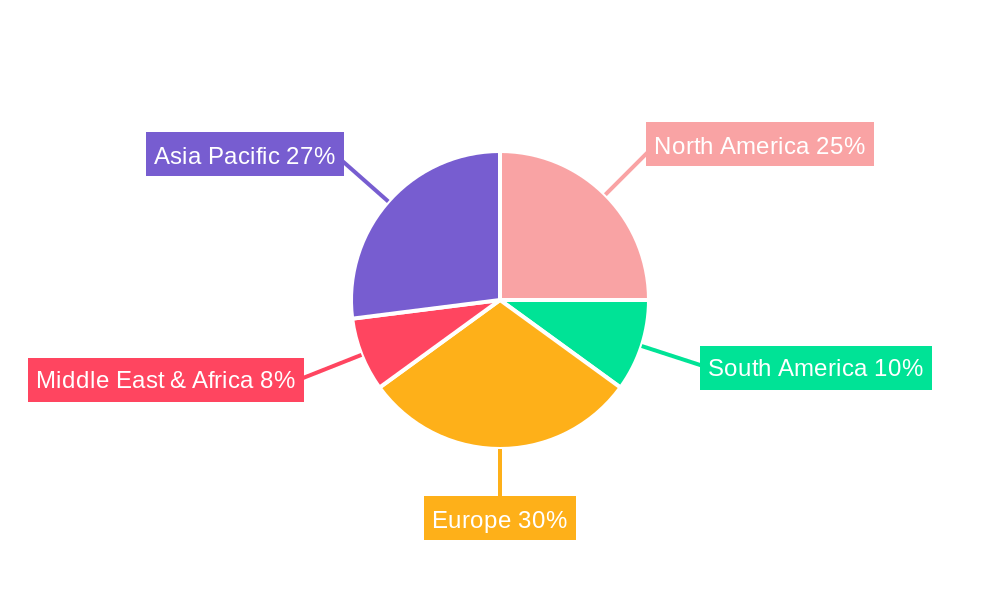
Key market dynamics indicate a robust expansion in the Asia Pacific region, driven by growing disposable incomes and an increasing preference for healthier food options in emerging economies like China and India. North America and Europe continue to represent substantial markets, influenced by established health and wellness trends. While the "60% Inulin" segment is expected to dominate due to its widespread use, the "90% Inulin" segment is poised for faster growth as demand for higher purity and more potent prebiotic solutions rises. Potential restraints could include fluctuating raw material prices and the emergence of alternative prebiotic ingredients, necessitating continuous innovation and cost-efficiency from market players like SOSA, Topinambur, and PureCircle.
Liquid Inulin Company Market Share
Report Description: Liquid Inulin Market Size, Share, Growth, Trends, and Forecast 2019-2033
This comprehensive report provides an in-depth analysis of the global Liquid Inulin market, a rapidly expanding segment within the functional food and health ingredients industry. With a study period spanning from 2019 to 2033, this report offers a robust understanding of market dynamics, emerging trends, key growth drivers, and future opportunities. The base year for analysis is 2025, with a forecast period extending from 2025 to 2033. This report is an essential resource for stakeholders including manufacturers, suppliers, R&D professionals, investors, and market strategists seeking to capitalize on the burgeoning demand for prebiotic ingredients.
The report delves into market concentration, innovation drivers, and regulatory frameworks shaping the Liquid Inulin landscape. It scrutinizes product substitutes, evolving end-user trends, and strategic M&A activities that are redefining the competitive environment. With an estimated market share of $5,500 million in the base year of 2025, and projected to reach $12,000 million by 2033, the market exhibits significant growth potential. The number of M&A deals is anticipated to increase by 25% over the forecast period, signaling active consolidation and strategic expansion within the industry. Key players are actively investing in product innovation and market penetration.
Liquid Inulin Market Dynamics & Concentration
The global Liquid Inulin market is characterized by a dynamic interplay of innovation, regulatory influence, and evolving consumer preferences. Market concentration is moderate, with a few dominant players alongside a growing number of specialized manufacturers. Innovation drivers are primarily focused on enhancing product purity, developing novel extraction techniques for improved yield and quality, and expanding the application range of liquid inulin in various food and beverage formulations. Regulatory frameworks, particularly concerning health claims and food ingredient safety, play a crucial role in market access and product development strategies. For instance, approvals for prebiotic claims in regions like North America and Europe have significantly boosted market adoption. Product substitutes, including other prebiotics like fructooligosaccharides (FOS) and galactooligosaccharides (GOS), present a competitive challenge, necessitating continuous product differentiation and cost-effectiveness. End-user trends are strongly influenced by increasing consumer awareness regarding gut health and the demand for natural, plant-based ingredients. This is driving demand for liquid inulin in fortified foods and beverages. Merger and Acquisition (M&A) activities are on the rise as companies seek to expand their product portfolios, geographical reach, and technological capabilities. We anticipate 18 M&A deals in the next five years, with an estimated average deal value of $75 million. The market share of the top five players is projected to be around 45% in 2025.
Liquid Inulin Industry Trends & Analysis
The Liquid Inulin industry is poised for substantial growth, driven by a confluence of factors. A primary market growth driver is the escalating global demand for functional foods and beverages that offer demonstrable health benefits, particularly concerning digestive wellness and immune support. Consumers are increasingly educated about the role of prebiotics in promoting a healthy gut microbiome, leading to a surge in demand for products fortified with ingredients like liquid inulin. Technological disruptions are playing a pivotal role, with advancements in extraction and purification processes leading to higher quality, more soluble, and cost-effective liquid inulin. Companies are investing heavily in R&D to optimize production efficiency and explore new botanical sources beyond traditional chicory and Jerusalem artichoke. Consumer preferences are shifting towards natural, plant-derived, and non-GMO ingredients, positioning liquid inulin favorably against synthetic alternatives. The trend towards clean-label products further amplifies its appeal. Competitive dynamics are intensifying, with established ingredient suppliers and emerging players vying for market share. Strategic partnerships and collaborations are becoming increasingly common as companies seek to leverage each other's expertise in production, distribution, and market access. The projected Compound Annual Growth Rate (CAGR) for the global Liquid Inulin market is approximately 12.5% from 2025 to 2033. Market penetration is expected to rise from 20% in 2025 to over 35% by 2033, particularly in developed economies. The market size is estimated to grow from $5,500 million in 2025 to $12,000 million by 2033.
Leading Markets & Segments in Liquid Inulin
The global Liquid Inulin market exhibits distinct regional dominance and segment preferences. North America currently leads the market, driven by a highly health-conscious consumer base, robust regulatory support for functional ingredients, and significant investment in food and beverage innovation. Within North America, the United States accounts for the largest share, with a strong demand for health supplements and fortified food products. Asia-Pacific, particularly China and India, presents the fastest-growing regional market due to a rapidly expanding middle class, increasing disposable incomes, and a growing awareness of health and wellness.
In terms of applications, Dairy Products represent the largest and most dominant segment. Liquid inulin's excellent solubility, mild sweetness, and prebiotic properties make it an ideal ingredient for yogurts, fermented milk drinks, and other dairy-based products aimed at promoting gut health. Health Products are the second-largest segment, encompassing dietary supplements, functional food bars, and powders where liquid inulin is a key active ingredient for digestive health. Drinks represent a rapidly growing application segment, including juices, smoothies, and sports drinks, as manufacturers seek to enhance the nutritional profile of their offerings with prebiotic benefits.
Analyzing by Type, the 60% Inulin segment holds a significant market share due to its versatility and cost-effectiveness in various applications. However, the 90% Inulin segment is experiencing faster growth, driven by the demand for higher purity and more concentrated prebiotic effects in specialized health products and supplements. Economic policies in key markets, such as tax incentives for food manufacturers incorporating functional ingredients and supportive trade agreements, are further bolstering market growth. Infrastructure development, including efficient supply chain networks and advanced manufacturing facilities, also plays a crucial role in facilitating market expansion.
Liquid Inulin Product Developments
Product developments in the Liquid Inulin sector are primarily focused on enhancing solubility, purity, and functional benefits. Innovations include the development of highly soluble liquid inulin formulations that integrate seamlessly into a wider range of beverages and food matrices without affecting texture or taste. Companies are also concentrating on optimizing extraction processes to yield higher purity inulin with specific chain lengths tailored for targeted prebiotic effects. Furthermore, advancements in fermentation technology are enabling the production of novel inulin derivatives with enhanced bioavailability and customized functionalities. The competitive advantage lies in offering cost-effective solutions with proven health benefits, supported by rigorous scientific research and transparent labeling.
Key Drivers of Liquid Inulin Growth
The growth of the Liquid Inulin market is propelled by several key drivers. Technological advancements in extraction and purification techniques are leading to higher quality and more cost-effective liquid inulin production. Economic factors, such as rising disposable incomes and increased consumer spending on health and wellness products globally, are significantly boosting demand. Regulatory support for health claims associated with prebiotic ingredients, particularly in developed markets, is a crucial growth accelerant. For example, the growing trend of gut health awareness is a significant economic driver, with consumers willing to pay a premium for products offering digestive benefits. The expansion of the global health and wellness market, projected to reach $4.9 trillion by 2025, further underscores the potential for liquid inulin.
Challenges in the Liquid Inulin Market
Despite its promising growth trajectory, the Liquid Inulin market faces several challenges. Regulatory hurdles in certain emerging markets regarding the approval and labeling of functional ingredients can slow down market penetration. Supply chain complexities, including the sourcing of raw materials like chicory and Jerusalem artichoke, and ensuring consistent quality and availability, can pose logistical challenges. Competitive pressures from other prebiotic ingredients and the continuous need for product differentiation in a crowded marketplace demand sustained innovation and competitive pricing. The cost of production for high-purity liquid inulin can also be a restraint, impacting its affordability for certain applications.
Emerging Opportunities in Liquid Inulin
Emerging opportunities in the Liquid Inulin market are driven by evolving consumer demands and technological breakthroughs. The growing popularity of plant-based diets and the increasing demand for natural sweeteners and functional ingredients create a significant avenue for expansion. Strategic partnerships between ingredient manufacturers and food and beverage companies are crucial for co-developing innovative products and expanding market reach. Furthermore, market expansion strategies targeting emerging economies with rising health consciousness and increasing disposable incomes present substantial long-term growth potential. The development of novel applications in areas like infant nutrition and specialized medical foods also represents a significant untapped opportunity.
Leading Players in the Liquid Inulin Sector
- SOSA
- Topinambur
- PureCircle
- Truvia
- SweetLeaf
- Chongqing Joywinworld
- MFCARE
- ShangchengBio
Key Milestones in Liquid Inulin Industry
- 2019: Increased global research and development funding into gut health benefits of inulin.
- 2020: Introduction of new liquid inulin formulations with enhanced solubility and mild sweetness.
- 2021: Expansion of inulin cultivation and processing facilities by major players to meet growing demand.
- 2022: Growing adoption of liquid inulin in plant-based dairy alternatives and functional beverages.
- 2023: Release of new scientific studies highlighting the efficacy of specific inulin types in immune support.
- 2024: Increased M&A activity as companies seek to consolidate market positions and expand product portfolios.
- 2025 (Estimated): Projected significant market growth driven by heightened consumer awareness and product innovation.
- 2026-2033 (Forecast): Continued strong CAGR and market expansion driven by global health trends and technological advancements.
Strategic Outlook for Liquid Inulin Market
The strategic outlook for the Liquid Inulin market is exceptionally positive, characterized by strong growth accelerators. Continued investment in research and development to further elucidate the health benefits of inulin and its derivatives will be crucial for market expansion. Strategic partnerships with food and beverage manufacturers will drive innovation in product formulation and market penetration. Focusing on emerging markets and capitalizing on the plant-based and clean-label trends will unlock significant future potential. The market is expected to witness sustained growth driven by the increasing integration of liquid inulin into a wider array of food, beverage, and health products, solidifying its position as a key functional ingredient.
Liquid Inulin Segmentation
-
1. Application
- 1.1. Dairy Products
- 1.2. Health Products
- 1.3. Drinks
- 1.4. Other
-
2. Type
- 2.1. 60% Inulin
- 2.2. 90% Inulin
Liquid Inulin Segmentation By Geography
-
1. North America
- 1.1. United States
- 1.2. Canada
- 1.3. Mexico
-
2. South America
- 2.1. Brazil
- 2.2. Argentina
- 2.3. Rest of South America
-
3. Europe
- 3.1. United Kingdom
- 3.2. Germany
- 3.3. France
- 3.4. Italy
- 3.5. Spain
- 3.6. Russia
- 3.7. Benelux
- 3.8. Nordics
- 3.9. Rest of Europe
-
4. Middle East & Africa
- 4.1. Turkey
- 4.2. Israel
- 4.3. GCC
- 4.4. North Africa
- 4.5. South Africa
- 4.6. Rest of Middle East & Africa
-
5. Asia Pacific
- 5.1. China
- 5.2. India
- 5.3. Japan
- 5.4. South Korea
- 5.5. ASEAN
- 5.6. Oceania
- 5.7. Rest of Asia Pacific
Liquid Inulin Regional Market Share
Geographic Coverage of Liquid Inulin
Liquid Inulin REPORT HIGHLIGHTS
| Aspects | Details |
|---|---|
| Study Period | 2020-2034 |
| Base Year | 2025 |
| Estimated Year | 2026 |
| Forecast Period | 2026-2034 |
| Historical Period | 2020-2025 |
| Growth Rate | CAGR of 2.4% from 2020-2034 |
| Segmentation |
|
Table of Contents
- 1. Introduction
- 1.1. Research Scope
- 1.2. Market Segmentation
- 1.3. Research Methodology
- 1.4. Definitions and Assumptions
- 2. Executive Summary
- 2.1. Introduction
- 3. Market Dynamics
- 3.1. Introduction
- 3.2. Market Drivers
- 3.3. Market Restrains
- 3.4. Market Trends
- 4. Market Factor Analysis
- 4.1. Porters Five Forces
- 4.2. Supply/Value Chain
- 4.3. PESTEL analysis
- 4.4. Market Entropy
- 4.5. Patent/Trademark Analysis
- 5. Global Liquid Inulin Analysis, Insights and Forecast, 2020-2032
- 5.1. Market Analysis, Insights and Forecast - by Application
- 5.1.1. Dairy Products
- 5.1.2. Health Products
- 5.1.3. Drinks
- 5.1.4. Other
- 5.2. Market Analysis, Insights and Forecast - by Type
- 5.2.1. 60% Inulin
- 5.2.2. 90% Inulin
- 5.3. Market Analysis, Insights and Forecast - by Region
- 5.3.1. North America
- 5.3.2. South America
- 5.3.3. Europe
- 5.3.4. Middle East & Africa
- 5.3.5. Asia Pacific
- 5.1. Market Analysis, Insights and Forecast - by Application
- 6. North America Liquid Inulin Analysis, Insights and Forecast, 2020-2032
- 6.1. Market Analysis, Insights and Forecast - by Application
- 6.1.1. Dairy Products
- 6.1.2. Health Products
- 6.1.3. Drinks
- 6.1.4. Other
- 6.2. Market Analysis, Insights and Forecast - by Type
- 6.2.1. 60% Inulin
- 6.2.2. 90% Inulin
- 6.1. Market Analysis, Insights and Forecast - by Application
- 7. South America Liquid Inulin Analysis, Insights and Forecast, 2020-2032
- 7.1. Market Analysis, Insights and Forecast - by Application
- 7.1.1. Dairy Products
- 7.1.2. Health Products
- 7.1.3. Drinks
- 7.1.4. Other
- 7.2. Market Analysis, Insights and Forecast - by Type
- 7.2.1. 60% Inulin
- 7.2.2. 90% Inulin
- 7.1. Market Analysis, Insights and Forecast - by Application
- 8. Europe Liquid Inulin Analysis, Insights and Forecast, 2020-2032
- 8.1. Market Analysis, Insights and Forecast - by Application
- 8.1.1. Dairy Products
- 8.1.2. Health Products
- 8.1.3. Drinks
- 8.1.4. Other
- 8.2. Market Analysis, Insights and Forecast - by Type
- 8.2.1. 60% Inulin
- 8.2.2. 90% Inulin
- 8.1. Market Analysis, Insights and Forecast - by Application
- 9. Middle East & Africa Liquid Inulin Analysis, Insights and Forecast, 2020-2032
- 9.1. Market Analysis, Insights and Forecast - by Application
- 9.1.1. Dairy Products
- 9.1.2. Health Products
- 9.1.3. Drinks
- 9.1.4. Other
- 9.2. Market Analysis, Insights and Forecast - by Type
- 9.2.1. 60% Inulin
- 9.2.2. 90% Inulin
- 9.1. Market Analysis, Insights and Forecast - by Application
- 10. Asia Pacific Liquid Inulin Analysis, Insights and Forecast, 2020-2032
- 10.1. Market Analysis, Insights and Forecast - by Application
- 10.1.1. Dairy Products
- 10.1.2. Health Products
- 10.1.3. Drinks
- 10.1.4. Other
- 10.2. Market Analysis, Insights and Forecast - by Type
- 10.2.1. 60% Inulin
- 10.2.2. 90% Inulin
- 10.1. Market Analysis, Insights and Forecast - by Application
- 11. Competitive Analysis
- 11.1. Global Market Share Analysis 2025
- 11.2. Company Profiles
- 11.2.1 SOSA
- 11.2.1.1. Overview
- 11.2.1.2. Products
- 11.2.1.3. SWOT Analysis
- 11.2.1.4. Recent Developments
- 11.2.1.5. Financials (Based on Availability)
- 11.2.2 Topinambur
- 11.2.2.1. Overview
- 11.2.2.2. Products
- 11.2.2.3. SWOT Analysis
- 11.2.2.4. Recent Developments
- 11.2.2.5. Financials (Based on Availability)
- 11.2.3 PureCircle
- 11.2.3.1. Overview
- 11.2.3.2. Products
- 11.2.3.3. SWOT Analysis
- 11.2.3.4. Recent Developments
- 11.2.3.5. Financials (Based on Availability)
- 11.2.4 Truvia
- 11.2.4.1. Overview
- 11.2.4.2. Products
- 11.2.4.3. SWOT Analysis
- 11.2.4.4. Recent Developments
- 11.2.4.5. Financials (Based on Availability)
- 11.2.5 SweetLeaf
- 11.2.5.1. Overview
- 11.2.5.2. Products
- 11.2.5.3. SWOT Analysis
- 11.2.5.4. Recent Developments
- 11.2.5.5. Financials (Based on Availability)
- 11.2.6 Chongqing Joywinworld
- 11.2.6.1. Overview
- 11.2.6.2. Products
- 11.2.6.3. SWOT Analysis
- 11.2.6.4. Recent Developments
- 11.2.6.5. Financials (Based on Availability)
- 11.2.7 MFCARE
- 11.2.7.1. Overview
- 11.2.7.2. Products
- 11.2.7.3. SWOT Analysis
- 11.2.7.4. Recent Developments
- 11.2.7.5. Financials (Based on Availability)
- 11.2.8 ShangchengBio
- 11.2.8.1. Overview
- 11.2.8.2. Products
- 11.2.8.3. SWOT Analysis
- 11.2.8.4. Recent Developments
- 11.2.8.5. Financials (Based on Availability)
- 11.2.1 SOSA
List of Figures
- Figure 1: Global Liquid Inulin Revenue Breakdown (undefined, %) by Region 2025 & 2033
- Figure 2: Global Liquid Inulin Volume Breakdown (K, %) by Region 2025 & 2033
- Figure 3: North America Liquid Inulin Revenue (undefined), by Application 2025 & 2033
- Figure 4: North America Liquid Inulin Volume (K), by Application 2025 & 2033
- Figure 5: North America Liquid Inulin Revenue Share (%), by Application 2025 & 2033
- Figure 6: North America Liquid Inulin Volume Share (%), by Application 2025 & 2033
- Figure 7: North America Liquid Inulin Revenue (undefined), by Type 2025 & 2033
- Figure 8: North America Liquid Inulin Volume (K), by Type 2025 & 2033
- Figure 9: North America Liquid Inulin Revenue Share (%), by Type 2025 & 2033
- Figure 10: North America Liquid Inulin Volume Share (%), by Type 2025 & 2033
- Figure 11: North America Liquid Inulin Revenue (undefined), by Country 2025 & 2033
- Figure 12: North America Liquid Inulin Volume (K), by Country 2025 & 2033
- Figure 13: North America Liquid Inulin Revenue Share (%), by Country 2025 & 2033
- Figure 14: North America Liquid Inulin Volume Share (%), by Country 2025 & 2033
- Figure 15: South America Liquid Inulin Revenue (undefined), by Application 2025 & 2033
- Figure 16: South America Liquid Inulin Volume (K), by Application 2025 & 2033
- Figure 17: South America Liquid Inulin Revenue Share (%), by Application 2025 & 2033
- Figure 18: South America Liquid Inulin Volume Share (%), by Application 2025 & 2033
- Figure 19: South America Liquid Inulin Revenue (undefined), by Type 2025 & 2033
- Figure 20: South America Liquid Inulin Volume (K), by Type 2025 & 2033
- Figure 21: South America Liquid Inulin Revenue Share (%), by Type 2025 & 2033
- Figure 22: South America Liquid Inulin Volume Share (%), by Type 2025 & 2033
- Figure 23: South America Liquid Inulin Revenue (undefined), by Country 2025 & 2033
- Figure 24: South America Liquid Inulin Volume (K), by Country 2025 & 2033
- Figure 25: South America Liquid Inulin Revenue Share (%), by Country 2025 & 2033
- Figure 26: South America Liquid Inulin Volume Share (%), by Country 2025 & 2033
- Figure 27: Europe Liquid Inulin Revenue (undefined), by Application 2025 & 2033
- Figure 28: Europe Liquid Inulin Volume (K), by Application 2025 & 2033
- Figure 29: Europe Liquid Inulin Revenue Share (%), by Application 2025 & 2033
- Figure 30: Europe Liquid Inulin Volume Share (%), by Application 2025 & 2033
- Figure 31: Europe Liquid Inulin Revenue (undefined), by Type 2025 & 2033
- Figure 32: Europe Liquid Inulin Volume (K), by Type 2025 & 2033
- Figure 33: Europe Liquid Inulin Revenue Share (%), by Type 2025 & 2033
- Figure 34: Europe Liquid Inulin Volume Share (%), by Type 2025 & 2033
- Figure 35: Europe Liquid Inulin Revenue (undefined), by Country 2025 & 2033
- Figure 36: Europe Liquid Inulin Volume (K), by Country 2025 & 2033
- Figure 37: Europe Liquid Inulin Revenue Share (%), by Country 2025 & 2033
- Figure 38: Europe Liquid Inulin Volume Share (%), by Country 2025 & 2033
- Figure 39: Middle East & Africa Liquid Inulin Revenue (undefined), by Application 2025 & 2033
- Figure 40: Middle East & Africa Liquid Inulin Volume (K), by Application 2025 & 2033
- Figure 41: Middle East & Africa Liquid Inulin Revenue Share (%), by Application 2025 & 2033
- Figure 42: Middle East & Africa Liquid Inulin Volume Share (%), by Application 2025 & 2033
- Figure 43: Middle East & Africa Liquid Inulin Revenue (undefined), by Type 2025 & 2033
- Figure 44: Middle East & Africa Liquid Inulin Volume (K), by Type 2025 & 2033
- Figure 45: Middle East & Africa Liquid Inulin Revenue Share (%), by Type 2025 & 2033
- Figure 46: Middle East & Africa Liquid Inulin Volume Share (%), by Type 2025 & 2033
- Figure 47: Middle East & Africa Liquid Inulin Revenue (undefined), by Country 2025 & 2033
- Figure 48: Middle East & Africa Liquid Inulin Volume (K), by Country 2025 & 2033
- Figure 49: Middle East & Africa Liquid Inulin Revenue Share (%), by Country 2025 & 2033
- Figure 50: Middle East & Africa Liquid Inulin Volume Share (%), by Country 2025 & 2033
- Figure 51: Asia Pacific Liquid Inulin Revenue (undefined), by Application 2025 & 2033
- Figure 52: Asia Pacific Liquid Inulin Volume (K), by Application 2025 & 2033
- Figure 53: Asia Pacific Liquid Inulin Revenue Share (%), by Application 2025 & 2033
- Figure 54: Asia Pacific Liquid Inulin Volume Share (%), by Application 2025 & 2033
- Figure 55: Asia Pacific Liquid Inulin Revenue (undefined), by Type 2025 & 2033
- Figure 56: Asia Pacific Liquid Inulin Volume (K), by Type 2025 & 2033
- Figure 57: Asia Pacific Liquid Inulin Revenue Share (%), by Type 2025 & 2033
- Figure 58: Asia Pacific Liquid Inulin Volume Share (%), by Type 2025 & 2033
- Figure 59: Asia Pacific Liquid Inulin Revenue (undefined), by Country 2025 & 2033
- Figure 60: Asia Pacific Liquid Inulin Volume (K), by Country 2025 & 2033
- Figure 61: Asia Pacific Liquid Inulin Revenue Share (%), by Country 2025 & 2033
- Figure 62: Asia Pacific Liquid Inulin Volume Share (%), by Country 2025 & 2033
List of Tables
- Table 1: Global Liquid Inulin Revenue undefined Forecast, by Application 2020 & 2033
- Table 2: Global Liquid Inulin Volume K Forecast, by Application 2020 & 2033
- Table 3: Global Liquid Inulin Revenue undefined Forecast, by Type 2020 & 2033
- Table 4: Global Liquid Inulin Volume K Forecast, by Type 2020 & 2033
- Table 5: Global Liquid Inulin Revenue undefined Forecast, by Region 2020 & 2033
- Table 6: Global Liquid Inulin Volume K Forecast, by Region 2020 & 2033
- Table 7: Global Liquid Inulin Revenue undefined Forecast, by Application 2020 & 2033
- Table 8: Global Liquid Inulin Volume K Forecast, by Application 2020 & 2033
- Table 9: Global Liquid Inulin Revenue undefined Forecast, by Type 2020 & 2033
- Table 10: Global Liquid Inulin Volume K Forecast, by Type 2020 & 2033
- Table 11: Global Liquid Inulin Revenue undefined Forecast, by Country 2020 & 2033
- Table 12: Global Liquid Inulin Volume K Forecast, by Country 2020 & 2033
- Table 13: United States Liquid Inulin Revenue (undefined) Forecast, by Application 2020 & 2033
- Table 14: United States Liquid Inulin Volume (K) Forecast, by Application 2020 & 2033
- Table 15: Canada Liquid Inulin Revenue (undefined) Forecast, by Application 2020 & 2033
- Table 16: Canada Liquid Inulin Volume (K) Forecast, by Application 2020 & 2033
- Table 17: Mexico Liquid Inulin Revenue (undefined) Forecast, by Application 2020 & 2033
- Table 18: Mexico Liquid Inulin Volume (K) Forecast, by Application 2020 & 2033
- Table 19: Global Liquid Inulin Revenue undefined Forecast, by Application 2020 & 2033
- Table 20: Global Liquid Inulin Volume K Forecast, by Application 2020 & 2033
- Table 21: Global Liquid Inulin Revenue undefined Forecast, by Type 2020 & 2033
- Table 22: Global Liquid Inulin Volume K Forecast, by Type 2020 & 2033
- Table 23: Global Liquid Inulin Revenue undefined Forecast, by Country 2020 & 2033
- Table 24: Global Liquid Inulin Volume K Forecast, by Country 2020 & 2033
- Table 25: Brazil Liquid Inulin Revenue (undefined) Forecast, by Application 2020 & 2033
- Table 26: Brazil Liquid Inulin Volume (K) Forecast, by Application 2020 & 2033
- Table 27: Argentina Liquid Inulin Revenue (undefined) Forecast, by Application 2020 & 2033
- Table 28: Argentina Liquid Inulin Volume (K) Forecast, by Application 2020 & 2033
- Table 29: Rest of South America Liquid Inulin Revenue (undefined) Forecast, by Application 2020 & 2033
- Table 30: Rest of South America Liquid Inulin Volume (K) Forecast, by Application 2020 & 2033
- Table 31: Global Liquid Inulin Revenue undefined Forecast, by Application 2020 & 2033
- Table 32: Global Liquid Inulin Volume K Forecast, by Application 2020 & 2033
- Table 33: Global Liquid Inulin Revenue undefined Forecast, by Type 2020 & 2033
- Table 34: Global Liquid Inulin Volume K Forecast, by Type 2020 & 2033
- Table 35: Global Liquid Inulin Revenue undefined Forecast, by Country 2020 & 2033
- Table 36: Global Liquid Inulin Volume K Forecast, by Country 2020 & 2033
- Table 37: United Kingdom Liquid Inulin Revenue (undefined) Forecast, by Application 2020 & 2033
- Table 38: United Kingdom Liquid Inulin Volume (K) Forecast, by Application 2020 & 2033
- Table 39: Germany Liquid Inulin Revenue (undefined) Forecast, by Application 2020 & 2033
- Table 40: Germany Liquid Inulin Volume (K) Forecast, by Application 2020 & 2033
- Table 41: France Liquid Inulin Revenue (undefined) Forecast, by Application 2020 & 2033
- Table 42: France Liquid Inulin Volume (K) Forecast, by Application 2020 & 2033
- Table 43: Italy Liquid Inulin Revenue (undefined) Forecast, by Application 2020 & 2033
- Table 44: Italy Liquid Inulin Volume (K) Forecast, by Application 2020 & 2033
- Table 45: Spain Liquid Inulin Revenue (undefined) Forecast, by Application 2020 & 2033
- Table 46: Spain Liquid Inulin Volume (K) Forecast, by Application 2020 & 2033
- Table 47: Russia Liquid Inulin Revenue (undefined) Forecast, by Application 2020 & 2033
- Table 48: Russia Liquid Inulin Volume (K) Forecast, by Application 2020 & 2033
- Table 49: Benelux Liquid Inulin Revenue (undefined) Forecast, by Application 2020 & 2033
- Table 50: Benelux Liquid Inulin Volume (K) Forecast, by Application 2020 & 2033
- Table 51: Nordics Liquid Inulin Revenue (undefined) Forecast, by Application 2020 & 2033
- Table 52: Nordics Liquid Inulin Volume (K) Forecast, by Application 2020 & 2033
- Table 53: Rest of Europe Liquid Inulin Revenue (undefined) Forecast, by Application 2020 & 2033
- Table 54: Rest of Europe Liquid Inulin Volume (K) Forecast, by Application 2020 & 2033
- Table 55: Global Liquid Inulin Revenue undefined Forecast, by Application 2020 & 2033
- Table 56: Global Liquid Inulin Volume K Forecast, by Application 2020 & 2033
- Table 57: Global Liquid Inulin Revenue undefined Forecast, by Type 2020 & 2033
- Table 58: Global Liquid Inulin Volume K Forecast, by Type 2020 & 2033
- Table 59: Global Liquid Inulin Revenue undefined Forecast, by Country 2020 & 2033
- Table 60: Global Liquid Inulin Volume K Forecast, by Country 2020 & 2033
- Table 61: Turkey Liquid Inulin Revenue (undefined) Forecast, by Application 2020 & 2033
- Table 62: Turkey Liquid Inulin Volume (K) Forecast, by Application 2020 & 2033
- Table 63: Israel Liquid Inulin Revenue (undefined) Forecast, by Application 2020 & 2033
- Table 64: Israel Liquid Inulin Volume (K) Forecast, by Application 2020 & 2033
- Table 65: GCC Liquid Inulin Revenue (undefined) Forecast, by Application 2020 & 2033
- Table 66: GCC Liquid Inulin Volume (K) Forecast, by Application 2020 & 2033
- Table 67: North Africa Liquid Inulin Revenue (undefined) Forecast, by Application 2020 & 2033
- Table 68: North Africa Liquid Inulin Volume (K) Forecast, by Application 2020 & 2033
- Table 69: South Africa Liquid Inulin Revenue (undefined) Forecast, by Application 2020 & 2033
- Table 70: South Africa Liquid Inulin Volume (K) Forecast, by Application 2020 & 2033
- Table 71: Rest of Middle East & Africa Liquid Inulin Revenue (undefined) Forecast, by Application 2020 & 2033
- Table 72: Rest of Middle East & Africa Liquid Inulin Volume (K) Forecast, by Application 2020 & 2033
- Table 73: Global Liquid Inulin Revenue undefined Forecast, by Application 2020 & 2033
- Table 74: Global Liquid Inulin Volume K Forecast, by Application 2020 & 2033
- Table 75: Global Liquid Inulin Revenue undefined Forecast, by Type 2020 & 2033
- Table 76: Global Liquid Inulin Volume K Forecast, by Type 2020 & 2033
- Table 77: Global Liquid Inulin Revenue undefined Forecast, by Country 2020 & 2033
- Table 78: Global Liquid Inulin Volume K Forecast, by Country 2020 & 2033
- Table 79: China Liquid Inulin Revenue (undefined) Forecast, by Application 2020 & 2033
- Table 80: China Liquid Inulin Volume (K) Forecast, by Application 2020 & 2033
- Table 81: India Liquid Inulin Revenue (undefined) Forecast, by Application 2020 & 2033
- Table 82: India Liquid Inulin Volume (K) Forecast, by Application 2020 & 2033
- Table 83: Japan Liquid Inulin Revenue (undefined) Forecast, by Application 2020 & 2033
- Table 84: Japan Liquid Inulin Volume (K) Forecast, by Application 2020 & 2033
- Table 85: South Korea Liquid Inulin Revenue (undefined) Forecast, by Application 2020 & 2033
- Table 86: South Korea Liquid Inulin Volume (K) Forecast, by Application 2020 & 2033
- Table 87: ASEAN Liquid Inulin Revenue (undefined) Forecast, by Application 2020 & 2033
- Table 88: ASEAN Liquid Inulin Volume (K) Forecast, by Application 2020 & 2033
- Table 89: Oceania Liquid Inulin Revenue (undefined) Forecast, by Application 2020 & 2033
- Table 90: Oceania Liquid Inulin Volume (K) Forecast, by Application 2020 & 2033
- Table 91: Rest of Asia Pacific Liquid Inulin Revenue (undefined) Forecast, by Application 2020 & 2033
- Table 92: Rest of Asia Pacific Liquid Inulin Volume (K) Forecast, by Application 2020 & 2033
Frequently Asked Questions
1. What is the projected Compound Annual Growth Rate (CAGR) of the Liquid Inulin?
The projected CAGR is approximately 2.4%.
2. Which companies are prominent players in the Liquid Inulin?
Key companies in the market include SOSA, Topinambur, PureCircle, Truvia, SweetLeaf, Chongqing Joywinworld, MFCARE, ShangchengBio.
3. What are the main segments of the Liquid Inulin?
The market segments include Application, Type.
4. Can you provide details about the market size?
The market size is estimated to be USD XXX N/A as of 2022.
5. What are some drivers contributing to market growth?
N/A
6. What are the notable trends driving market growth?
N/A
7. Are there any restraints impacting market growth?
N/A
8. Can you provide examples of recent developments in the market?
N/A
9. What pricing options are available for accessing the report?
Pricing options include single-user, multi-user, and enterprise licenses priced at USD 3950.00, USD 5925.00, and USD 7900.00 respectively.
10. Is the market size provided in terms of value or volume?
The market size is provided in terms of value, measured in N/A and volume, measured in K.
11. Are there any specific market keywords associated with the report?
Yes, the market keyword associated with the report is "Liquid Inulin," which aids in identifying and referencing the specific market segment covered.
12. How do I determine which pricing option suits my needs best?
The pricing options vary based on user requirements and access needs. Individual users may opt for single-user licenses, while businesses requiring broader access may choose multi-user or enterprise licenses for cost-effective access to the report.
13. Are there any additional resources or data provided in the Liquid Inulin report?
While the report offers comprehensive insights, it's advisable to review the specific contents or supplementary materials provided to ascertain if additional resources or data are available.
14. How can I stay updated on further developments or reports in the Liquid Inulin?
To stay informed about further developments, trends, and reports in the Liquid Inulin, consider subscribing to industry newsletters, following relevant companies and organizations, or regularly checking reputable industry news sources and publications.
Methodology
Step 1 - Identification of Relevant Samples Size from Population Database


Step 2 - Approaches for Defining Global Market Size (Value, Volume* & Price*)

Note*: In applicable scenarios
Step 3 - Data Sources
Primary Research
- Web Analytics
- Survey Reports
- Research Institute
- Latest Research Reports
- Opinion Leaders
Secondary Research
- Annual Reports
- White Paper
- Latest Press Release
- Industry Association
- Paid Database
- Investor Presentations

Step 4 - Data Triangulation
Involves using different sources of information in order to increase the validity of a study
These sources are likely to be stakeholders in a program - participants, other researchers, program staff, other community members, and so on.
Then we put all data in single framework & apply various statistical tools to find out the dynamic on the market.
During the analysis stage, feedback from the stakeholder groups would be compared to determine areas of agreement as well as areas of divergence