

Key Insights
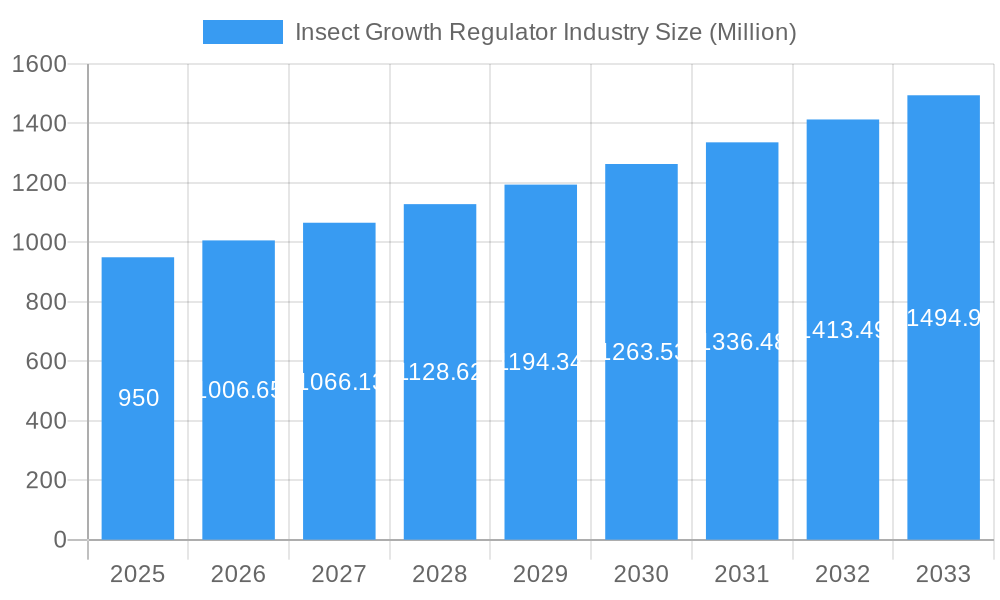
The Insect Growth Regulator (IGR) market, valued at $0.95 billion in 2025, is projected to experience robust growth, exhibiting a Compound Annual Growth Rate (CAGR) of 5.70% from 2025 to 2033. This expansion is driven by several key factors. The increasing prevalence of insect-borne diseases globally fuels demand for effective and environmentally friendly pest control solutions. IGR's targeted approach, minimizing harm to beneficial insects and the environment, makes them increasingly attractive compared to broad-spectrum pesticides. Furthermore, the rising adoption of integrated pest management (IPM) strategies in both agricultural and non-agricultural sectors is significantly boosting IGR market growth. The agricultural sector, particularly in developing economies experiencing expanding farming operations, presents a substantial market opportunity. Conversely, stringent regulatory approvals and the emergence of resistant insect populations pose challenges to market growth.
Insect Growth Regulator Industry Market Size (In Million)
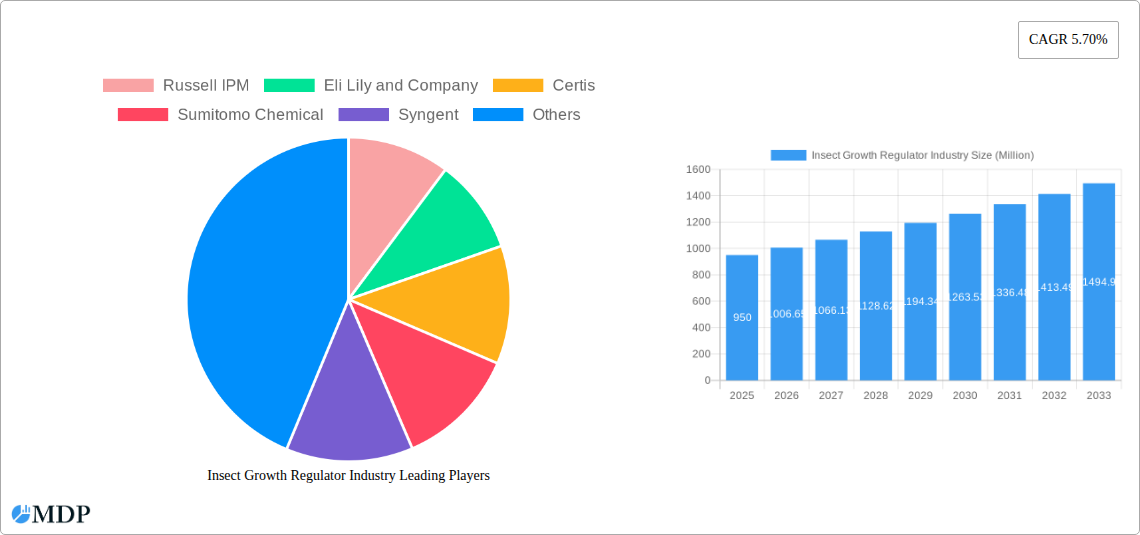
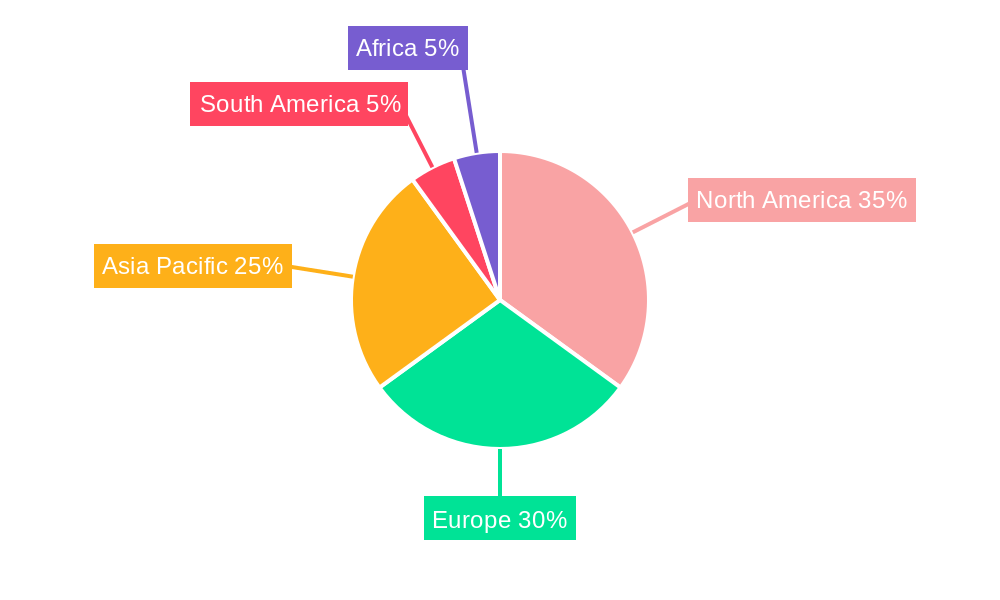
Segment-wise, the bio-control agent segment is experiencing rapid growth due to growing consumer preference for eco-friendly products and increasing awareness about the detrimental effects of chemical pesticides. Within product types, the demand for natural and biological larvicides is witnessing a surge, mirroring the trend towards sustainable pest management practices. Mosquitoes and flies remain the dominant target insects, accounting for a significant portion of the market share due to their public health implications. Geographically, North America and Europe currently hold substantial market share, driven by stringent regulations and high consumer awareness. However, the Asia-Pacific region is expected to experience the fastest growth rate during the forecast period, fueled by rapid agricultural expansion and increasing pest control needs. Companies like Russell IPM, Eli Lilly and Company, Certis, and Sumitomo Chemical are key players leveraging innovation and strategic partnerships to maintain a competitive edge.
Insect Growth Regulator Industry Company Market Share
Insect Growth Regulator Industry: A Comprehensive Market Report (2019-2033)
This comprehensive report provides an in-depth analysis of the Insect Growth Regulator (IGR) industry, offering invaluable insights for stakeholders seeking to navigate this dynamic market. Covering the period from 2019 to 2033, with a focus on 2025, this report delves into market dynamics, leading players, emerging trends, and future growth prospects. The global IGR market is projected to reach xx Million by 2033, exhibiting a compelling CAGR of xx% during the forecast period (2025-2033).
Insect Growth Regulator Industry Market Dynamics & Concentration
The Insect Growth Regulator market is characterized by a moderately concentrated landscape, with key players such as Russell IPM, Eli Lily and Company, Certis, Sumitomo Chemical, Syngenta, Adama, Nufarm, BASF, Central Garden & Pet Co, and Summit Chemical holding significant market share. Market concentration is further influenced by M&A activities, with xx deals recorded between 2019 and 2024. Innovation, particularly in bio-control agents and targeted formulations, is a key driver. Stringent regulatory frameworks concerning pesticide use and environmental concerns shape market dynamics. The presence of substitute pest control methods adds competitive pressure. End-user trends towards sustainable and environmentally friendly solutions are significantly influencing product development and market growth.
- Market Share: The top 5 players account for approximately xx% of the global market.
- M&A Activity: An average of xx M&A deals per year were observed during the historical period (2019-2024), indicating a high level of consolidation.
- Innovation Drivers: Development of novel IGRs with improved efficacy and reduced environmental impact.
- Regulatory Frameworks: Increasingly stringent regulations governing pesticide usage are driving demand for safer and more effective IGRs.
- Product Substitutes: Biological pest control methods and other chemical pesticides present competitive alternatives.
Insect Growth Regulator Industry Industry Trends & Analysis
The Insect Growth Regulator (IGR) market is experiencing robust and accelerating growth, propelled by a confluence of global drivers. A burgeoning world population and the critical imperative for enhanced food security are increasing the demand for efficient and sustainable agricultural practices. Simultaneously, a heightened global awareness regarding the detrimental ecological and health impacts of conventional, broad-spectrum chemical pesticides is actively steering consumers and regulatory bodies towards safer alternatives like IGRs. Technological advancements are at the forefront of this evolution, with significant progress in formulation science and sophisticated delivery systems. These innovations are enabling highly targeted application of IGRs, thereby minimizing off-target environmental exposure, reducing the risk of resistance development, and demonstrably improving pest control efficacy. Consumer preferences are increasingly leaning towards sustainable and eco-friendly pest management solutions, profoundly shaping market dynamics and driving product development. The competitive landscape is characterized by a dynamic interplay of continuous innovation, strategic mergers and acquisitions aimed at consolidating market share and expanding technological capabilities, and collaborative partnerships designed to leverage complementary expertise. The market's Compound Annual Growth Rate (CAGR) during the forecast period is conservatively estimated at around XX%, underscoring substantial and sustained growth potential. While the agriculture sector currently represents the primary market for IGRs, with an estimated penetration of approximately XX%, there is significant and rapidly expanding scope for their application in diverse non-agricultural segments, including public health, animal health, and stored product protection.
Leading Markets & Segments in Insect Growth Regulator Industry
The agriculture sector currently dominates the IGR market, accounting for approximately xx% of the total revenue. Within this sector, the use of chemical agents is prevalent, while the demand for bio-control agents is steadily increasing. Geographically, North America and Europe are leading markets due to stringent regulations and high awareness of sustainable pest management practices. Asia Pacific is projected to witness significant growth driven by increasing agricultural production and rising demand for food security.
- Dominant Region: North America, followed by Europe and Asia Pacific.
- Key Drivers (Agriculture): Growing food demand, stringent pesticide regulations, and increased awareness of sustainable agriculture practices.
- Key Drivers (Non-Agriculture): Rising concerns about public health and the need for effective mosquito and fly control in urban areas.
- Dominant Product Type: Synthetic larvicides.
- Dominant Target Insect: Mosquitoes, due to their association with vector-borne diseases.
Insect Growth Regulator Industry Product Developments
Recent product innovations in the IGR sector are sharply focused on delivering enhanced efficacy, pioneering targeted delivery systems, and achieving a demonstrably reduced environmental footprint. Leading companies are actively investing in the research and development of IGRs that exhibit improved biodegradability profiles, thereby minimizing their persistence in the environment, and possess significantly lower toxicity to non-target organisms, including beneficial insects and wildlife. Furthermore, novel formulations are being engineered for superior compatibility and synergistic action with an array of other integrated pest management (IPM) strategies, including biological controls and conventional chemistries. These cutting-edge advancements are not only improving the market fit of IGR products but are also directly addressing the escalating global demand for pest management solutions that are both highly effective and fundamentally sustainable.
Key Drivers of Insect Growth Regulator Industry Growth
Technological advancements in formulation and delivery systems, coupled with stringent regulations on traditional pesticides, are significant growth drivers. The rising global population and increasing demand for food security further fuel market growth. Economic factors, such as increased investment in agricultural technology, are also contributing to the expanding IGR market.
Challenges in the Insect Growth Regulator Industry Market
The Insect Growth Regulator industry navigates several significant challenges that can impact market growth and profitability. Stringent regulatory hurdles, particularly concerning the complex and lengthy pesticide registration and approval processes in various regions, present a substantial barrier to market entry and product lifecycle management. Disruptions within global supply chains, coupled with the inherent price volatility of key raw materials, can significantly impact manufacturing costs and overall profitability. The competitive landscape remains intense, with established manufacturers of conventional chemical pesticides posing a continuous challenge, alongside the emergence and growth of innovative biocontrol companies offering alternative pest management solutions. The cumulative impact of these multifaceted challenges on overall market growth is estimated to result in an annual economic impediment of approximately XX Million.
Emerging Opportunities in Insect Growth Regulator Industry
The Insect Growth Regulator industry is poised for significant expansion fueled by a range of exciting emerging opportunities. Technological breakthroughs in precision application technologies, such as drone-based spraying and variable rate application systems, offer unprecedented opportunities for more efficient and targeted deployment of IGRs, maximizing efficacy while minimizing environmental impact. The ongoing development of novel IGRs with enhanced specificity and improved efficacy against a wider spectrum of pest species presents lucrative avenues for market penetration and differentiation. Strategic partnerships and collaborative ventures between established chemical companies and cutting-edge biotechnology firms are proving instrumental in accelerating innovation cycles and expanding market reach into new territories and applications. Furthermore, the burgeoning demand for sustainable and environmentally responsible pest management solutions in rapidly developing economies presents substantial long-term growth potential, as these regions increasingly adopt advanced agricultural and public health practices.
Leading Players in the Insect Growth Regulator Industry Sector
- Russell IPM
- Eli Lilly and Company
- Certis Europe B.V.
- Sumitomo Chemical Co., Ltd.
- Syngenta AG
- Adama Ltd.
- Nufarm Limited
- BASF SE
- Central Garden & Pet Company
- Summit Chemical Company
Key Milestones in Insect Growth Regulator Industry Industry
- 2020: Launch of a new generation of environmentally friendly IGR by [Company Name].
- 2021: Acquisition of [Company A] by [Company B], leading to expanded market share.
- 2022: Introduction of stringent regulations on chemical pesticides in [Region], boosting demand for IGRs.
- 2023: Successful field trials of a novel biocontrol agent for [Target Insect] demonstrate high efficacy.
- 2024: A major partnership between [Company C] and [Research Institution] results in the development of a more effective and safer formulation.
Strategic Outlook for Insect Growth Regulator Industry Market
The Insect Growth Regulator market is poised for significant growth, driven by several factors, including increasing demand for sustainable pest management solutions, technological advancements, and stringent environmental regulations. Strategic partnerships, mergers and acquisitions, and focused research and development efforts will further shape industry dynamics. The long-term outlook for the IGR market is very positive, with sustained growth expected throughout the forecast period.
Insect Growth Regulator Industry Segmentation
-
1. Application
- 1.1. Agriculture
- 1.2. Non-agriculture
-
2. Control Method
- 2.1. Bio Control Agent
- 2.2. Chemical Agent
- 2.3. Insect Growth Regulator
-
3. Product Type
- 3.1. Synthetic Larvicides
- 3.2. Natural Larvicides
- 3.3. Biological Larvicides
-
4. Target Insect
- 4.1. Mosquitoes
- 4.2. Flies
- 4.3. Other Target Insects
-
5. Application
- 5.1. Agriculture
- 5.2. Non-agriculture
-
6. Control Method
- 6.1. Bio Control Agent
- 6.2. Chemical Agent
- 6.3. Insect Growth Regulator
-
7. Product Type
- 7.1. Synthetic Larvicides
- 7.2. Natural Larvicides
- 7.3. Biological Larvicides
-
8. Target Insect
- 8.1. Mosquitoes
- 8.2. Flies
- 8.3. Other Target Insects
Insect Growth Regulator Industry Segmentation By Geography
-
1. North America
- 1.1. United States
- 1.2. Canada
- 1.3. Mexico
- 1.4. Rest of North America
-
2. Europe
- 2.1. Germany
- 2.2. United Kingdom
- 2.3. France
- 2.4. Russia
- 2.5. Spain
- 2.6. Rest of Europe
-
3. Asia Pacific
- 3.1. India
- 3.2. China
- 3.3. Japan
- 3.4. Rest of the Asia Pacific
-
4. South America
- 4.1. Brazil
- 4.2. Argentina
- 4.3. Rest of South America
-
5. Africa
- 5.1. South Africa
- 5.2. Rest of Africa
Insect Growth Regulator Industry Regional Market Share
Geographic Coverage of Insect Growth Regulator Industry
Insect Growth Regulator Industry REPORT HIGHLIGHTS
| Aspects | Details |
|---|---|
| Study Period | 2020-2034 |
| Base Year | 2025 |
| Estimated Year | 2026 |
| Forecast Period | 2026-2034 |
| Historical Period | 2020-2025 |
| Growth Rate | CAGR of 5.70% from 2020-2034 |
| Segmentation |
|
Table of Contents
- 1. Introduction
- 1.1. Research Scope
- 1.2. Market Segmentation
- 1.3. Research Methodology
- 1.4. Definitions and Assumptions
- 2. Executive Summary
- 2.1. Introduction
- 3. Market Dynamics
- 3.1. Introduction
- 3.2. Market Drivers
- 3.2.1. Seed Treatment As A Solution To Enhance Yield; Growing Awareness For Seed Treatment Among The Farmers; Rising Trend Of Organic Farming
- 3.3. Market Restrains
- 3.3.1. Limitations Across Farm-Level Seed Treatment; Rising Environmental Concerns
- 3.4. Market Trends
- 3.4.1. Mosquito-borne Diseases Drive the Larvicides Market
- 4. Market Factor Analysis
- 4.1. Porters Five Forces
- 4.2. Supply/Value Chain
- 4.3. PESTEL analysis
- 4.4. Market Entropy
- 4.5. Patent/Trademark Analysis
- 5. Global Insect Growth Regulator Industry Analysis, Insights and Forecast, 2020-2032
- 5.1. Market Analysis, Insights and Forecast - by Application
- 5.1.1. Agriculture
- 5.1.2. Non-agriculture
- 5.2. Market Analysis, Insights and Forecast - by Control Method
- 5.2.1. Bio Control Agent
- 5.2.2. Chemical Agent
- 5.2.3. Insect Growth Regulator
- 5.3. Market Analysis, Insights and Forecast - by Product Type
- 5.3.1. Synthetic Larvicides
- 5.3.2. Natural Larvicides
- 5.3.3. Biological Larvicides
- 5.4. Market Analysis, Insights and Forecast - by Target Insect
- 5.4.1. Mosquitoes
- 5.4.2. Flies
- 5.4.3. Other Target Insects
- 5.5. Market Analysis, Insights and Forecast - by Application
- 5.5.1. Agriculture
- 5.5.2. Non-agriculture
- 5.6. Market Analysis, Insights and Forecast - by Control Method
- 5.6.1. Bio Control Agent
- 5.6.2. Chemical Agent
- 5.6.3. Insect Growth Regulator
- 5.7. Market Analysis, Insights and Forecast - by Product Type
- 5.7.1. Synthetic Larvicides
- 5.7.2. Natural Larvicides
- 5.7.3. Biological Larvicides
- 5.8. Market Analysis, Insights and Forecast - by Target Insect
- 5.8.1. Mosquitoes
- 5.8.2. Flies
- 5.8.3. Other Target Insects
- 5.9. Market Analysis, Insights and Forecast - by Region
- 5.9.1. North America
- 5.9.2. Europe
- 5.9.3. Asia Pacific
- 5.9.4. South America
- 5.9.5. Africa
- 5.1. Market Analysis, Insights and Forecast - by Application
- 6. North America Insect Growth Regulator Industry Analysis, Insights and Forecast, 2020-2032
- 6.1. Market Analysis, Insights and Forecast - by Application
- 6.1.1. Agriculture
- 6.1.2. Non-agriculture
- 6.2. Market Analysis, Insights and Forecast - by Control Method
- 6.2.1. Bio Control Agent
- 6.2.2. Chemical Agent
- 6.2.3. Insect Growth Regulator
- 6.3. Market Analysis, Insights and Forecast - by Product Type
- 6.3.1. Synthetic Larvicides
- 6.3.2. Natural Larvicides
- 6.3.3. Biological Larvicides
- 6.4. Market Analysis, Insights and Forecast - by Target Insect
- 6.4.1. Mosquitoes
- 6.4.2. Flies
- 6.4.3. Other Target Insects
- 6.5. Market Analysis, Insights and Forecast - by Application
- 6.5.1. Agriculture
- 6.5.2. Non-agriculture
- 6.6. Market Analysis, Insights and Forecast - by Control Method
- 6.6.1. Bio Control Agent
- 6.6.2. Chemical Agent
- 6.6.3. Insect Growth Regulator
- 6.7. Market Analysis, Insights and Forecast - by Product Type
- 6.7.1. Synthetic Larvicides
- 6.7.2. Natural Larvicides
- 6.7.3. Biological Larvicides
- 6.8. Market Analysis, Insights and Forecast - by Target Insect
- 6.8.1. Mosquitoes
- 6.8.2. Flies
- 6.8.3. Other Target Insects
- 6.1. Market Analysis, Insights and Forecast - by Application
- 7. Europe Insect Growth Regulator Industry Analysis, Insights and Forecast, 2020-2032
- 7.1. Market Analysis, Insights and Forecast - by Application
- 7.1.1. Agriculture
- 7.1.2. Non-agriculture
- 7.2. Market Analysis, Insights and Forecast - by Control Method
- 7.2.1. Bio Control Agent
- 7.2.2. Chemical Agent
- 7.2.3. Insect Growth Regulator
- 7.3. Market Analysis, Insights and Forecast - by Product Type
- 7.3.1. Synthetic Larvicides
- 7.3.2. Natural Larvicides
- 7.3.3. Biological Larvicides
- 7.4. Market Analysis, Insights and Forecast - by Target Insect
- 7.4.1. Mosquitoes
- 7.4.2. Flies
- 7.4.3. Other Target Insects
- 7.5. Market Analysis, Insights and Forecast - by Application
- 7.5.1. Agriculture
- 7.5.2. Non-agriculture
- 7.6. Market Analysis, Insights and Forecast - by Control Method
- 7.6.1. Bio Control Agent
- 7.6.2. Chemical Agent
- 7.6.3. Insect Growth Regulator
- 7.7. Market Analysis, Insights and Forecast - by Product Type
- 7.7.1. Synthetic Larvicides
- 7.7.2. Natural Larvicides
- 7.7.3. Biological Larvicides
- 7.8. Market Analysis, Insights and Forecast - by Target Insect
- 7.8.1. Mosquitoes
- 7.8.2. Flies
- 7.8.3. Other Target Insects
- 7.1. Market Analysis, Insights and Forecast - by Application
- 8. Asia Pacific Insect Growth Regulator Industry Analysis, Insights and Forecast, 2020-2032
- 8.1. Market Analysis, Insights and Forecast - by Application
- 8.1.1. Agriculture
- 8.1.2. Non-agriculture
- 8.2. Market Analysis, Insights and Forecast - by Control Method
- 8.2.1. Bio Control Agent
- 8.2.2. Chemical Agent
- 8.2.3. Insect Growth Regulator
- 8.3. Market Analysis, Insights and Forecast - by Product Type
- 8.3.1. Synthetic Larvicides
- 8.3.2. Natural Larvicides
- 8.3.3. Biological Larvicides
- 8.4. Market Analysis, Insights and Forecast - by Target Insect
- 8.4.1. Mosquitoes
- 8.4.2. Flies
- 8.4.3. Other Target Insects
- 8.5. Market Analysis, Insights and Forecast - by Application
- 8.5.1. Agriculture
- 8.5.2. Non-agriculture
- 8.6. Market Analysis, Insights and Forecast - by Control Method
- 8.6.1. Bio Control Agent
- 8.6.2. Chemical Agent
- 8.6.3. Insect Growth Regulator
- 8.7. Market Analysis, Insights and Forecast - by Product Type
- 8.7.1. Synthetic Larvicides
- 8.7.2. Natural Larvicides
- 8.7.3. Biological Larvicides
- 8.8. Market Analysis, Insights and Forecast - by Target Insect
- 8.8.1. Mosquitoes
- 8.8.2. Flies
- 8.8.3. Other Target Insects
- 8.1. Market Analysis, Insights and Forecast - by Application
- 9. South America Insect Growth Regulator Industry Analysis, Insights and Forecast, 2020-2032
- 9.1. Market Analysis, Insights and Forecast - by Application
- 9.1.1. Agriculture
- 9.1.2. Non-agriculture
- 9.2. Market Analysis, Insights and Forecast - by Control Method
- 9.2.1. Bio Control Agent
- 9.2.2. Chemical Agent
- 9.2.3. Insect Growth Regulator
- 9.3. Market Analysis, Insights and Forecast - by Product Type
- 9.3.1. Synthetic Larvicides
- 9.3.2. Natural Larvicides
- 9.3.3. Biological Larvicides
- 9.4. Market Analysis, Insights and Forecast - by Target Insect
- 9.4.1. Mosquitoes
- 9.4.2. Flies
- 9.4.3. Other Target Insects
- 9.5. Market Analysis, Insights and Forecast - by Application
- 9.5.1. Agriculture
- 9.5.2. Non-agriculture
- 9.6. Market Analysis, Insights and Forecast - by Control Method
- 9.6.1. Bio Control Agent
- 9.6.2. Chemical Agent
- 9.6.3. Insect Growth Regulator
- 9.7. Market Analysis, Insights and Forecast - by Product Type
- 9.7.1. Synthetic Larvicides
- 9.7.2. Natural Larvicides
- 9.7.3. Biological Larvicides
- 9.8. Market Analysis, Insights and Forecast - by Target Insect
- 9.8.1. Mosquitoes
- 9.8.2. Flies
- 9.8.3. Other Target Insects
- 9.1. Market Analysis, Insights and Forecast - by Application
- 10. Africa Insect Growth Regulator Industry Analysis, Insights and Forecast, 2020-2032
- 10.1. Market Analysis, Insights and Forecast - by Application
- 10.1.1. Agriculture
- 10.1.2. Non-agriculture
- 10.2. Market Analysis, Insights and Forecast - by Control Method
- 10.2.1. Bio Control Agent
- 10.2.2. Chemical Agent
- 10.2.3. Insect Growth Regulator
- 10.3. Market Analysis, Insights and Forecast - by Product Type
- 10.3.1. Synthetic Larvicides
- 10.3.2. Natural Larvicides
- 10.3.3. Biological Larvicides
- 10.4. Market Analysis, Insights and Forecast - by Target Insect
- 10.4.1. Mosquitoes
- 10.4.2. Flies
- 10.4.3. Other Target Insects
- 10.5. Market Analysis, Insights and Forecast - by Application
- 10.5.1. Agriculture
- 10.5.2. Non-agriculture
- 10.6. Market Analysis, Insights and Forecast - by Control Method
- 10.6.1. Bio Control Agent
- 10.6.2. Chemical Agent
- 10.6.3. Insect Growth Regulator
- 10.7. Market Analysis, Insights and Forecast - by Product Type
- 10.7.1. Synthetic Larvicides
- 10.7.2. Natural Larvicides
- 10.7.3. Biological Larvicides
- 10.8. Market Analysis, Insights and Forecast - by Target Insect
- 10.8.1. Mosquitoes
- 10.8.2. Flies
- 10.8.3. Other Target Insects
- 10.1. Market Analysis, Insights and Forecast - by Application
- 11. Competitive Analysis
- 11.1. Global Market Share Analysis 2025
- 11.2. Company Profiles
- 11.2.1 Russell IPM
- 11.2.1.1. Overview
- 11.2.1.2. Products
- 11.2.1.3. SWOT Analysis
- 11.2.1.4. Recent Developments
- 11.2.1.5. Financials (Based on Availability)
- 11.2.2 Eli Lily and Company
- 11.2.2.1. Overview
- 11.2.2.2. Products
- 11.2.2.3. SWOT Analysis
- 11.2.2.4. Recent Developments
- 11.2.2.5. Financials (Based on Availability)
- 11.2.3 Certis
- 11.2.3.1. Overview
- 11.2.3.2. Products
- 11.2.3.3. SWOT Analysis
- 11.2.3.4. Recent Developments
- 11.2.3.5. Financials (Based on Availability)
- 11.2.4 Sumitomo Chemical
- 11.2.4.1. Overview
- 11.2.4.2. Products
- 11.2.4.3. SWOT Analysis
- 11.2.4.4. Recent Developments
- 11.2.4.5. Financials (Based on Availability)
- 11.2.5 Syngent
- 11.2.5.1. Overview
- 11.2.5.2. Products
- 11.2.5.3. SWOT Analysis
- 11.2.5.4. Recent Developments
- 11.2.5.5. Financials (Based on Availability)
- 11.2.6 Adama
- 11.2.6.1. Overview
- 11.2.6.2. Products
- 11.2.6.3. SWOT Analysis
- 11.2.6.4. Recent Developments
- 11.2.6.5. Financials (Based on Availability)
- 11.2.7 Nufarm
- 11.2.7.1. Overview
- 11.2.7.2. Products
- 11.2.7.3. SWOT Analysis
- 11.2.7.4. Recent Developments
- 11.2.7.5. Financials (Based on Availability)
- 11.2.8 BASF
- 11.2.8.1. Overview
- 11.2.8.2. Products
- 11.2.8.3. SWOT Analysis
- 11.2.8.4. Recent Developments
- 11.2.8.5. Financials (Based on Availability)
- 11.2.9 Central Garden & Pet Co
- 11.2.9.1. Overview
- 11.2.9.2. Products
- 11.2.9.3. SWOT Analysis
- 11.2.9.4. Recent Developments
- 11.2.9.5. Financials (Based on Availability)
- 11.2.10 Summit Chemical
- 11.2.10.1. Overview
- 11.2.10.2. Products
- 11.2.10.3. SWOT Analysis
- 11.2.10.4. Recent Developments
- 11.2.10.5. Financials (Based on Availability)
- 11.2.1 Russell IPM
List of Figures
- Figure 1: Global Insect Growth Regulator Industry Revenue Breakdown (Million, %) by Region 2025 & 2033
- Figure 2: Global Insect Growth Regulator Industry Volume Breakdown (Kiloton, %) by Region 2025 & 2033
- Figure 3: North America Insect Growth Regulator Industry Revenue (Million), by Application 2025 & 2033
- Figure 4: North America Insect Growth Regulator Industry Volume (Kiloton), by Application 2025 & 2033
- Figure 5: North America Insect Growth Regulator Industry Revenue Share (%), by Application 2025 & 2033
- Figure 6: North America Insect Growth Regulator Industry Volume Share (%), by Application 2025 & 2033
- Figure 7: North America Insect Growth Regulator Industry Revenue (Million), by Control Method 2025 & 2033
- Figure 8: North America Insect Growth Regulator Industry Volume (Kiloton), by Control Method 2025 & 2033
- Figure 9: North America Insect Growth Regulator Industry Revenue Share (%), by Control Method 2025 & 2033
- Figure 10: North America Insect Growth Regulator Industry Volume Share (%), by Control Method 2025 & 2033
- Figure 11: North America Insect Growth Regulator Industry Revenue (Million), by Product Type 2025 & 2033
- Figure 12: North America Insect Growth Regulator Industry Volume (Kiloton), by Product Type 2025 & 2033
- Figure 13: North America Insect Growth Regulator Industry Revenue Share (%), by Product Type 2025 & 2033
- Figure 14: North America Insect Growth Regulator Industry Volume Share (%), by Product Type 2025 & 2033
- Figure 15: North America Insect Growth Regulator Industry Revenue (Million), by Target Insect 2025 & 2033
- Figure 16: North America Insect Growth Regulator Industry Volume (Kiloton), by Target Insect 2025 & 2033
- Figure 17: North America Insect Growth Regulator Industry Revenue Share (%), by Target Insect 2025 & 2033
- Figure 18: North America Insect Growth Regulator Industry Volume Share (%), by Target Insect 2025 & 2033
- Figure 19: North America Insect Growth Regulator Industry Revenue (Million), by Application 2025 & 2033
- Figure 20: North America Insect Growth Regulator Industry Volume (Kiloton), by Application 2025 & 2033
- Figure 21: North America Insect Growth Regulator Industry Revenue Share (%), by Application 2025 & 2033
- Figure 22: North America Insect Growth Regulator Industry Volume Share (%), by Application 2025 & 2033
- Figure 23: North America Insect Growth Regulator Industry Revenue (Million), by Control Method 2025 & 2033
- Figure 24: North America Insect Growth Regulator Industry Volume (Kiloton), by Control Method 2025 & 2033
- Figure 25: North America Insect Growth Regulator Industry Revenue Share (%), by Control Method 2025 & 2033
- Figure 26: North America Insect Growth Regulator Industry Volume Share (%), by Control Method 2025 & 2033
- Figure 27: North America Insect Growth Regulator Industry Revenue (Million), by Product Type 2025 & 2033
- Figure 28: North America Insect Growth Regulator Industry Volume (Kiloton), by Product Type 2025 & 2033
- Figure 29: North America Insect Growth Regulator Industry Revenue Share (%), by Product Type 2025 & 2033
- Figure 30: North America Insect Growth Regulator Industry Volume Share (%), by Product Type 2025 & 2033
- Figure 31: North America Insect Growth Regulator Industry Revenue (Million), by Target Insect 2025 & 2033
- Figure 32: North America Insect Growth Regulator Industry Volume (Kiloton), by Target Insect 2025 & 2033
- Figure 33: North America Insect Growth Regulator Industry Revenue Share (%), by Target Insect 2025 & 2033
- Figure 34: North America Insect Growth Regulator Industry Volume Share (%), by Target Insect 2025 & 2033
- Figure 35: North America Insect Growth Regulator Industry Revenue (Million), by Country 2025 & 2033
- Figure 36: North America Insect Growth Regulator Industry Volume (Kiloton), by Country 2025 & 2033
- Figure 37: North America Insect Growth Regulator Industry Revenue Share (%), by Country 2025 & 2033
- Figure 38: North America Insect Growth Regulator Industry Volume Share (%), by Country 2025 & 2033
- Figure 39: Europe Insect Growth Regulator Industry Revenue (Million), by Application 2025 & 2033
- Figure 40: Europe Insect Growth Regulator Industry Volume (Kiloton), by Application 2025 & 2033
- Figure 41: Europe Insect Growth Regulator Industry Revenue Share (%), by Application 2025 & 2033
- Figure 42: Europe Insect Growth Regulator Industry Volume Share (%), by Application 2025 & 2033
- Figure 43: Europe Insect Growth Regulator Industry Revenue (Million), by Control Method 2025 & 2033
- Figure 44: Europe Insect Growth Regulator Industry Volume (Kiloton), by Control Method 2025 & 2033
- Figure 45: Europe Insect Growth Regulator Industry Revenue Share (%), by Control Method 2025 & 2033
- Figure 46: Europe Insect Growth Regulator Industry Volume Share (%), by Control Method 2025 & 2033
- Figure 47: Europe Insect Growth Regulator Industry Revenue (Million), by Product Type 2025 & 2033
- Figure 48: Europe Insect Growth Regulator Industry Volume (Kiloton), by Product Type 2025 & 2033
- Figure 49: Europe Insect Growth Regulator Industry Revenue Share (%), by Product Type 2025 & 2033
- Figure 50: Europe Insect Growth Regulator Industry Volume Share (%), by Product Type 2025 & 2033
- Figure 51: Europe Insect Growth Regulator Industry Revenue (Million), by Target Insect 2025 & 2033
- Figure 52: Europe Insect Growth Regulator Industry Volume (Kiloton), by Target Insect 2025 & 2033
- Figure 53: Europe Insect Growth Regulator Industry Revenue Share (%), by Target Insect 2025 & 2033
- Figure 54: Europe Insect Growth Regulator Industry Volume Share (%), by Target Insect 2025 & 2033
- Figure 55: Europe Insect Growth Regulator Industry Revenue (Million), by Application 2025 & 2033
- Figure 56: Europe Insect Growth Regulator Industry Volume (Kiloton), by Application 2025 & 2033
- Figure 57: Europe Insect Growth Regulator Industry Revenue Share (%), by Application 2025 & 2033
- Figure 58: Europe Insect Growth Regulator Industry Volume Share (%), by Application 2025 & 2033
- Figure 59: Europe Insect Growth Regulator Industry Revenue (Million), by Control Method 2025 & 2033
- Figure 60: Europe Insect Growth Regulator Industry Volume (Kiloton), by Control Method 2025 & 2033
- Figure 61: Europe Insect Growth Regulator Industry Revenue Share (%), by Control Method 2025 & 2033
- Figure 62: Europe Insect Growth Regulator Industry Volume Share (%), by Control Method 2025 & 2033
- Figure 63: Europe Insect Growth Regulator Industry Revenue (Million), by Product Type 2025 & 2033
- Figure 64: Europe Insect Growth Regulator Industry Volume (Kiloton), by Product Type 2025 & 2033
- Figure 65: Europe Insect Growth Regulator Industry Revenue Share (%), by Product Type 2025 & 2033
- Figure 66: Europe Insect Growth Regulator Industry Volume Share (%), by Product Type 2025 & 2033
- Figure 67: Europe Insect Growth Regulator Industry Revenue (Million), by Target Insect 2025 & 2033
- Figure 68: Europe Insect Growth Regulator Industry Volume (Kiloton), by Target Insect 2025 & 2033
- Figure 69: Europe Insect Growth Regulator Industry Revenue Share (%), by Target Insect 2025 & 2033
- Figure 70: Europe Insect Growth Regulator Industry Volume Share (%), by Target Insect 2025 & 2033
- Figure 71: Europe Insect Growth Regulator Industry Revenue (Million), by Country 2025 & 2033
- Figure 72: Europe Insect Growth Regulator Industry Volume (Kiloton), by Country 2025 & 2033
- Figure 73: Europe Insect Growth Regulator Industry Revenue Share (%), by Country 2025 & 2033
- Figure 74: Europe Insect Growth Regulator Industry Volume Share (%), by Country 2025 & 2033
- Figure 75: Asia Pacific Insect Growth Regulator Industry Revenue (Million), by Application 2025 & 2033
- Figure 76: Asia Pacific Insect Growth Regulator Industry Volume (Kiloton), by Application 2025 & 2033
- Figure 77: Asia Pacific Insect Growth Regulator Industry Revenue Share (%), by Application 2025 & 2033
- Figure 78: Asia Pacific Insect Growth Regulator Industry Volume Share (%), by Application 2025 & 2033
- Figure 79: Asia Pacific Insect Growth Regulator Industry Revenue (Million), by Control Method 2025 & 2033
- Figure 80: Asia Pacific Insect Growth Regulator Industry Volume (Kiloton), by Control Method 2025 & 2033
- Figure 81: Asia Pacific Insect Growth Regulator Industry Revenue Share (%), by Control Method 2025 & 2033
- Figure 82: Asia Pacific Insect Growth Regulator Industry Volume Share (%), by Control Method 2025 & 2033
- Figure 83: Asia Pacific Insect Growth Regulator Industry Revenue (Million), by Product Type 2025 & 2033
- Figure 84: Asia Pacific Insect Growth Regulator Industry Volume (Kiloton), by Product Type 2025 & 2033
- Figure 85: Asia Pacific Insect Growth Regulator Industry Revenue Share (%), by Product Type 2025 & 2033
- Figure 86: Asia Pacific Insect Growth Regulator Industry Volume Share (%), by Product Type 2025 & 2033
- Figure 87: Asia Pacific Insect Growth Regulator Industry Revenue (Million), by Target Insect 2025 & 2033
- Figure 88: Asia Pacific Insect Growth Regulator Industry Volume (Kiloton), by Target Insect 2025 & 2033
- Figure 89: Asia Pacific Insect Growth Regulator Industry Revenue Share (%), by Target Insect 2025 & 2033
- Figure 90: Asia Pacific Insect Growth Regulator Industry Volume Share (%), by Target Insect 2025 & 2033
- Figure 91: Asia Pacific Insect Growth Regulator Industry Revenue (Million), by Application 2025 & 2033
- Figure 92: Asia Pacific Insect Growth Regulator Industry Volume (Kiloton), by Application 2025 & 2033
- Figure 93: Asia Pacific Insect Growth Regulator Industry Revenue Share (%), by Application 2025 & 2033
- Figure 94: Asia Pacific Insect Growth Regulator Industry Volume Share (%), by Application 2025 & 2033
- Figure 95: Asia Pacific Insect Growth Regulator Industry Revenue (Million), by Control Method 2025 & 2033
- Figure 96: Asia Pacific Insect Growth Regulator Industry Volume (Kiloton), by Control Method 2025 & 2033
- Figure 97: Asia Pacific Insect Growth Regulator Industry Revenue Share (%), by Control Method 2025 & 2033
- Figure 98: Asia Pacific Insect Growth Regulator Industry Volume Share (%), by Control Method 2025 & 2033
- Figure 99: Asia Pacific Insect Growth Regulator Industry Revenue (Million), by Product Type 2025 & 2033
- Figure 100: Asia Pacific Insect Growth Regulator Industry Volume (Kiloton), by Product Type 2025 & 2033
- Figure 101: Asia Pacific Insect Growth Regulator Industry Revenue Share (%), by Product Type 2025 & 2033
- Figure 102: Asia Pacific Insect Growth Regulator Industry Volume Share (%), by Product Type 2025 & 2033
- Figure 103: Asia Pacific Insect Growth Regulator Industry Revenue (Million), by Target Insect 2025 & 2033
- Figure 104: Asia Pacific Insect Growth Regulator Industry Volume (Kiloton), by Target Insect 2025 & 2033
- Figure 105: Asia Pacific Insect Growth Regulator Industry Revenue Share (%), by Target Insect 2025 & 2033
- Figure 106: Asia Pacific Insect Growth Regulator Industry Volume Share (%), by Target Insect 2025 & 2033
- Figure 107: Asia Pacific Insect Growth Regulator Industry Revenue (Million), by Country 2025 & 2033
- Figure 108: Asia Pacific Insect Growth Regulator Industry Volume (Kiloton), by Country 2025 & 2033
- Figure 109: Asia Pacific Insect Growth Regulator Industry Revenue Share (%), by Country 2025 & 2033
- Figure 110: Asia Pacific Insect Growth Regulator Industry Volume Share (%), by Country 2025 & 2033
- Figure 111: South America Insect Growth Regulator Industry Revenue (Million), by Application 2025 & 2033
- Figure 112: South America Insect Growth Regulator Industry Volume (Kiloton), by Application 2025 & 2033
- Figure 113: South America Insect Growth Regulator Industry Revenue Share (%), by Application 2025 & 2033
- Figure 114: South America Insect Growth Regulator Industry Volume Share (%), by Application 2025 & 2033
- Figure 115: South America Insect Growth Regulator Industry Revenue (Million), by Control Method 2025 & 2033
- Figure 116: South America Insect Growth Regulator Industry Volume (Kiloton), by Control Method 2025 & 2033
- Figure 117: South America Insect Growth Regulator Industry Revenue Share (%), by Control Method 2025 & 2033
- Figure 118: South America Insect Growth Regulator Industry Volume Share (%), by Control Method 2025 & 2033
- Figure 119: South America Insect Growth Regulator Industry Revenue (Million), by Product Type 2025 & 2033
- Figure 120: South America Insect Growth Regulator Industry Volume (Kiloton), by Product Type 2025 & 2033
- Figure 121: South America Insect Growth Regulator Industry Revenue Share (%), by Product Type 2025 & 2033
- Figure 122: South America Insect Growth Regulator Industry Volume Share (%), by Product Type 2025 & 2033
- Figure 123: South America Insect Growth Regulator Industry Revenue (Million), by Target Insect 2025 & 2033
- Figure 124: South America Insect Growth Regulator Industry Volume (Kiloton), by Target Insect 2025 & 2033
- Figure 125: South America Insect Growth Regulator Industry Revenue Share (%), by Target Insect 2025 & 2033
- Figure 126: South America Insect Growth Regulator Industry Volume Share (%), by Target Insect 2025 & 2033
- Figure 127: South America Insect Growth Regulator Industry Revenue (Million), by Application 2025 & 2033
- Figure 128: South America Insect Growth Regulator Industry Volume (Kiloton), by Application 2025 & 2033
- Figure 129: South America Insect Growth Regulator Industry Revenue Share (%), by Application 2025 & 2033
- Figure 130: South America Insect Growth Regulator Industry Volume Share (%), by Application 2025 & 2033
- Figure 131: South America Insect Growth Regulator Industry Revenue (Million), by Control Method 2025 & 2033
- Figure 132: South America Insect Growth Regulator Industry Volume (Kiloton), by Control Method 2025 & 2033
- Figure 133: South America Insect Growth Regulator Industry Revenue Share (%), by Control Method 2025 & 2033
- Figure 134: South America Insect Growth Regulator Industry Volume Share (%), by Control Method 2025 & 2033
- Figure 135: South America Insect Growth Regulator Industry Revenue (Million), by Product Type 2025 & 2033
- Figure 136: South America Insect Growth Regulator Industry Volume (Kiloton), by Product Type 2025 & 2033
- Figure 137: South America Insect Growth Regulator Industry Revenue Share (%), by Product Type 2025 & 2033
- Figure 138: South America Insect Growth Regulator Industry Volume Share (%), by Product Type 2025 & 2033
- Figure 139: South America Insect Growth Regulator Industry Revenue (Million), by Target Insect 2025 & 2033
- Figure 140: South America Insect Growth Regulator Industry Volume (Kiloton), by Target Insect 2025 & 2033
- Figure 141: South America Insect Growth Regulator Industry Revenue Share (%), by Target Insect 2025 & 2033
- Figure 142: South America Insect Growth Regulator Industry Volume Share (%), by Target Insect 2025 & 2033
- Figure 143: South America Insect Growth Regulator Industry Revenue (Million), by Country 2025 & 2033
- Figure 144: South America Insect Growth Regulator Industry Volume (Kiloton), by Country 2025 & 2033
- Figure 145: South America Insect Growth Regulator Industry Revenue Share (%), by Country 2025 & 2033
- Figure 146: South America Insect Growth Regulator Industry Volume Share (%), by Country 2025 & 2033
- Figure 147: Africa Insect Growth Regulator Industry Revenue (Million), by Application 2025 & 2033
- Figure 148: Africa Insect Growth Regulator Industry Volume (Kiloton), by Application 2025 & 2033
- Figure 149: Africa Insect Growth Regulator Industry Revenue Share (%), by Application 2025 & 2033
- Figure 150: Africa Insect Growth Regulator Industry Volume Share (%), by Application 2025 & 2033
- Figure 151: Africa Insect Growth Regulator Industry Revenue (Million), by Control Method 2025 & 2033
- Figure 152: Africa Insect Growth Regulator Industry Volume (Kiloton), by Control Method 2025 & 2033
- Figure 153: Africa Insect Growth Regulator Industry Revenue Share (%), by Control Method 2025 & 2033
- Figure 154: Africa Insect Growth Regulator Industry Volume Share (%), by Control Method 2025 & 2033
- Figure 155: Africa Insect Growth Regulator Industry Revenue (Million), by Product Type 2025 & 2033
- Figure 156: Africa Insect Growth Regulator Industry Volume (Kiloton), by Product Type 2025 & 2033
- Figure 157: Africa Insect Growth Regulator Industry Revenue Share (%), by Product Type 2025 & 2033
- Figure 158: Africa Insect Growth Regulator Industry Volume Share (%), by Product Type 2025 & 2033
- Figure 159: Africa Insect Growth Regulator Industry Revenue (Million), by Target Insect 2025 & 2033
- Figure 160: Africa Insect Growth Regulator Industry Volume (Kiloton), by Target Insect 2025 & 2033
- Figure 161: Africa Insect Growth Regulator Industry Revenue Share (%), by Target Insect 2025 & 2033
- Figure 162: Africa Insect Growth Regulator Industry Volume Share (%), by Target Insect 2025 & 2033
- Figure 163: Africa Insect Growth Regulator Industry Revenue (Million), by Application 2025 & 2033
- Figure 164: Africa Insect Growth Regulator Industry Volume (Kiloton), by Application 2025 & 2033
- Figure 165: Africa Insect Growth Regulator Industry Revenue Share (%), by Application 2025 & 2033
- Figure 166: Africa Insect Growth Regulator Industry Volume Share (%), by Application 2025 & 2033
- Figure 167: Africa Insect Growth Regulator Industry Revenue (Million), by Control Method 2025 & 2033
- Figure 168: Africa Insect Growth Regulator Industry Volume (Kiloton), by Control Method 2025 & 2033
- Figure 169: Africa Insect Growth Regulator Industry Revenue Share (%), by Control Method 2025 & 2033
- Figure 170: Africa Insect Growth Regulator Industry Volume Share (%), by Control Method 2025 & 2033
- Figure 171: Africa Insect Growth Regulator Industry Revenue (Million), by Product Type 2025 & 2033
- Figure 172: Africa Insect Growth Regulator Industry Volume (Kiloton), by Product Type 2025 & 2033
- Figure 173: Africa Insect Growth Regulator Industry Revenue Share (%), by Product Type 2025 & 2033
- Figure 174: Africa Insect Growth Regulator Industry Volume Share (%), by Product Type 2025 & 2033
- Figure 175: Africa Insect Growth Regulator Industry Revenue (Million), by Target Insect 2025 & 2033
- Figure 176: Africa Insect Growth Regulator Industry Volume (Kiloton), by Target Insect 2025 & 2033
- Figure 177: Africa Insect Growth Regulator Industry Revenue Share (%), by Target Insect 2025 & 2033
- Figure 178: Africa Insect Growth Regulator Industry Volume Share (%), by Target Insect 2025 & 2033
- Figure 179: Africa Insect Growth Regulator Industry Revenue (Million), by Country 2025 & 2033
- Figure 180: Africa Insect Growth Regulator Industry Volume (Kiloton), by Country 2025 & 2033
- Figure 181: Africa Insect Growth Regulator Industry Revenue Share (%), by Country 2025 & 2033
- Figure 182: Africa Insect Growth Regulator Industry Volume Share (%), by Country 2025 & 2033
List of Tables
- Table 1: Global Insect Growth Regulator Industry Revenue Million Forecast, by Application 2020 & 2033
- Table 2: Global Insect Growth Regulator Industry Volume Kiloton Forecast, by Application 2020 & 2033
- Table 3: Global Insect Growth Regulator Industry Revenue Million Forecast, by Control Method 2020 & 2033
- Table 4: Global Insect Growth Regulator Industry Volume Kiloton Forecast, by Control Method 2020 & 2033
- Table 5: Global Insect Growth Regulator Industry Revenue Million Forecast, by Product Type 2020 & 2033
- Table 6: Global Insect Growth Regulator Industry Volume Kiloton Forecast, by Product Type 2020 & 2033
- Table 7: Global Insect Growth Regulator Industry Revenue Million Forecast, by Target Insect 2020 & 2033
- Table 8: Global Insect Growth Regulator Industry Volume Kiloton Forecast, by Target Insect 2020 & 2033
- Table 9: Global Insect Growth Regulator Industry Revenue Million Forecast, by Application 2020 & 2033
- Table 10: Global Insect Growth Regulator Industry Volume Kiloton Forecast, by Application 2020 & 2033
- Table 11: Global Insect Growth Regulator Industry Revenue Million Forecast, by Control Method 2020 & 2033
- Table 12: Global Insect Growth Regulator Industry Volume Kiloton Forecast, by Control Method 2020 & 2033
- Table 13: Global Insect Growth Regulator Industry Revenue Million Forecast, by Product Type 2020 & 2033
- Table 14: Global Insect Growth Regulator Industry Volume Kiloton Forecast, by Product Type 2020 & 2033
- Table 15: Global Insect Growth Regulator Industry Revenue Million Forecast, by Target Insect 2020 & 2033
- Table 16: Global Insect Growth Regulator Industry Volume Kiloton Forecast, by Target Insect 2020 & 2033
- Table 17: Global Insect Growth Regulator Industry Revenue Million Forecast, by Region 2020 & 2033
- Table 18: Global Insect Growth Regulator Industry Volume Kiloton Forecast, by Region 2020 & 2033
- Table 19: Global Insect Growth Regulator Industry Revenue Million Forecast, by Application 2020 & 2033
- Table 20: Global Insect Growth Regulator Industry Volume Kiloton Forecast, by Application 2020 & 2033
- Table 21: Global Insect Growth Regulator Industry Revenue Million Forecast, by Control Method 2020 & 2033
- Table 22: Global Insect Growth Regulator Industry Volume Kiloton Forecast, by Control Method 2020 & 2033
- Table 23: Global Insect Growth Regulator Industry Revenue Million Forecast, by Product Type 2020 & 2033
- Table 24: Global Insect Growth Regulator Industry Volume Kiloton Forecast, by Product Type 2020 & 2033
- Table 25: Global Insect Growth Regulator Industry Revenue Million Forecast, by Target Insect 2020 & 2033
- Table 26: Global Insect Growth Regulator Industry Volume Kiloton Forecast, by Target Insect 2020 & 2033
- Table 27: Global Insect Growth Regulator Industry Revenue Million Forecast, by Application 2020 & 2033
- Table 28: Global Insect Growth Regulator Industry Volume Kiloton Forecast, by Application 2020 & 2033
- Table 29: Global Insect Growth Regulator Industry Revenue Million Forecast, by Control Method 2020 & 2033
- Table 30: Global Insect Growth Regulator Industry Volume Kiloton Forecast, by Control Method 2020 & 2033
- Table 31: Global Insect Growth Regulator Industry Revenue Million Forecast, by Product Type 2020 & 2033
- Table 32: Global Insect Growth Regulator Industry Volume Kiloton Forecast, by Product Type 2020 & 2033
- Table 33: Global Insect Growth Regulator Industry Revenue Million Forecast, by Target Insect 2020 & 2033
- Table 34: Global Insect Growth Regulator Industry Volume Kiloton Forecast, by Target Insect 2020 & 2033
- Table 35: Global Insect Growth Regulator Industry Revenue Million Forecast, by Country 2020 & 2033
- Table 36: Global Insect Growth Regulator Industry Volume Kiloton Forecast, by Country 2020 & 2033
- Table 37: United States Insect Growth Regulator Industry Revenue (Million) Forecast, by Application 2020 & 2033
- Table 38: United States Insect Growth Regulator Industry Volume (Kiloton) Forecast, by Application 2020 & 2033
- Table 39: Canada Insect Growth Regulator Industry Revenue (Million) Forecast, by Application 2020 & 2033
- Table 40: Canada Insect Growth Regulator Industry Volume (Kiloton) Forecast, by Application 2020 & 2033
- Table 41: Mexico Insect Growth Regulator Industry Revenue (Million) Forecast, by Application 2020 & 2033
- Table 42: Mexico Insect Growth Regulator Industry Volume (Kiloton) Forecast, by Application 2020 & 2033
- Table 43: Rest of North America Insect Growth Regulator Industry Revenue (Million) Forecast, by Application 2020 & 2033
- Table 44: Rest of North America Insect Growth Regulator Industry Volume (Kiloton) Forecast, by Application 2020 & 2033
- Table 45: Global Insect Growth Regulator Industry Revenue Million Forecast, by Application 2020 & 2033
- Table 46: Global Insect Growth Regulator Industry Volume Kiloton Forecast, by Application 2020 & 2033
- Table 47: Global Insect Growth Regulator Industry Revenue Million Forecast, by Control Method 2020 & 2033
- Table 48: Global Insect Growth Regulator Industry Volume Kiloton Forecast, by Control Method 2020 & 2033
- Table 49: Global Insect Growth Regulator Industry Revenue Million Forecast, by Product Type 2020 & 2033
- Table 50: Global Insect Growth Regulator Industry Volume Kiloton Forecast, by Product Type 2020 & 2033
- Table 51: Global Insect Growth Regulator Industry Revenue Million Forecast, by Target Insect 2020 & 2033
- Table 52: Global Insect Growth Regulator Industry Volume Kiloton Forecast, by Target Insect 2020 & 2033
- Table 53: Global Insect Growth Regulator Industry Revenue Million Forecast, by Application 2020 & 2033
- Table 54: Global Insect Growth Regulator Industry Volume Kiloton Forecast, by Application 2020 & 2033
- Table 55: Global Insect Growth Regulator Industry Revenue Million Forecast, by Control Method 2020 & 2033
- Table 56: Global Insect Growth Regulator Industry Volume Kiloton Forecast, by Control Method 2020 & 2033
- Table 57: Global Insect Growth Regulator Industry Revenue Million Forecast, by Product Type 2020 & 2033
- Table 58: Global Insect Growth Regulator Industry Volume Kiloton Forecast, by Product Type 2020 & 2033
- Table 59: Global Insect Growth Regulator Industry Revenue Million Forecast, by Target Insect 2020 & 2033
- Table 60: Global Insect Growth Regulator Industry Volume Kiloton Forecast, by Target Insect 2020 & 2033
- Table 61: Global Insect Growth Regulator Industry Revenue Million Forecast, by Country 2020 & 2033
- Table 62: Global Insect Growth Regulator Industry Volume Kiloton Forecast, by Country 2020 & 2033
- Table 63: Germany Insect Growth Regulator Industry Revenue (Million) Forecast, by Application 2020 & 2033
- Table 64: Germany Insect Growth Regulator Industry Volume (Kiloton) Forecast, by Application 2020 & 2033
- Table 65: United Kingdom Insect Growth Regulator Industry Revenue (Million) Forecast, by Application 2020 & 2033
- Table 66: United Kingdom Insect Growth Regulator Industry Volume (Kiloton) Forecast, by Application 2020 & 2033
- Table 67: France Insect Growth Regulator Industry Revenue (Million) Forecast, by Application 2020 & 2033
- Table 68: France Insect Growth Regulator Industry Volume (Kiloton) Forecast, by Application 2020 & 2033
- Table 69: Russia Insect Growth Regulator Industry Revenue (Million) Forecast, by Application 2020 & 2033
- Table 70: Russia Insect Growth Regulator Industry Volume (Kiloton) Forecast, by Application 2020 & 2033
- Table 71: Spain Insect Growth Regulator Industry Revenue (Million) Forecast, by Application 2020 & 2033
- Table 72: Spain Insect Growth Regulator Industry Volume (Kiloton) Forecast, by Application 2020 & 2033
- Table 73: Rest of Europe Insect Growth Regulator Industry Revenue (Million) Forecast, by Application 2020 & 2033
- Table 74: Rest of Europe Insect Growth Regulator Industry Volume (Kiloton) Forecast, by Application 2020 & 2033
- Table 75: Global Insect Growth Regulator Industry Revenue Million Forecast, by Application 2020 & 2033
- Table 76: Global Insect Growth Regulator Industry Volume Kiloton Forecast, by Application 2020 & 2033
- Table 77: Global Insect Growth Regulator Industry Revenue Million Forecast, by Control Method 2020 & 2033
- Table 78: Global Insect Growth Regulator Industry Volume Kiloton Forecast, by Control Method 2020 & 2033
- Table 79: Global Insect Growth Regulator Industry Revenue Million Forecast, by Product Type 2020 & 2033
- Table 80: Global Insect Growth Regulator Industry Volume Kiloton Forecast, by Product Type 2020 & 2033
- Table 81: Global Insect Growth Regulator Industry Revenue Million Forecast, by Target Insect 2020 & 2033
- Table 82: Global Insect Growth Regulator Industry Volume Kiloton Forecast, by Target Insect 2020 & 2033
- Table 83: Global Insect Growth Regulator Industry Revenue Million Forecast, by Application 2020 & 2033
- Table 84: Global Insect Growth Regulator Industry Volume Kiloton Forecast, by Application 2020 & 2033
- Table 85: Global Insect Growth Regulator Industry Revenue Million Forecast, by Control Method 2020 & 2033
- Table 86: Global Insect Growth Regulator Industry Volume Kiloton Forecast, by Control Method 2020 & 2033
- Table 87: Global Insect Growth Regulator Industry Revenue Million Forecast, by Product Type 2020 & 2033
- Table 88: Global Insect Growth Regulator Industry Volume Kiloton Forecast, by Product Type 2020 & 2033
- Table 89: Global Insect Growth Regulator Industry Revenue Million Forecast, by Target Insect 2020 & 2033
- Table 90: Global Insect Growth Regulator Industry Volume Kiloton Forecast, by Target Insect 2020 & 2033
- Table 91: Global Insect Growth Regulator Industry Revenue Million Forecast, by Country 2020 & 2033
- Table 92: Global Insect Growth Regulator Industry Volume Kiloton Forecast, by Country 2020 & 2033
- Table 93: India Insect Growth Regulator Industry Revenue (Million) Forecast, by Application 2020 & 2033
- Table 94: India Insect Growth Regulator Industry Volume (Kiloton) Forecast, by Application 2020 & 2033
- Table 95: China Insect Growth Regulator Industry Revenue (Million) Forecast, by Application 2020 & 2033
- Table 96: China Insect Growth Regulator Industry Volume (Kiloton) Forecast, by Application 2020 & 2033
- Table 97: Japan Insect Growth Regulator Industry Revenue (Million) Forecast, by Application 2020 & 2033
- Table 98: Japan Insect Growth Regulator Industry Volume (Kiloton) Forecast, by Application 2020 & 2033
- Table 99: Rest of the Asia Pacific Insect Growth Regulator Industry Revenue (Million) Forecast, by Application 2020 & 2033
- Table 100: Rest of the Asia Pacific Insect Growth Regulator Industry Volume (Kiloton) Forecast, by Application 2020 & 2033
- Table 101: Global Insect Growth Regulator Industry Revenue Million Forecast, by Application 2020 & 2033
- Table 102: Global Insect Growth Regulator Industry Volume Kiloton Forecast, by Application 2020 & 2033
- Table 103: Global Insect Growth Regulator Industry Revenue Million Forecast, by Control Method 2020 & 2033
- Table 104: Global Insect Growth Regulator Industry Volume Kiloton Forecast, by Control Method 2020 & 2033
- Table 105: Global Insect Growth Regulator Industry Revenue Million Forecast, by Product Type 2020 & 2033
- Table 106: Global Insect Growth Regulator Industry Volume Kiloton Forecast, by Product Type 2020 & 2033
- Table 107: Global Insect Growth Regulator Industry Revenue Million Forecast, by Target Insect 2020 & 2033
- Table 108: Global Insect Growth Regulator Industry Volume Kiloton Forecast, by Target Insect 2020 & 2033
- Table 109: Global Insect Growth Regulator Industry Revenue Million Forecast, by Application 2020 & 2033
- Table 110: Global Insect Growth Regulator Industry Volume Kiloton Forecast, by Application 2020 & 2033
- Table 111: Global Insect Growth Regulator Industry Revenue Million Forecast, by Control Method 2020 & 2033
- Table 112: Global Insect Growth Regulator Industry Volume Kiloton Forecast, by Control Method 2020 & 2033
- Table 113: Global Insect Growth Regulator Industry Revenue Million Forecast, by Product Type 2020 & 2033
- Table 114: Global Insect Growth Regulator Industry Volume Kiloton Forecast, by Product Type 2020 & 2033
- Table 115: Global Insect Growth Regulator Industry Revenue Million Forecast, by Target Insect 2020 & 2033
- Table 116: Global Insect Growth Regulator Industry Volume Kiloton Forecast, by Target Insect 2020 & 2033
- Table 117: Global Insect Growth Regulator Industry Revenue Million Forecast, by Country 2020 & 2033
- Table 118: Global Insect Growth Regulator Industry Volume Kiloton Forecast, by Country 2020 & 2033
- Table 119: Brazil Insect Growth Regulator Industry Revenue (Million) Forecast, by Application 2020 & 2033
- Table 120: Brazil Insect Growth Regulator Industry Volume (Kiloton) Forecast, by Application 2020 & 2033
- Table 121: Argentina Insect Growth Regulator Industry Revenue (Million) Forecast, by Application 2020 & 2033
- Table 122: Argentina Insect Growth Regulator Industry Volume (Kiloton) Forecast, by Application 2020 & 2033
- Table 123: Rest of South America Insect Growth Regulator Industry Revenue (Million) Forecast, by Application 2020 & 2033
- Table 124: Rest of South America Insect Growth Regulator Industry Volume (Kiloton) Forecast, by Application 2020 & 2033
- Table 125: Global Insect Growth Regulator Industry Revenue Million Forecast, by Application 2020 & 2033
- Table 126: Global Insect Growth Regulator Industry Volume Kiloton Forecast, by Application 2020 & 2033
- Table 127: Global Insect Growth Regulator Industry Revenue Million Forecast, by Control Method 2020 & 2033
- Table 128: Global Insect Growth Regulator Industry Volume Kiloton Forecast, by Control Method 2020 & 2033
- Table 129: Global Insect Growth Regulator Industry Revenue Million Forecast, by Product Type 2020 & 2033
- Table 130: Global Insect Growth Regulator Industry Volume Kiloton Forecast, by Product Type 2020 & 2033
- Table 131: Global Insect Growth Regulator Industry Revenue Million Forecast, by Target Insect 2020 & 2033
- Table 132: Global Insect Growth Regulator Industry Volume Kiloton Forecast, by Target Insect 2020 & 2033
- Table 133: Global Insect Growth Regulator Industry Revenue Million Forecast, by Application 2020 & 2033
- Table 134: Global Insect Growth Regulator Industry Volume Kiloton Forecast, by Application 2020 & 2033
- Table 135: Global Insect Growth Regulator Industry Revenue Million Forecast, by Control Method 2020 & 2033
- Table 136: Global Insect Growth Regulator Industry Volume Kiloton Forecast, by Control Method 2020 & 2033
- Table 137: Global Insect Growth Regulator Industry Revenue Million Forecast, by Product Type 2020 & 2033
- Table 138: Global Insect Growth Regulator Industry Volume Kiloton Forecast, by Product Type 2020 & 2033
- Table 139: Global Insect Growth Regulator Industry Revenue Million Forecast, by Target Insect 2020 & 2033
- Table 140: Global Insect Growth Regulator Industry Volume Kiloton Forecast, by Target Insect 2020 & 2033
- Table 141: Global Insect Growth Regulator Industry Revenue Million Forecast, by Country 2020 & 2033
- Table 142: Global Insect Growth Regulator Industry Volume Kiloton Forecast, by Country 2020 & 2033
- Table 143: South Africa Insect Growth Regulator Industry Revenue (Million) Forecast, by Application 2020 & 2033
- Table 144: South Africa Insect Growth Regulator Industry Volume (Kiloton) Forecast, by Application 2020 & 2033
- Table 145: Rest of Africa Insect Growth Regulator Industry Revenue (Million) Forecast, by Application 2020 & 2033
- Table 146: Rest of Africa Insect Growth Regulator Industry Volume (Kiloton) Forecast, by Application 2020 & 2033
Frequently Asked Questions
1. What is the projected Compound Annual Growth Rate (CAGR) of the Insect Growth Regulator Industry?
The projected CAGR is approximately 5.70%.
2. Which companies are prominent players in the Insect Growth Regulator Industry?
Key companies in the market include Russell IPM, Eli Lily and Company, Certis, Sumitomo Chemical, Syngent, Adama, Nufarm, BASF, Central Garden & Pet Co, Summit Chemical.
3. What are the main segments of the Insect Growth Regulator Industry?
The market segments include Application, Control Method, Product Type, Target Insect, Application, Control Method, Product Type, Target Insect.
4. Can you provide details about the market size?
The market size is estimated to be USD 0.95 Million as of 2022.
5. What are some drivers contributing to market growth?
Seed Treatment As A Solution To Enhance Yield; Growing Awareness For Seed Treatment Among The Farmers; Rising Trend Of Organic Farming.
6. What are the notable trends driving market growth?
Mosquito-borne Diseases Drive the Larvicides Market.
7. Are there any restraints impacting market growth?
Limitations Across Farm-Level Seed Treatment; Rising Environmental Concerns.
8. Can you provide examples of recent developments in the market?
N/A
9. What pricing options are available for accessing the report?
Pricing options include single-user, multi-user, and enterprise licenses priced at USD 4750, USD 5250, and USD 8750 respectively.
10. Is the market size provided in terms of value or volume?
The market size is provided in terms of value, measured in Million and volume, measured in Kiloton.
11. Are there any specific market keywords associated with the report?
Yes, the market keyword associated with the report is "Insect Growth Regulator Industry," which aids in identifying and referencing the specific market segment covered.
12. How do I determine which pricing option suits my needs best?
The pricing options vary based on user requirements and access needs. Individual users may opt for single-user licenses, while businesses requiring broader access may choose multi-user or enterprise licenses for cost-effective access to the report.
13. Are there any additional resources or data provided in the Insect Growth Regulator Industry report?
While the report offers comprehensive insights, it's advisable to review the specific contents or supplementary materials provided to ascertain if additional resources or data are available.
14. How can I stay updated on further developments or reports in the Insect Growth Regulator Industry?
To stay informed about further developments, trends, and reports in the Insect Growth Regulator Industry, consider subscribing to industry newsletters, following relevant companies and organizations, or regularly checking reputable industry news sources and publications.
Methodology
Step 1 - Identification of Relevant Samples Size from Population Database


Step 2 - Approaches for Defining Global Market Size (Value, Volume* & Price*)

Note*: In applicable scenarios
Step 3 - Data Sources
Primary Research
- Web Analytics
- Survey Reports
- Research Institute
- Latest Research Reports
- Opinion Leaders
Secondary Research
- Annual Reports
- White Paper
- Latest Press Release
- Industry Association
- Paid Database
- Investor Presentations

Step 4 - Data Triangulation
Involves using different sources of information in order to increase the validity of a study
These sources are likely to be stakeholders in a program - participants, other researchers, program staff, other community members, and so on.
Then we put all data in single framework & apply various statistical tools to find out the dynamic on the market.
During the analysis stage, feedback from the stakeholder groups would be compared to determine areas of agreement as well as areas of divergence