

Key Insights
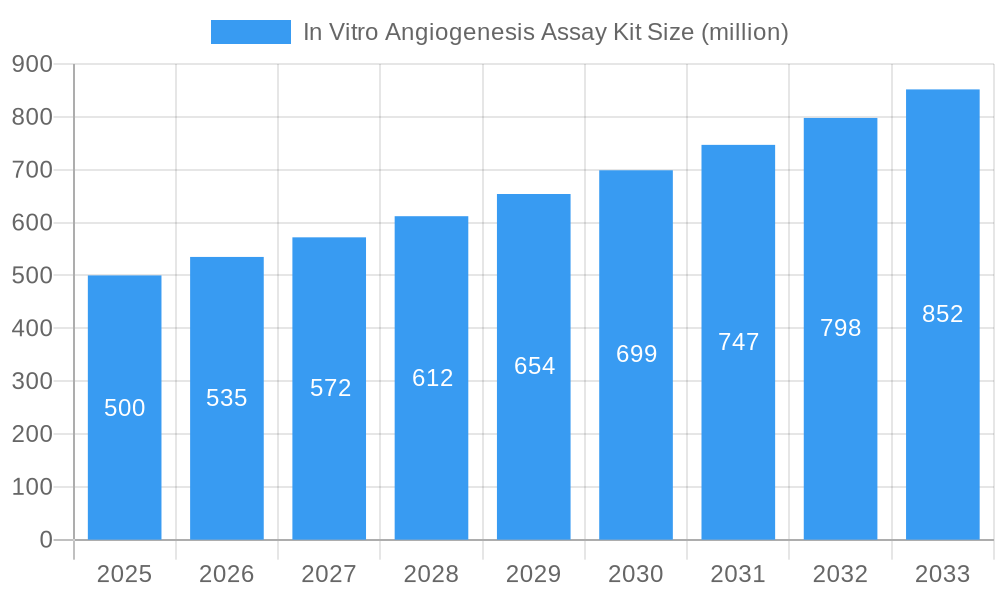
The in vitro angiogenesis assay kit market is experiencing robust growth, driven by the increasing prevalence of cardiovascular diseases, cancer research advancements, and the rising demand for drug discovery and development tools. The market's substantial size, estimated at $500 million in 2025, reflects its importance in various research and clinical applications. A Compound Annual Growth Rate (CAGR) of approximately 7% is projected from 2025 to 2033, indicating continued market expansion. Key application segments include academic institutions, heavily involved in fundamental research, and biotech companies leading the charge in developing novel therapeutics targeting angiogenesis. The prevalent types of assay kits, namely HC Kit and µ-Slide Assay Kit, cater to diverse experimental needs and research methodologies. Major market players such as Abcam, R&D Systems, and Thermo Fisher Scientific are leveraging their extensive research capabilities and distribution networks to capture significant market share. Geographic expansion, particularly in the rapidly developing economies of Asia-Pacific, presents a significant growth opportunity. While the market faces potential restraints from the high cost of assay kits and the availability of alternative research techniques, the overall positive trends in the pharmaceutical and biotechnology sectors strongly suggest a continued trajectory of growth for the foreseeable future.
In Vitro Angiogenesis Assay Kit Market Size (In Million)
The market segmentation highlights the varied needs of different user groups. Academic institutions primarily utilize these kits for fundamental research into angiogenesis, while biotech companies are heavily engaged in the development of anti-angiogenic therapies for cancer and other diseases. The differences in kit types (HC Kit and µ-Slide Assay Kit) reflect the varying needs of different research methodologies, with each kit offering advantages in terms of throughput, sensitivity, and ease of use. North America and Europe currently hold significant market shares due to established research infrastructure and regulatory frameworks, but the Asia-Pacific region is poised for substantial growth, driven by expanding research capabilities and increasing healthcare spending. Competitive dynamics involve both established market leaders and smaller, innovative companies, leading to continuous product development and improvement, and contributing to the overall market expansion.
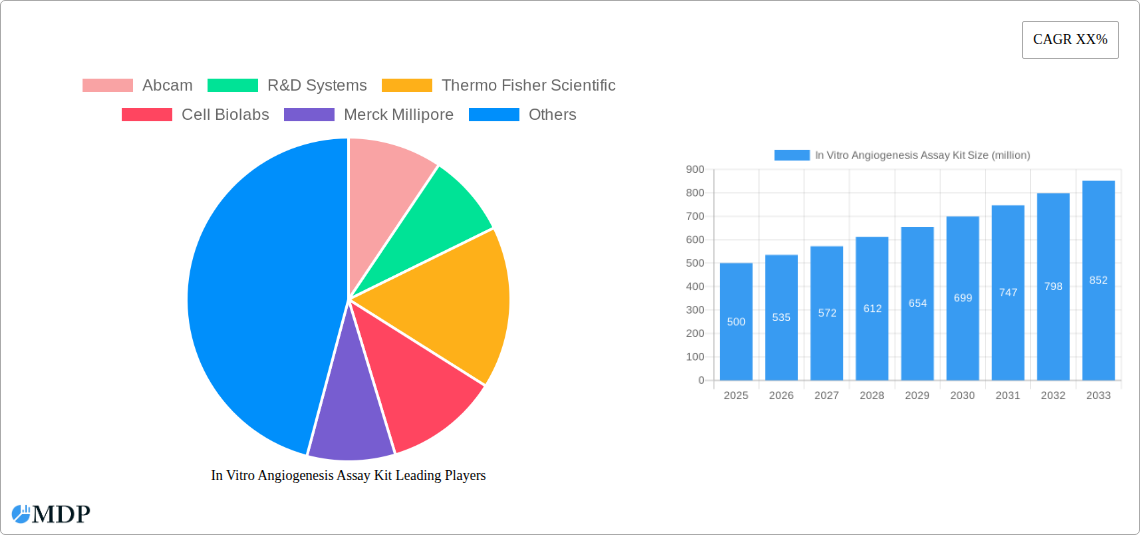
In Vitro Angiogenesis Assay Kit Company Market Share
In Vitro Angiogenesis Assay Kit Market Report: 2019-2033
This comprehensive report provides a detailed analysis of the global In Vitro Angiogenesis Assay Kit market, offering actionable insights for industry stakeholders. The study period spans from 2019 to 2033, with 2025 serving as both the base and estimated year. The forecast period covers 2025-2033, while the historical period encompasses 2019-2024. The market is segmented by application (Academic Institution, Biotech Companies, Others) and type (HC Kit Assay Kit, µ-Slide Assay Kit), with key players including Abcam, R&D Systems, Thermo Fisher Scientific, Cell Biolabs, Merck Millipore, Creative Bioarray, ibidi, TheWell Bioscience, MyBiosource, and Kollodis BioSciences. The report projects a market value exceeding $XX million by 2033, presenting significant growth opportunities.
In Vitro Angiogenesis Assay Kit Market Dynamics & Concentration
The In Vitro Angiogenesis Assay Kit market is characterized by a moderately concentrated landscape, with the top five players holding an estimated 60% market share in 2025. This concentration is driven by significant investments in R&D, robust distribution networks, and established brand recognition. Innovation is a key driver, with companies continuously developing more sensitive, accurate, and high-throughput assays. The regulatory landscape, particularly concerning clinical trial validation and approvals, influences market dynamics. Product substitutes, such as in vivo models, exist but are often more expensive and time-consuming. End-user trends show a growing preference for automated and user-friendly kits, driving the adoption of advanced technologies. M&A activity has been moderate, with approximately xx deals recorded between 2019 and 2024, primarily focused on expanding product portfolios and geographical reach.
- Market Concentration: Top 5 players hold ~60% market share (2025).
- Innovation Drivers: Development of high-throughput, sensitive, and user-friendly assays.
- Regulatory Framework: Stringent guidelines for clinical trial validation influence market access.
- Product Substitutes: In vivo models represent a viable alternative, but with limitations.
- End-User Trends: Growing preference for automated and user-friendly kits.
- M&A Activity: Approximately xx deals between 2019 and 2024.
In Vitro Angiogenesis Assay Kit Industry Trends & Analysis
The In Vitro Angiogenesis Assay Kit market is experiencing robust growth, projected to achieve a CAGR of xx% during the forecast period (2025-2033). This growth is fueled by the increasing prevalence of vascular-related diseases, a surge in pharmaceutical R&D activities focused on angiogenesis, and the rising adoption of in vitro assays for preclinical drug screening. Technological advancements, particularly in microfluidic devices and imaging techniques, are enhancing assay sensitivity and throughput. Consumer preferences are shifting towards higher throughput, faster results, and more user-friendly kits. Competitive dynamics are characterized by both price competition and the introduction of novel assay formats. Market penetration remains relatively high in developed regions, with opportunities for expansion in emerging markets driven by increasing healthcare spending.
Leading Markets & Segments in In Vitro Angiogenesis Assay Kit
The North American region currently dominates the In Vitro Angiogenesis Assay Kit market, driven by strong R&D investments in the pharmaceutical and biotechnology sectors, a large pool of academic institutions, and favorable regulatory frameworks. Within applications, Biotech companies constitute the largest segment, followed by Academic Institutions. The HC Kit Assay Kit type holds the largest market share due to its versatility and cost-effectiveness.
- Key Drivers for North American Dominance:
- High R&D spending in the pharmaceutical and biotechnology sectors.
- Large number of academic research institutions.
- Favorable regulatory environment.
- Segment Analysis:
- Application: Biotech Companies > Academic Institutions > Others
- Type: HC Kit Assay Kit > µ-Slide Assay Kit
- Growth Drivers for Each Segment: (Detailed paragraph analysis of each segment's growth drivers would follow, specifying economic policies, infrastructure investments, and other relevant factors for each region and segment).
In Vitro Angiogenesis Assay Kit Product Developments
Recent product innovations focus on miniaturization, automation, and improved sensitivity of assays. Companies are introducing multi-well plates and microfluidic systems for higher throughput screening, alongside improved imaging and analysis software for more accurate data interpretation. These advancements improve efficiency, reduce costs, and enhance the overall reliability of angiogenesis research. The competitive advantage lies in offering superior sensitivity, ease of use, and comprehensive analytical tools.
Key Drivers of In Vitro Angiogenesis Assay Kit Growth
The market's expansion is driven by several factors: the increasing prevalence of angiogenesis-related diseases (cancer, diabetic retinopathy); the growing demand for robust preclinical drug screening models; and continuous technological advancements leading to more sensitive and efficient assay kits. Furthermore, increased funding for biomedical research and favorable regulatory landscapes in key regions further propel market growth.
Challenges in the In Vitro Angiogenesis Assay Kit Market
The market faces challenges including high manufacturing costs, the need for specialized training to use certain kits, and potential supply chain disruptions impacting reagent availability. Stringent regulatory approvals for new kits can also hinder market entry and expansion. These factors can impact profitability and slow down market growth, potentially affecting smaller players disproportionately.
Emerging Opportunities in In Vitro Angiogenesis Assay Kit
Significant opportunities lie in the development of 3D cell culture models for more physiologically relevant assays, the integration of AI and machine learning for automated data analysis, and expansion into emerging markets with growing healthcare spending. Strategic collaborations between kit manufacturers and pharmaceutical companies will also contribute to accelerated market growth.
Leading Players in the In Vitro Angiogenesis Assay Kit Sector
- Abcam
- R&D Systems
- Thermo Fisher Scientific
- Cell Biolabs
- Merck Millipore
- Creative Bioarray
- ibidi
- TheWell Bioscience
- MyBiosource
- Kollodis BioSciences
Key Milestones in In Vitro Angiogenesis Assay Kit Industry
- 2020: Launch of a high-throughput automated angiogenesis assay kit by Thermo Fisher Scientific.
- 2021: Abcam introduces a novel microfluidic-based angiogenesis assay.
- 2022: Merck Millipore acquires a smaller company specializing in angiogenesis assay reagents.
- 2023: R&D Systems releases an improved version of its popular angiogenesis assay kit with enhanced sensitivity.
- (Further milestones would be added here based on available data)
Strategic Outlook for In Vitro Angiogenesis Assay Kit Market
The In Vitro Angiogenesis Assay Kit market exhibits immense potential for growth, driven by ongoing technological advancements, increasing research activities, and the unmet clinical needs in treating vascular-related diseases. Strategic partnerships, expansion into emerging markets, and focus on developing user-friendly and high-throughput assays will be key success factors for market players. The market is expected to witness significant growth in the coming years, offering lucrative opportunities for companies focused on innovation and market expansion.
In Vitro Angiogenesis Assay Kit Segmentation
-
1. Application
- 1.1. Academic Institution
- 1.2. Biotech Companies
- 1.3. Others
-
2. Types
- 2.1. HC Kit Assay Kit
- 2.2. µ-Slide Assay Kit
In Vitro Angiogenesis Assay Kit Segmentation By Geography
-
1. North America
- 1.1. United States
- 1.2. Canada
- 1.3. Mexico
-
2. South America
- 2.1. Brazil
- 2.2. Argentina
- 2.3. Rest of South America
-
3. Europe
- 3.1. United Kingdom
- 3.2. Germany
- 3.3. France
- 3.4. Italy
- 3.5. Spain
- 3.6. Russia
- 3.7. Benelux
- 3.8. Nordics
- 3.9. Rest of Europe
-
4. Middle East & Africa
- 4.1. Turkey
- 4.2. Israel
- 4.3. GCC
- 4.4. North Africa
- 4.5. South Africa
- 4.6. Rest of Middle East & Africa
-
5. Asia Pacific
- 5.1. China
- 5.2. India
- 5.3. Japan
- 5.4. South Korea
- 5.5. ASEAN
- 5.6. Oceania
- 5.7. Rest of Asia Pacific
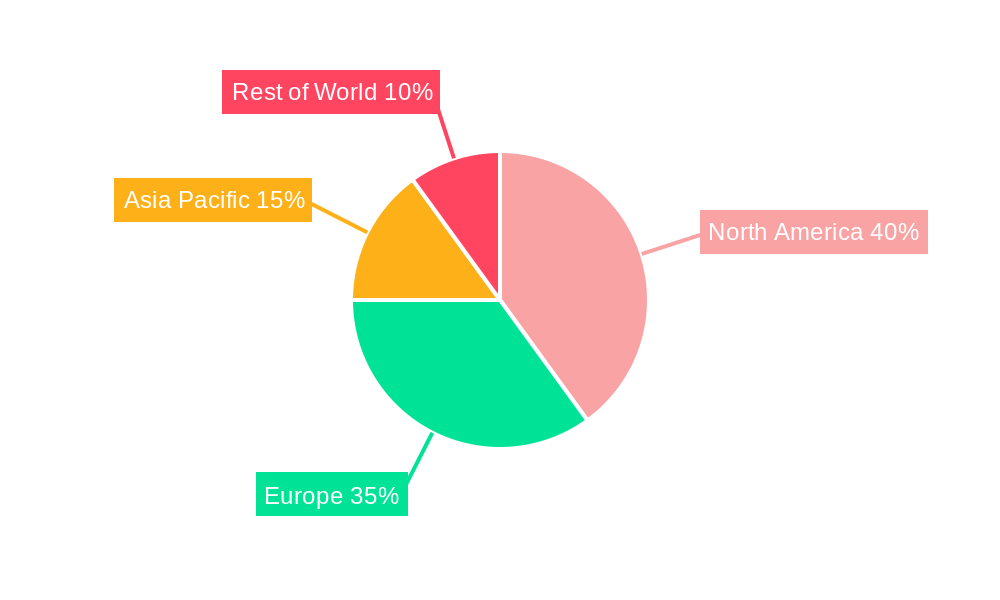
In Vitro Angiogenesis Assay Kit Regional Market Share
Geographic Coverage of In Vitro Angiogenesis Assay Kit
In Vitro Angiogenesis Assay Kit REPORT HIGHLIGHTS
| Aspects | Details |
|---|---|
| Study Period | 2020-2034 |
| Base Year | 2025 |
| Estimated Year | 2026 |
| Forecast Period | 2026-2034 |
| Historical Period | 2020-2025 |
| Growth Rate | CAGR of 16.01% from 2020-2034 |
| Segmentation |
|
Table of Contents
- 1. Introduction
- 1.1. Research Scope
- 1.2. Market Segmentation
- 1.3. Research Methodology
- 1.4. Definitions and Assumptions
- 2. Executive Summary
- 2.1. Introduction
- 3. Market Dynamics
- 3.1. Introduction
- 3.2. Market Drivers
- 3.3. Market Restrains
- 3.4. Market Trends
- 4. Market Factor Analysis
- 4.1. Porters Five Forces
- 4.2. Supply/Value Chain
- 4.3. PESTEL analysis
- 4.4. Market Entropy
- 4.5. Patent/Trademark Analysis
- 5. Global In Vitro Angiogenesis Assay Kit Analysis, Insights and Forecast, 2020-2032
- 5.1. Market Analysis, Insights and Forecast - by Application
- 5.1.1. Academic Institution
- 5.1.2. Biotech Companies
- 5.1.3. Others
- 5.2. Market Analysis, Insights and Forecast - by Types
- 5.2.1. HC Kit Assay Kit
- 5.2.2. µ-Slide Assay Kit
- 5.3. Market Analysis, Insights and Forecast - by Region
- 5.3.1. North America
- 5.3.2. South America
- 5.3.3. Europe
- 5.3.4. Middle East & Africa
- 5.3.5. Asia Pacific
- 5.1. Market Analysis, Insights and Forecast - by Application
- 6. North America In Vitro Angiogenesis Assay Kit Analysis, Insights and Forecast, 2020-2032
- 6.1. Market Analysis, Insights and Forecast - by Application
- 6.1.1. Academic Institution
- 6.1.2. Biotech Companies
- 6.1.3. Others
- 6.2. Market Analysis, Insights and Forecast - by Types
- 6.2.1. HC Kit Assay Kit
- 6.2.2. µ-Slide Assay Kit
- 6.1. Market Analysis, Insights and Forecast - by Application
- 7. South America In Vitro Angiogenesis Assay Kit Analysis, Insights and Forecast, 2020-2032
- 7.1. Market Analysis, Insights and Forecast - by Application
- 7.1.1. Academic Institution
- 7.1.2. Biotech Companies
- 7.1.3. Others
- 7.2. Market Analysis, Insights and Forecast - by Types
- 7.2.1. HC Kit Assay Kit
- 7.2.2. µ-Slide Assay Kit
- 7.1. Market Analysis, Insights and Forecast - by Application
- 8. Europe In Vitro Angiogenesis Assay Kit Analysis, Insights and Forecast, 2020-2032
- 8.1. Market Analysis, Insights and Forecast - by Application
- 8.1.1. Academic Institution
- 8.1.2. Biotech Companies
- 8.1.3. Others
- 8.2. Market Analysis, Insights and Forecast - by Types
- 8.2.1. HC Kit Assay Kit
- 8.2.2. µ-Slide Assay Kit
- 8.1. Market Analysis, Insights and Forecast - by Application
- 9. Middle East & Africa In Vitro Angiogenesis Assay Kit Analysis, Insights and Forecast, 2020-2032
- 9.1. Market Analysis, Insights and Forecast - by Application
- 9.1.1. Academic Institution
- 9.1.2. Biotech Companies
- 9.1.3. Others
- 9.2. Market Analysis, Insights and Forecast - by Types
- 9.2.1. HC Kit Assay Kit
- 9.2.2. µ-Slide Assay Kit
- 9.1. Market Analysis, Insights and Forecast - by Application
- 10. Asia Pacific In Vitro Angiogenesis Assay Kit Analysis, Insights and Forecast, 2020-2032
- 10.1. Market Analysis, Insights and Forecast - by Application
- 10.1.1. Academic Institution
- 10.1.2. Biotech Companies
- 10.1.3. Others
- 10.2. Market Analysis, Insights and Forecast - by Types
- 10.2.1. HC Kit Assay Kit
- 10.2.2. µ-Slide Assay Kit
- 10.1. Market Analysis, Insights and Forecast - by Application
- 11. Competitive Analysis
- 11.1. Global Market Share Analysis 2025
- 11.2. Company Profiles
- 11.2.1 Abcam
- 11.2.1.1. Overview
- 11.2.1.2. Products
- 11.2.1.3. SWOT Analysis
- 11.2.1.4. Recent Developments
- 11.2.1.5. Financials (Based on Availability)
- 11.2.2 R&D Systems
- 11.2.2.1. Overview
- 11.2.2.2. Products
- 11.2.2.3. SWOT Analysis
- 11.2.2.4. Recent Developments
- 11.2.2.5. Financials (Based on Availability)
- 11.2.3 Thermo Fisher Scientific
- 11.2.3.1. Overview
- 11.2.3.2. Products
- 11.2.3.3. SWOT Analysis
- 11.2.3.4. Recent Developments
- 11.2.3.5. Financials (Based on Availability)
- 11.2.4 Cell Biolabs
- 11.2.4.1. Overview
- 11.2.4.2. Products
- 11.2.4.3. SWOT Analysis
- 11.2.4.4. Recent Developments
- 11.2.4.5. Financials (Based on Availability)
- 11.2.5 Merck Millipore
- 11.2.5.1. Overview
- 11.2.5.2. Products
- 11.2.5.3. SWOT Analysis
- 11.2.5.4. Recent Developments
- 11.2.5.5. Financials (Based on Availability)
- 11.2.6 Creative Bioarray
- 11.2.6.1. Overview
- 11.2.6.2. Products
- 11.2.6.3. SWOT Analysis
- 11.2.6.4. Recent Developments
- 11.2.6.5. Financials (Based on Availability)
- 11.2.7 ibidi
- 11.2.7.1. Overview
- 11.2.7.2. Products
- 11.2.7.3. SWOT Analysis
- 11.2.7.4. Recent Developments
- 11.2.7.5. Financials (Based on Availability)
- 11.2.8 TheWell Bioscience
- 11.2.8.1. Overview
- 11.2.8.2. Products
- 11.2.8.3. SWOT Analysis
- 11.2.8.4. Recent Developments
- 11.2.8.5. Financials (Based on Availability)
- 11.2.9 MyBiosource
- 11.2.9.1. Overview
- 11.2.9.2. Products
- 11.2.9.3. SWOT Analysis
- 11.2.9.4. Recent Developments
- 11.2.9.5. Financials (Based on Availability)
- 11.2.10 Kollodis BioSciences
- 11.2.10.1. Overview
- 11.2.10.2. Products
- 11.2.10.3. SWOT Analysis
- 11.2.10.4. Recent Developments
- 11.2.10.5. Financials (Based on Availability)
- 11.2.1 Abcam
List of Figures
- Figure 1: Global In Vitro Angiogenesis Assay Kit Revenue Breakdown (undefined, %) by Region 2025 & 2033
- Figure 2: Global In Vitro Angiogenesis Assay Kit Volume Breakdown (K, %) by Region 2025 & 2033
- Figure 3: North America In Vitro Angiogenesis Assay Kit Revenue (undefined), by Application 2025 & 2033
- Figure 4: North America In Vitro Angiogenesis Assay Kit Volume (K), by Application 2025 & 2033
- Figure 5: North America In Vitro Angiogenesis Assay Kit Revenue Share (%), by Application 2025 & 2033
- Figure 6: North America In Vitro Angiogenesis Assay Kit Volume Share (%), by Application 2025 & 2033
- Figure 7: North America In Vitro Angiogenesis Assay Kit Revenue (undefined), by Types 2025 & 2033
- Figure 8: North America In Vitro Angiogenesis Assay Kit Volume (K), by Types 2025 & 2033
- Figure 9: North America In Vitro Angiogenesis Assay Kit Revenue Share (%), by Types 2025 & 2033
- Figure 10: North America In Vitro Angiogenesis Assay Kit Volume Share (%), by Types 2025 & 2033
- Figure 11: North America In Vitro Angiogenesis Assay Kit Revenue (undefined), by Country 2025 & 2033
- Figure 12: North America In Vitro Angiogenesis Assay Kit Volume (K), by Country 2025 & 2033
- Figure 13: North America In Vitro Angiogenesis Assay Kit Revenue Share (%), by Country 2025 & 2033
- Figure 14: North America In Vitro Angiogenesis Assay Kit Volume Share (%), by Country 2025 & 2033
- Figure 15: South America In Vitro Angiogenesis Assay Kit Revenue (undefined), by Application 2025 & 2033
- Figure 16: South America In Vitro Angiogenesis Assay Kit Volume (K), by Application 2025 & 2033
- Figure 17: South America In Vitro Angiogenesis Assay Kit Revenue Share (%), by Application 2025 & 2033
- Figure 18: South America In Vitro Angiogenesis Assay Kit Volume Share (%), by Application 2025 & 2033
- Figure 19: South America In Vitro Angiogenesis Assay Kit Revenue (undefined), by Types 2025 & 2033
- Figure 20: South America In Vitro Angiogenesis Assay Kit Volume (K), by Types 2025 & 2033
- Figure 21: South America In Vitro Angiogenesis Assay Kit Revenue Share (%), by Types 2025 & 2033
- Figure 22: South America In Vitro Angiogenesis Assay Kit Volume Share (%), by Types 2025 & 2033
- Figure 23: South America In Vitro Angiogenesis Assay Kit Revenue (undefined), by Country 2025 & 2033
- Figure 24: South America In Vitro Angiogenesis Assay Kit Volume (K), by Country 2025 & 2033
- Figure 25: South America In Vitro Angiogenesis Assay Kit Revenue Share (%), by Country 2025 & 2033
- Figure 26: South America In Vitro Angiogenesis Assay Kit Volume Share (%), by Country 2025 & 2033
- Figure 27: Europe In Vitro Angiogenesis Assay Kit Revenue (undefined), by Application 2025 & 2033
- Figure 28: Europe In Vitro Angiogenesis Assay Kit Volume (K), by Application 2025 & 2033
- Figure 29: Europe In Vitro Angiogenesis Assay Kit Revenue Share (%), by Application 2025 & 2033
- Figure 30: Europe In Vitro Angiogenesis Assay Kit Volume Share (%), by Application 2025 & 2033
- Figure 31: Europe In Vitro Angiogenesis Assay Kit Revenue (undefined), by Types 2025 & 2033
- Figure 32: Europe In Vitro Angiogenesis Assay Kit Volume (K), by Types 2025 & 2033
- Figure 33: Europe In Vitro Angiogenesis Assay Kit Revenue Share (%), by Types 2025 & 2033
- Figure 34: Europe In Vitro Angiogenesis Assay Kit Volume Share (%), by Types 2025 & 2033
- Figure 35: Europe In Vitro Angiogenesis Assay Kit Revenue (undefined), by Country 2025 & 2033
- Figure 36: Europe In Vitro Angiogenesis Assay Kit Volume (K), by Country 2025 & 2033
- Figure 37: Europe In Vitro Angiogenesis Assay Kit Revenue Share (%), by Country 2025 & 2033
- Figure 38: Europe In Vitro Angiogenesis Assay Kit Volume Share (%), by Country 2025 & 2033
- Figure 39: Middle East & Africa In Vitro Angiogenesis Assay Kit Revenue (undefined), by Application 2025 & 2033
- Figure 40: Middle East & Africa In Vitro Angiogenesis Assay Kit Volume (K), by Application 2025 & 2033
- Figure 41: Middle East & Africa In Vitro Angiogenesis Assay Kit Revenue Share (%), by Application 2025 & 2033
- Figure 42: Middle East & Africa In Vitro Angiogenesis Assay Kit Volume Share (%), by Application 2025 & 2033
- Figure 43: Middle East & Africa In Vitro Angiogenesis Assay Kit Revenue (undefined), by Types 2025 & 2033
- Figure 44: Middle East & Africa In Vitro Angiogenesis Assay Kit Volume (K), by Types 2025 & 2033
- Figure 45: Middle East & Africa In Vitro Angiogenesis Assay Kit Revenue Share (%), by Types 2025 & 2033
- Figure 46: Middle East & Africa In Vitro Angiogenesis Assay Kit Volume Share (%), by Types 2025 & 2033
- Figure 47: Middle East & Africa In Vitro Angiogenesis Assay Kit Revenue (undefined), by Country 2025 & 2033
- Figure 48: Middle East & Africa In Vitro Angiogenesis Assay Kit Volume (K), by Country 2025 & 2033
- Figure 49: Middle East & Africa In Vitro Angiogenesis Assay Kit Revenue Share (%), by Country 2025 & 2033
- Figure 50: Middle East & Africa In Vitro Angiogenesis Assay Kit Volume Share (%), by Country 2025 & 2033
- Figure 51: Asia Pacific In Vitro Angiogenesis Assay Kit Revenue (undefined), by Application 2025 & 2033
- Figure 52: Asia Pacific In Vitro Angiogenesis Assay Kit Volume (K), by Application 2025 & 2033
- Figure 53: Asia Pacific In Vitro Angiogenesis Assay Kit Revenue Share (%), by Application 2025 & 2033
- Figure 54: Asia Pacific In Vitro Angiogenesis Assay Kit Volume Share (%), by Application 2025 & 2033
- Figure 55: Asia Pacific In Vitro Angiogenesis Assay Kit Revenue (undefined), by Types 2025 & 2033
- Figure 56: Asia Pacific In Vitro Angiogenesis Assay Kit Volume (K), by Types 2025 & 2033
- Figure 57: Asia Pacific In Vitro Angiogenesis Assay Kit Revenue Share (%), by Types 2025 & 2033
- Figure 58: Asia Pacific In Vitro Angiogenesis Assay Kit Volume Share (%), by Types 2025 & 2033
- Figure 59: Asia Pacific In Vitro Angiogenesis Assay Kit Revenue (undefined), by Country 2025 & 2033
- Figure 60: Asia Pacific In Vitro Angiogenesis Assay Kit Volume (K), by Country 2025 & 2033
- Figure 61: Asia Pacific In Vitro Angiogenesis Assay Kit Revenue Share (%), by Country 2025 & 2033
- Figure 62: Asia Pacific In Vitro Angiogenesis Assay Kit Volume Share (%), by Country 2025 & 2033
List of Tables
- Table 1: Global In Vitro Angiogenesis Assay Kit Revenue undefined Forecast, by Application 2020 & 2033
- Table 2: Global In Vitro Angiogenesis Assay Kit Volume K Forecast, by Application 2020 & 2033
- Table 3: Global In Vitro Angiogenesis Assay Kit Revenue undefined Forecast, by Types 2020 & 2033
- Table 4: Global In Vitro Angiogenesis Assay Kit Volume K Forecast, by Types 2020 & 2033
- Table 5: Global In Vitro Angiogenesis Assay Kit Revenue undefined Forecast, by Region 2020 & 2033
- Table 6: Global In Vitro Angiogenesis Assay Kit Volume K Forecast, by Region 2020 & 2033
- Table 7: Global In Vitro Angiogenesis Assay Kit Revenue undefined Forecast, by Application 2020 & 2033
- Table 8: Global In Vitro Angiogenesis Assay Kit Volume K Forecast, by Application 2020 & 2033
- Table 9: Global In Vitro Angiogenesis Assay Kit Revenue undefined Forecast, by Types 2020 & 2033
- Table 10: Global In Vitro Angiogenesis Assay Kit Volume K Forecast, by Types 2020 & 2033
- Table 11: Global In Vitro Angiogenesis Assay Kit Revenue undefined Forecast, by Country 2020 & 2033
- Table 12: Global In Vitro Angiogenesis Assay Kit Volume K Forecast, by Country 2020 & 2033
- Table 13: United States In Vitro Angiogenesis Assay Kit Revenue (undefined) Forecast, by Application 2020 & 2033
- Table 14: United States In Vitro Angiogenesis Assay Kit Volume (K) Forecast, by Application 2020 & 2033
- Table 15: Canada In Vitro Angiogenesis Assay Kit Revenue (undefined) Forecast, by Application 2020 & 2033
- Table 16: Canada In Vitro Angiogenesis Assay Kit Volume (K) Forecast, by Application 2020 & 2033
- Table 17: Mexico In Vitro Angiogenesis Assay Kit Revenue (undefined) Forecast, by Application 2020 & 2033
- Table 18: Mexico In Vitro Angiogenesis Assay Kit Volume (K) Forecast, by Application 2020 & 2033
- Table 19: Global In Vitro Angiogenesis Assay Kit Revenue undefined Forecast, by Application 2020 & 2033
- Table 20: Global In Vitro Angiogenesis Assay Kit Volume K Forecast, by Application 2020 & 2033
- Table 21: Global In Vitro Angiogenesis Assay Kit Revenue undefined Forecast, by Types 2020 & 2033
- Table 22: Global In Vitro Angiogenesis Assay Kit Volume K Forecast, by Types 2020 & 2033
- Table 23: Global In Vitro Angiogenesis Assay Kit Revenue undefined Forecast, by Country 2020 & 2033
- Table 24: Global In Vitro Angiogenesis Assay Kit Volume K Forecast, by Country 2020 & 2033
- Table 25: Brazil In Vitro Angiogenesis Assay Kit Revenue (undefined) Forecast, by Application 2020 & 2033
- Table 26: Brazil In Vitro Angiogenesis Assay Kit Volume (K) Forecast, by Application 2020 & 2033
- Table 27: Argentina In Vitro Angiogenesis Assay Kit Revenue (undefined) Forecast, by Application 2020 & 2033
- Table 28: Argentina In Vitro Angiogenesis Assay Kit Volume (K) Forecast, by Application 2020 & 2033
- Table 29: Rest of South America In Vitro Angiogenesis Assay Kit Revenue (undefined) Forecast, by Application 2020 & 2033
- Table 30: Rest of South America In Vitro Angiogenesis Assay Kit Volume (K) Forecast, by Application 2020 & 2033
- Table 31: Global In Vitro Angiogenesis Assay Kit Revenue undefined Forecast, by Application 2020 & 2033
- Table 32: Global In Vitro Angiogenesis Assay Kit Volume K Forecast, by Application 2020 & 2033
- Table 33: Global In Vitro Angiogenesis Assay Kit Revenue undefined Forecast, by Types 2020 & 2033
- Table 34: Global In Vitro Angiogenesis Assay Kit Volume K Forecast, by Types 2020 & 2033
- Table 35: Global In Vitro Angiogenesis Assay Kit Revenue undefined Forecast, by Country 2020 & 2033
- Table 36: Global In Vitro Angiogenesis Assay Kit Volume K Forecast, by Country 2020 & 2033
- Table 37: United Kingdom In Vitro Angiogenesis Assay Kit Revenue (undefined) Forecast, by Application 2020 & 2033
- Table 38: United Kingdom In Vitro Angiogenesis Assay Kit Volume (K) Forecast, by Application 2020 & 2033
- Table 39: Germany In Vitro Angiogenesis Assay Kit Revenue (undefined) Forecast, by Application 2020 & 2033
- Table 40: Germany In Vitro Angiogenesis Assay Kit Volume (K) Forecast, by Application 2020 & 2033
- Table 41: France In Vitro Angiogenesis Assay Kit Revenue (undefined) Forecast, by Application 2020 & 2033
- Table 42: France In Vitro Angiogenesis Assay Kit Volume (K) Forecast, by Application 2020 & 2033
- Table 43: Italy In Vitro Angiogenesis Assay Kit Revenue (undefined) Forecast, by Application 2020 & 2033
- Table 44: Italy In Vitro Angiogenesis Assay Kit Volume (K) Forecast, by Application 2020 & 2033
- Table 45: Spain In Vitro Angiogenesis Assay Kit Revenue (undefined) Forecast, by Application 2020 & 2033
- Table 46: Spain In Vitro Angiogenesis Assay Kit Volume (K) Forecast, by Application 2020 & 2033
- Table 47: Russia In Vitro Angiogenesis Assay Kit Revenue (undefined) Forecast, by Application 2020 & 2033
- Table 48: Russia In Vitro Angiogenesis Assay Kit Volume (K) Forecast, by Application 2020 & 2033
- Table 49: Benelux In Vitro Angiogenesis Assay Kit Revenue (undefined) Forecast, by Application 2020 & 2033
- Table 50: Benelux In Vitro Angiogenesis Assay Kit Volume (K) Forecast, by Application 2020 & 2033
- Table 51: Nordics In Vitro Angiogenesis Assay Kit Revenue (undefined) Forecast, by Application 2020 & 2033
- Table 52: Nordics In Vitro Angiogenesis Assay Kit Volume (K) Forecast, by Application 2020 & 2033
- Table 53: Rest of Europe In Vitro Angiogenesis Assay Kit Revenue (undefined) Forecast, by Application 2020 & 2033
- Table 54: Rest of Europe In Vitro Angiogenesis Assay Kit Volume (K) Forecast, by Application 2020 & 2033
- Table 55: Global In Vitro Angiogenesis Assay Kit Revenue undefined Forecast, by Application 2020 & 2033
- Table 56: Global In Vitro Angiogenesis Assay Kit Volume K Forecast, by Application 2020 & 2033
- Table 57: Global In Vitro Angiogenesis Assay Kit Revenue undefined Forecast, by Types 2020 & 2033
- Table 58: Global In Vitro Angiogenesis Assay Kit Volume K Forecast, by Types 2020 & 2033
- Table 59: Global In Vitro Angiogenesis Assay Kit Revenue undefined Forecast, by Country 2020 & 2033
- Table 60: Global In Vitro Angiogenesis Assay Kit Volume K Forecast, by Country 2020 & 2033
- Table 61: Turkey In Vitro Angiogenesis Assay Kit Revenue (undefined) Forecast, by Application 2020 & 2033
- Table 62: Turkey In Vitro Angiogenesis Assay Kit Volume (K) Forecast, by Application 2020 & 2033
- Table 63: Israel In Vitro Angiogenesis Assay Kit Revenue (undefined) Forecast, by Application 2020 & 2033
- Table 64: Israel In Vitro Angiogenesis Assay Kit Volume (K) Forecast, by Application 2020 & 2033
- Table 65: GCC In Vitro Angiogenesis Assay Kit Revenue (undefined) Forecast, by Application 2020 & 2033
- Table 66: GCC In Vitro Angiogenesis Assay Kit Volume (K) Forecast, by Application 2020 & 2033
- Table 67: North Africa In Vitro Angiogenesis Assay Kit Revenue (undefined) Forecast, by Application 2020 & 2033
- Table 68: North Africa In Vitro Angiogenesis Assay Kit Volume (K) Forecast, by Application 2020 & 2033
- Table 69: South Africa In Vitro Angiogenesis Assay Kit Revenue (undefined) Forecast, by Application 2020 & 2033
- Table 70: South Africa In Vitro Angiogenesis Assay Kit Volume (K) Forecast, by Application 2020 & 2033
- Table 71: Rest of Middle East & Africa In Vitro Angiogenesis Assay Kit Revenue (undefined) Forecast, by Application 2020 & 2033
- Table 72: Rest of Middle East & Africa In Vitro Angiogenesis Assay Kit Volume (K) Forecast, by Application 2020 & 2033
- Table 73: Global In Vitro Angiogenesis Assay Kit Revenue undefined Forecast, by Application 2020 & 2033
- Table 74: Global In Vitro Angiogenesis Assay Kit Volume K Forecast, by Application 2020 & 2033
- Table 75: Global In Vitro Angiogenesis Assay Kit Revenue undefined Forecast, by Types 2020 & 2033
- Table 76: Global In Vitro Angiogenesis Assay Kit Volume K Forecast, by Types 2020 & 2033
- Table 77: Global In Vitro Angiogenesis Assay Kit Revenue undefined Forecast, by Country 2020 & 2033
- Table 78: Global In Vitro Angiogenesis Assay Kit Volume K Forecast, by Country 2020 & 2033
- Table 79: China In Vitro Angiogenesis Assay Kit Revenue (undefined) Forecast, by Application 2020 & 2033
- Table 80: China In Vitro Angiogenesis Assay Kit Volume (K) Forecast, by Application 2020 & 2033
- Table 81: India In Vitro Angiogenesis Assay Kit Revenue (undefined) Forecast, by Application 2020 & 2033
- Table 82: India In Vitro Angiogenesis Assay Kit Volume (K) Forecast, by Application 2020 & 2033
- Table 83: Japan In Vitro Angiogenesis Assay Kit Revenue (undefined) Forecast, by Application 2020 & 2033
- Table 84: Japan In Vitro Angiogenesis Assay Kit Volume (K) Forecast, by Application 2020 & 2033
- Table 85: South Korea In Vitro Angiogenesis Assay Kit Revenue (undefined) Forecast, by Application 2020 & 2033
- Table 86: South Korea In Vitro Angiogenesis Assay Kit Volume (K) Forecast, by Application 2020 & 2033
- Table 87: ASEAN In Vitro Angiogenesis Assay Kit Revenue (undefined) Forecast, by Application 2020 & 2033
- Table 88: ASEAN In Vitro Angiogenesis Assay Kit Volume (K) Forecast, by Application 2020 & 2033
- Table 89: Oceania In Vitro Angiogenesis Assay Kit Revenue (undefined) Forecast, by Application 2020 & 2033
- Table 90: Oceania In Vitro Angiogenesis Assay Kit Volume (K) Forecast, by Application 2020 & 2033
- Table 91: Rest of Asia Pacific In Vitro Angiogenesis Assay Kit Revenue (undefined) Forecast, by Application 2020 & 2033
- Table 92: Rest of Asia Pacific In Vitro Angiogenesis Assay Kit Volume (K) Forecast, by Application 2020 & 2033
Frequently Asked Questions
1. What is the projected Compound Annual Growth Rate (CAGR) of the In Vitro Angiogenesis Assay Kit?
The projected CAGR is approximately 16.01%.
2. Which companies are prominent players in the In Vitro Angiogenesis Assay Kit?
Key companies in the market include Abcam, R&D Systems, Thermo Fisher Scientific, Cell Biolabs, Merck Millipore, Creative Bioarray, ibidi, TheWell Bioscience, MyBiosource, Kollodis BioSciences.
3. What are the main segments of the In Vitro Angiogenesis Assay Kit?
The market segments include Application, Types.
4. Can you provide details about the market size?
The market size is estimated to be USD XXX N/A as of 2022.
5. What are some drivers contributing to market growth?
N/A
6. What are the notable trends driving market growth?
N/A
7. Are there any restraints impacting market growth?
N/A
8. Can you provide examples of recent developments in the market?
N/A
9. What pricing options are available for accessing the report?
Pricing options include single-user, multi-user, and enterprise licenses priced at USD 4350.00, USD 6525.00, and USD 8700.00 respectively.
10. Is the market size provided in terms of value or volume?
The market size is provided in terms of value, measured in N/A and volume, measured in K.
11. Are there any specific market keywords associated with the report?
Yes, the market keyword associated with the report is "In Vitro Angiogenesis Assay Kit," which aids in identifying and referencing the specific market segment covered.
12. How do I determine which pricing option suits my needs best?
The pricing options vary based on user requirements and access needs. Individual users may opt for single-user licenses, while businesses requiring broader access may choose multi-user or enterprise licenses for cost-effective access to the report.
13. Are there any additional resources or data provided in the In Vitro Angiogenesis Assay Kit report?
While the report offers comprehensive insights, it's advisable to review the specific contents or supplementary materials provided to ascertain if additional resources or data are available.
14. How can I stay updated on further developments or reports in the In Vitro Angiogenesis Assay Kit?
To stay informed about further developments, trends, and reports in the In Vitro Angiogenesis Assay Kit, consider subscribing to industry newsletters, following relevant companies and organizations, or regularly checking reputable industry news sources and publications.
Methodology
Step 1 - Identification of Relevant Samples Size from Population Database


Step 2 - Approaches for Defining Global Market Size (Value, Volume* & Price*)

Note*: In applicable scenarios
Step 3 - Data Sources
Primary Research
- Web Analytics
- Survey Reports
- Research Institute
- Latest Research Reports
- Opinion Leaders
Secondary Research
- Annual Reports
- White Paper
- Latest Press Release
- Industry Association
- Paid Database
- Investor Presentations

Step 4 - Data Triangulation
Involves using different sources of information in order to increase the validity of a study
These sources are likely to be stakeholders in a program - participants, other researchers, program staff, other community members, and so on.
Then we put all data in single framework & apply various statistical tools to find out the dynamic on the market.
During the analysis stage, feedback from the stakeholder groups would be compared to determine areas of agreement as well as areas of divergence