

Key Insights
The global Hydration Products market is poised for significant expansion, with an estimated market size of $801.9 million in 2025, projected to grow at a robust Compound Annual Growth Rate (CAGR) of 6.1% through 2033. This upward trajectory is primarily fueled by increasing consumer awareness regarding the importance of adequate hydration for health and performance, especially within the rapidly growing sports and outdoor recreation sectors. The demand for advanced hydration solutions, such as advanced hydration packs with integrated filtration and smart water bottles, is on the rise, catering to the needs of athletes, hikers, and military personnel. Technological innovations, including lightweight materials, improved insulation, and user-friendly designs, are further stimulating market growth. The expanding global middle class and rising disposable incomes in emerging economies are also contributing to increased purchasing power for premium hydration products.
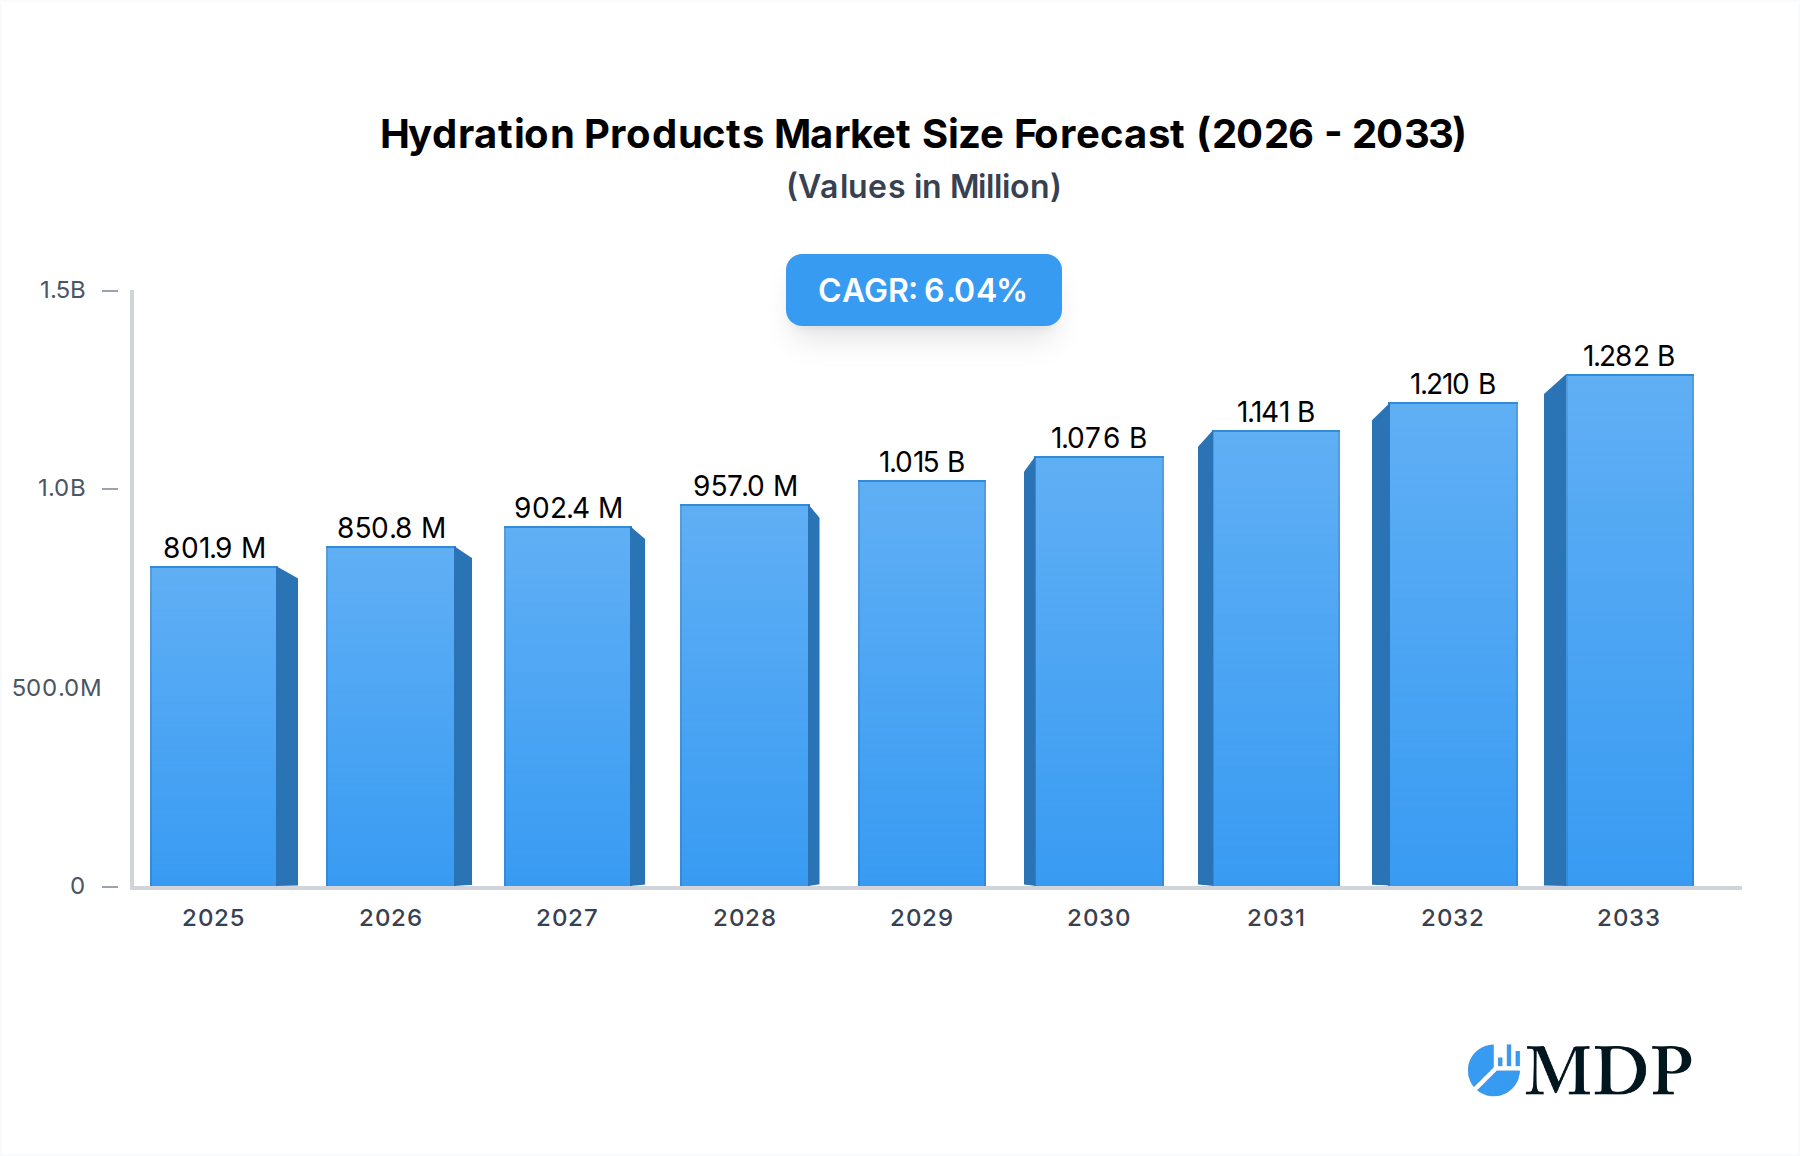
Hydration Products Market Size (In Million)
Key drivers for this market include the growing participation in fitness activities and sports globally, coupled with a heightened emphasis on personal well-being. The military sector's continuous demand for reliable and efficient hydration systems for operational readiness also plays a crucial role. Furthermore, the rising popularity of outdoor adventures like hiking, camping, and cycling directly translates to a higher demand for portable and functional hydration solutions. Despite these positive trends, the market faces certain restraints, including the initial higher cost of premium hydration products compared to basic water bottles, which could deter price-sensitive consumers in developing regions. Intense competition among established players and the emergence of new entrants also present a dynamic market landscape. However, ongoing product innovation, strategic partnerships, and targeted marketing efforts are expected to mitigate these challenges and propel the market forward.

Hydration Products Company Market Share
Unlock comprehensive insights into the global Hydration Products market with this in-depth report. Covering the study period from 2019 to 2033, with a base year of 2025 and a forecast period from 2025 to 2033, this report offers a detailed analysis of market dynamics, key trends, leading segments, and future opportunities. Discover the growth trajectories of hydration packs, water bottles, purification systems, and accessories, with a particular focus on applications in sports and military sectors. Featuring analysis of industry giants such as CamelBak, GEIGERRIG, HydraPak, and Osprey, this report is an essential resource for stakeholders seeking to navigate and capitalize on the evolving hydration solutions landscape.
Hydration Products Market Dynamics & Concentration
The hydration products market exhibits a moderate to high concentration, with established players like CamelBak and Osprey holding significant market share, estimated at over 20 million units sold annually by key competitors. Innovation remains a primary driver, with companies investing heavily in advanced materials, ergonomic designs, and smart hydration tracking technologies, projected to fuel over 1.5 million new product introductions by 2028. Regulatory frameworks, particularly concerning BPA-free materials and sustainability standards, are increasingly influencing product development and manufacturing processes, with compliance affecting an estimated 30% of new product approvals. Product substitutes, while present in the form of basic water bottles, are increasingly being differentiated by features such as insulation, filtration, and portability. End-user trends highlight a growing demand for lightweight, durable, and eco-friendly hydration solutions across sports, military, and everyday use. Mergers and acquisitions (M&A) activity is observed, with approximately 5-7 significant deals per year valued in the tens of millions, aimed at expanding product portfolios and market reach.
Hydration Products Industry Trends & Analysis
The global hydration products market is experiencing robust growth, driven by increasing health consciousness, a surge in outdoor recreational activities, and the expanding military and defense sectors. The market is projected to witness a Compound Annual Growth Rate (CAGR) of approximately 6.5% over the forecast period, reaching an estimated market value of over 15 billion dollars by 2033. Technological advancements are playing a pivotal role, with the integration of smart features like hydration monitoring, temperature regulation, and self-cleaning mechanisms becoming a significant trend. For instance, the market penetration of smart hydration bottles has surged from less than 2% in 2019 to an estimated 8% in 2024, with projections to exceed 25% by 2033. Consumer preferences are shifting towards sustainable and eco-friendly materials, leading to increased demand for reusable and BPA-free hydration solutions. Companies are responding by investing in recyclable plastics, plant-based materials, and durable designs that minimize waste, impacting an estimated 40% of new product developments. Competitive dynamics are intensifying, with both established brands and emerging startups vying for market share through product differentiation, strategic partnerships, and aggressive marketing campaigns. The military segment, in particular, is a significant growth driver, demanding advanced hydration systems that offer superior durability, portability, and performance in extreme conditions. The sports and outdoor recreation segment continues to be a cornerstone of market growth, fueled by a rising participation in activities such as hiking, cycling, running, and camping, with an estimated 50 million new participants annually. The “others” segment, encompassing everyday commuters and travelers, also presents substantial growth potential as individuals prioritize convenient and healthy hydration options on the go.
Leading Markets & Segments in Hydration Products
The Sports application segment is a dominant force in the global hydration products market, driven by the increasing popularity of outdoor activities and fitness trends. This segment is estimated to account for over 45% of the total market revenue, projected to reach over 7 billion dollars by 2033. Key drivers include a growing emphasis on hydration for athletic performance, the burgeoning athleisure market, and increased disposable income allocated to sports equipment and accessories. Economic policies supporting sports infrastructure and public health initiatives encouraging active lifestyles further bolster this segment.
Within the Types of hydration products, Hydration Packs and Water Bottles are the leading categories. Hydration packs, with their hands-free operation and high capacity, are particularly favored in sports and military applications. Their market share is projected to grow at a CAGR of over 7%, driven by technological advancements in bladder design and insulation. Water bottles, while a mature segment, continue to see innovation in materials, insulation, and smart features, maintaining a significant market presence. The Purification and Filtration segment is experiencing substantial growth, driven by increasing concerns over water quality and the demand for safe drinking water in outdoor and travel scenarios. This segment is expected to witness a CAGR of over 8%, fueled by advancements in portable filtration technologies.
Geographically, North America and Europe currently lead the market, collectively holding over 60% of the global market share. This dominance is attributed to high disposable incomes, a well-established sporting culture, and strong consumer awareness regarding health and hydration. The Asia-Pacific region, however, is emerging as a high-growth market, with rapid urbanization, increasing participation in outdoor activities, and rising disposable incomes expected to drive significant expansion. Government initiatives promoting healthy lifestyles and investments in sports infrastructure in countries like China and India are key economic policies contributing to this growth.
Hydration Products Product Developments
Recent product developments in the hydration products sector are characterized by a strong emphasis on user convenience, durability, and sustainability. Innovations in hydration packs include lighter, more ergonomic designs with improved ventilation systems and integrated storage solutions. Water bottles are witnessing advancements in insulation technology, keeping beverages cold for over 24 hours or hot for over 12 hours, and the integration of UV-C purification systems for on-the-go sterilization. The use of antimicrobial materials and self-cleaning mechanisms is also gaining traction, enhancing hygiene. Furthermore, the industry is witnessing a surge in the adoption of recycled and biodegradable materials, aligning with growing consumer demand for eco-friendly products. These developments aim to enhance user experience and provide competitive advantages in a crowded market.
Key Drivers of Hydration Products Growth
Several key factors are propelling the growth of the hydration products market. Firstly, a significant rise in global health and wellness consciousness is driving consumers to prioritize adequate hydration for overall well-being, leading to increased demand for convenient hydration solutions. Secondly, the burgeoning popularity of outdoor recreational activities such as hiking, camping, cycling, and running, supported by favorable government initiatives promoting active lifestyles, creates a substantial user base for hydration packs and bottles. Thirdly, technological advancements, including the integration of smart features like hydration tracking and purification, are enhancing product functionality and appeal. Lastly, the ongoing demand from military and defense sectors for durable and high-performance hydration systems in challenging environments provides a consistent growth driver.
Challenges in the Hydration Products Market
Despite the positive growth trajectory, the hydration products market faces certain challenges. Intense competition from a multitude of brands, including both established players and new entrants, leads to price pressures and the need for continuous product innovation. Regulatory hurdles, particularly concerning material safety and environmental impact, can slow down product development and market entry. Furthermore, fluctuations in raw material prices, such as plastics and specialized fabrics, can impact manufacturing costs and profit margins. Supply chain disruptions, as witnessed in recent years, can affect product availability and lead times. Finally, the perceived high cost of premium hydration products can be a barrier for price-sensitive consumers, limiting market penetration in certain demographics.
Emerging Opportunities in Hydration Products
The hydration products market is ripe with emerging opportunities. Technological breakthroughs in smart materials and IoT integration present avenues for developing next-generation hydration systems with advanced functionalities. The growing global focus on sustainability and the circular economy offers significant opportunities for brands that can successfully implement eco-friendly materials and manufacturing processes, capturing a larger market share among environmentally conscious consumers. Strategic partnerships between hydration product manufacturers and sports apparel brands or fitness technology companies can lead to co-branded product lines and expanded market reach. Furthermore, the untapped potential in emerging economies, driven by increasing disposable incomes and a growing awareness of health and fitness, represents a significant opportunity for market expansion.
Leading Players in the Hydration Products Sector
- CamelBak
- GEIGERRIG
- HydraPak
- Osprey
- Nathan Sports
- Platypus
- Geigerrig
- Hydro Flask
- Klean Kanteen
- S'well
Key Milestones in Hydration Products Industry
- 2019: Increased adoption of BPA-free materials across the industry, driven by consumer demand and regulatory pressures.
- 2020: Rise in demand for insulated water bottles, with a surge in sales driven by increased at-home hydration and outdoor activities.
- 2021: Introduction of smart hydration bottles with integrated tracking capabilities by several key players.
- 2022: Growing emphasis on sustainable and recycled materials in hydration product manufacturing.
- 2023: Expansion of product lines to include a wider range of colors, designs, and capacities to cater to diverse consumer preferences.
- 2024: Increased investment in lightweight and durable materials for enhanced portability and performance in sports and outdoor applications.
Strategic Outlook for Hydration Products Market
The strategic outlook for the hydration products market remains exceptionally positive. Growth accelerators include the sustained demand for health and wellness products, coupled with the ever-growing participation in outdoor recreation and sports. The continued integration of smart technologies, focusing on user connectivity and health monitoring, will create premium product segments. Furthermore, the increasing global awareness of environmental sustainability is pushing manufacturers towards more eco-friendly materials and production methods, opening up opportunities for brands that prioritize this aspect. Expansion into emerging markets, driven by rising disposable incomes and increased adoption of active lifestyles, will also be a key growth driver. Strategic collaborations and targeted marketing campaigns will be crucial for maintaining a competitive edge.
Hydration Products Segmentation
-
1. Application
- 1.1. Sports
- 1.2. Military
- 1.3. Others
-
2. Types
- 2.1. Hydration Packs
- 2.2. Water Bottles
- 2.3. Purification and Filtration
- 2.4. Accessories
- 2.5. Others
Hydration Products Segmentation By Geography
-
1. North America
- 1.1. United States
- 1.2. Canada
- 1.3. Mexico
-
2. South America
- 2.1. Brazil
- 2.2. Argentina
- 2.3. Rest of South America
-
3. Europe
- 3.1. United Kingdom
- 3.2. Germany
- 3.3. France
- 3.4. Italy
- 3.5. Spain
- 3.6. Russia
- 3.7. Benelux
- 3.8. Nordics
- 3.9. Rest of Europe
-
4. Middle East & Africa
- 4.1. Turkey
- 4.2. Israel
- 4.3. GCC
- 4.4. North Africa
- 4.5. South Africa
- 4.6. Rest of Middle East & Africa
-
5. Asia Pacific
- 5.1. China
- 5.2. India
- 5.3. Japan
- 5.4. South Korea
- 5.5. ASEAN
- 5.6. Oceania
- 5.7. Rest of Asia Pacific
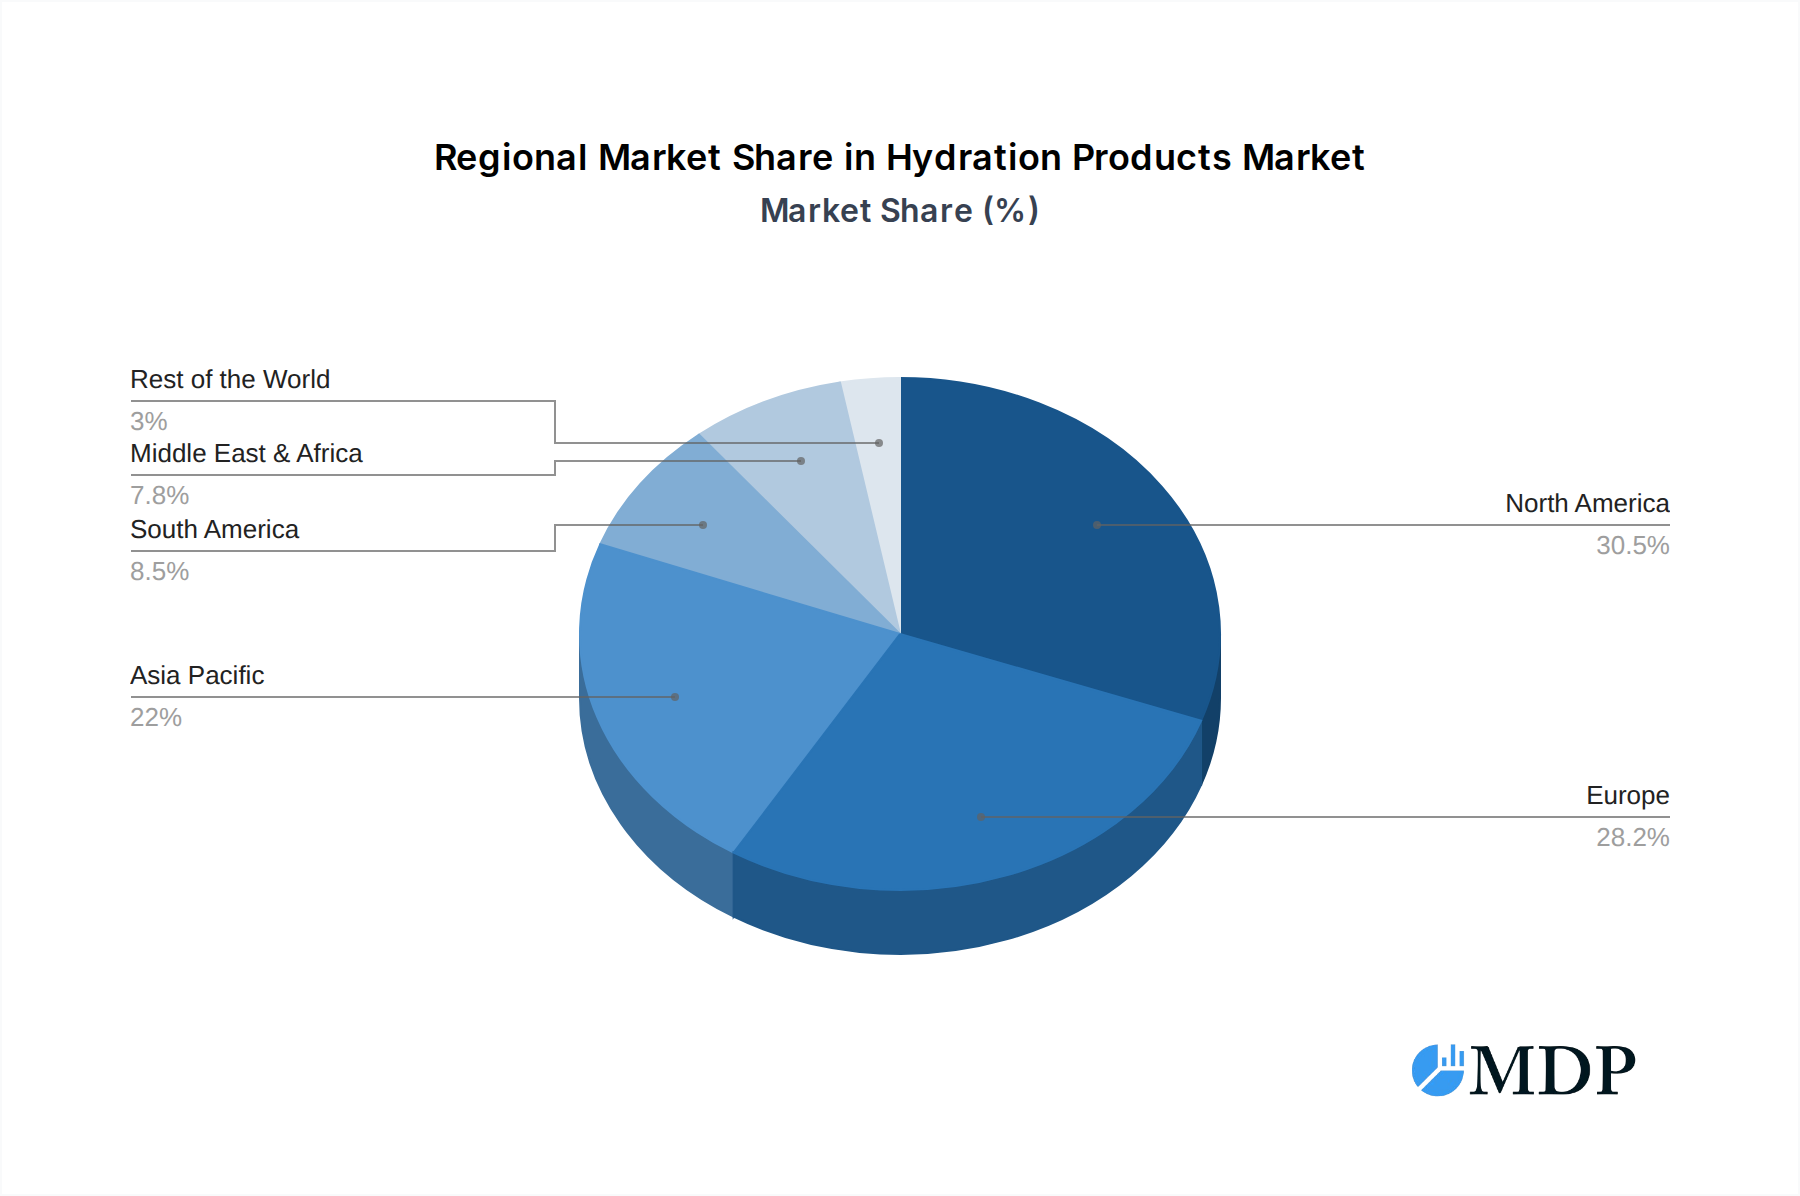
Hydration Products Regional Market Share
Geographic Coverage of Hydration Products
Hydration Products REPORT HIGHLIGHTS
| Aspects | Details |
|---|---|
| Study Period | 2020-2034 |
| Base Year | 2025 |
| Estimated Year | 2026 |
| Forecast Period | 2026-2034 |
| Historical Period | 2020-2025 |
| Growth Rate | CAGR of 6.1% from 2020-2034 |
| Segmentation |
|
Table of Contents
- 1. Introduction
- 1.1. Research Scope
- 1.2. Market Segmentation
- 1.3. Research Methodology
- 1.4. Definitions and Assumptions
- 2. Executive Summary
- 2.1. Introduction
- 3. Market Dynamics
- 3.1. Introduction
- 3.2. Market Drivers
- 3.3. Market Restrains
- 3.4. Market Trends
- 4. Market Factor Analysis
- 4.1. Porters Five Forces
- 4.2. Supply/Value Chain
- 4.3. PESTEL analysis
- 4.4. Market Entropy
- 4.5. Patent/Trademark Analysis
- 5. Global Hydration Products Analysis, Insights and Forecast, 2020-2032
- 5.1. Market Analysis, Insights and Forecast - by Application
- 5.1.1. Sports
- 5.1.2. Military
- 5.1.3. Others
- 5.2. Market Analysis, Insights and Forecast - by Types
- 5.2.1. Hydration Packs
- 5.2.2. Water Bottles
- 5.2.3. Purification and Filtration
- 5.2.4. Accessories
- 5.2.5. Others
- 5.3. Market Analysis, Insights and Forecast - by Region
- 5.3.1. North America
- 5.3.2. South America
- 5.3.3. Europe
- 5.3.4. Middle East & Africa
- 5.3.5. Asia Pacific
- 5.1. Market Analysis, Insights and Forecast - by Application
- 6. North America Hydration Products Analysis, Insights and Forecast, 2020-2032
- 6.1. Market Analysis, Insights and Forecast - by Application
- 6.1.1. Sports
- 6.1.2. Military
- 6.1.3. Others
- 6.2. Market Analysis, Insights and Forecast - by Types
- 6.2.1. Hydration Packs
- 6.2.2. Water Bottles
- 6.2.3. Purification and Filtration
- 6.2.4. Accessories
- 6.2.5. Others
- 6.1. Market Analysis, Insights and Forecast - by Application
- 7. South America Hydration Products Analysis, Insights and Forecast, 2020-2032
- 7.1. Market Analysis, Insights and Forecast - by Application
- 7.1.1. Sports
- 7.1.2. Military
- 7.1.3. Others
- 7.2. Market Analysis, Insights and Forecast - by Types
- 7.2.1. Hydration Packs
- 7.2.2. Water Bottles
- 7.2.3. Purification and Filtration
- 7.2.4. Accessories
- 7.2.5. Others
- 7.1. Market Analysis, Insights and Forecast - by Application
- 8. Europe Hydration Products Analysis, Insights and Forecast, 2020-2032
- 8.1. Market Analysis, Insights and Forecast - by Application
- 8.1.1. Sports
- 8.1.2. Military
- 8.1.3. Others
- 8.2. Market Analysis, Insights and Forecast - by Types
- 8.2.1. Hydration Packs
- 8.2.2. Water Bottles
- 8.2.3. Purification and Filtration
- 8.2.4. Accessories
- 8.2.5. Others
- 8.1. Market Analysis, Insights and Forecast - by Application
- 9. Middle East & Africa Hydration Products Analysis, Insights and Forecast, 2020-2032
- 9.1. Market Analysis, Insights and Forecast - by Application
- 9.1.1. Sports
- 9.1.2. Military
- 9.1.3. Others
- 9.2. Market Analysis, Insights and Forecast - by Types
- 9.2.1. Hydration Packs
- 9.2.2. Water Bottles
- 9.2.3. Purification and Filtration
- 9.2.4. Accessories
- 9.2.5. Others
- 9.1. Market Analysis, Insights and Forecast - by Application
- 10. Asia Pacific Hydration Products Analysis, Insights and Forecast, 2020-2032
- 10.1. Market Analysis, Insights and Forecast - by Application
- 10.1.1. Sports
- 10.1.2. Military
- 10.1.3. Others
- 10.2. Market Analysis, Insights and Forecast - by Types
- 10.2.1. Hydration Packs
- 10.2.2. Water Bottles
- 10.2.3. Purification and Filtration
- 10.2.4. Accessories
- 10.2.5. Others
- 10.1. Market Analysis, Insights and Forecast - by Application
- 11. Competitive Analysis
- 11.1. Global Market Share Analysis 2025
- 11.2. Company Profiles
- 11.2.1 CamelBak
- 11.2.1.1. Overview
- 11.2.1.2. Products
- 11.2.1.3. SWOT Analysis
- 11.2.1.4. Recent Developments
- 11.2.1.5. Financials (Based on Availability)
- 11.2.2 GEIGERRIG
- 11.2.2.1. Overview
- 11.2.2.2. Products
- 11.2.2.3. SWOT Analysis
- 11.2.2.4. Recent Developments
- 11.2.2.5. Financials (Based on Availability)
- 11.2.3 HydraPak
- 11.2.3.1. Overview
- 11.2.3.2. Products
- 11.2.3.3. SWOT Analysis
- 11.2.3.4. Recent Developments
- 11.2.3.5. Financials (Based on Availability)
- 11.2.4 Osprey
- 11.2.4.1. Overview
- 11.2.4.2. Products
- 11.2.4.3. SWOT Analysis
- 11.2.4.4. Recent Developments
- 11.2.4.5. Financials (Based on Availability)
- 11.2.1 CamelBak
List of Figures
- Figure 1: Global Hydration Products Revenue Breakdown (million, %) by Region 2025 & 2033
- Figure 2: North America Hydration Products Revenue (million), by Application 2025 & 2033
- Figure 3: North America Hydration Products Revenue Share (%), by Application 2025 & 2033
- Figure 4: North America Hydration Products Revenue (million), by Types 2025 & 2033
- Figure 5: North America Hydration Products Revenue Share (%), by Types 2025 & 2033
- Figure 6: North America Hydration Products Revenue (million), by Country 2025 & 2033
- Figure 7: North America Hydration Products Revenue Share (%), by Country 2025 & 2033
- Figure 8: South America Hydration Products Revenue (million), by Application 2025 & 2033
- Figure 9: South America Hydration Products Revenue Share (%), by Application 2025 & 2033
- Figure 10: South America Hydration Products Revenue (million), by Types 2025 & 2033
- Figure 11: South America Hydration Products Revenue Share (%), by Types 2025 & 2033
- Figure 12: South America Hydration Products Revenue (million), by Country 2025 & 2033
- Figure 13: South America Hydration Products Revenue Share (%), by Country 2025 & 2033
- Figure 14: Europe Hydration Products Revenue (million), by Application 2025 & 2033
- Figure 15: Europe Hydration Products Revenue Share (%), by Application 2025 & 2033
- Figure 16: Europe Hydration Products Revenue (million), by Types 2025 & 2033
- Figure 17: Europe Hydration Products Revenue Share (%), by Types 2025 & 2033
- Figure 18: Europe Hydration Products Revenue (million), by Country 2025 & 2033
- Figure 19: Europe Hydration Products Revenue Share (%), by Country 2025 & 2033
- Figure 20: Middle East & Africa Hydration Products Revenue (million), by Application 2025 & 2033
- Figure 21: Middle East & Africa Hydration Products Revenue Share (%), by Application 2025 & 2033
- Figure 22: Middle East & Africa Hydration Products Revenue (million), by Types 2025 & 2033
- Figure 23: Middle East & Africa Hydration Products Revenue Share (%), by Types 2025 & 2033
- Figure 24: Middle East & Africa Hydration Products Revenue (million), by Country 2025 & 2033
- Figure 25: Middle East & Africa Hydration Products Revenue Share (%), by Country 2025 & 2033
- Figure 26: Asia Pacific Hydration Products Revenue (million), by Application 2025 & 2033
- Figure 27: Asia Pacific Hydration Products Revenue Share (%), by Application 2025 & 2033
- Figure 28: Asia Pacific Hydration Products Revenue (million), by Types 2025 & 2033
- Figure 29: Asia Pacific Hydration Products Revenue Share (%), by Types 2025 & 2033
- Figure 30: Asia Pacific Hydration Products Revenue (million), by Country 2025 & 2033
- Figure 31: Asia Pacific Hydration Products Revenue Share (%), by Country 2025 & 2033
List of Tables
- Table 1: Global Hydration Products Revenue million Forecast, by Application 2020 & 2033
- Table 2: Global Hydration Products Revenue million Forecast, by Types 2020 & 2033
- Table 3: Global Hydration Products Revenue million Forecast, by Region 2020 & 2033
- Table 4: Global Hydration Products Revenue million Forecast, by Application 2020 & 2033
- Table 5: Global Hydration Products Revenue million Forecast, by Types 2020 & 2033
- Table 6: Global Hydration Products Revenue million Forecast, by Country 2020 & 2033
- Table 7: United States Hydration Products Revenue (million) Forecast, by Application 2020 & 2033
- Table 8: Canada Hydration Products Revenue (million) Forecast, by Application 2020 & 2033
- Table 9: Mexico Hydration Products Revenue (million) Forecast, by Application 2020 & 2033
- Table 10: Global Hydration Products Revenue million Forecast, by Application 2020 & 2033
- Table 11: Global Hydration Products Revenue million Forecast, by Types 2020 & 2033
- Table 12: Global Hydration Products Revenue million Forecast, by Country 2020 & 2033
- Table 13: Brazil Hydration Products Revenue (million) Forecast, by Application 2020 & 2033
- Table 14: Argentina Hydration Products Revenue (million) Forecast, by Application 2020 & 2033
- Table 15: Rest of South America Hydration Products Revenue (million) Forecast, by Application 2020 & 2033
- Table 16: Global Hydration Products Revenue million Forecast, by Application 2020 & 2033
- Table 17: Global Hydration Products Revenue million Forecast, by Types 2020 & 2033
- Table 18: Global Hydration Products Revenue million Forecast, by Country 2020 & 2033
- Table 19: United Kingdom Hydration Products Revenue (million) Forecast, by Application 2020 & 2033
- Table 20: Germany Hydration Products Revenue (million) Forecast, by Application 2020 & 2033
- Table 21: France Hydration Products Revenue (million) Forecast, by Application 2020 & 2033
- Table 22: Italy Hydration Products Revenue (million) Forecast, by Application 2020 & 2033
- Table 23: Spain Hydration Products Revenue (million) Forecast, by Application 2020 & 2033
- Table 24: Russia Hydration Products Revenue (million) Forecast, by Application 2020 & 2033
- Table 25: Benelux Hydration Products Revenue (million) Forecast, by Application 2020 & 2033
- Table 26: Nordics Hydration Products Revenue (million) Forecast, by Application 2020 & 2033
- Table 27: Rest of Europe Hydration Products Revenue (million) Forecast, by Application 2020 & 2033
- Table 28: Global Hydration Products Revenue million Forecast, by Application 2020 & 2033
- Table 29: Global Hydration Products Revenue million Forecast, by Types 2020 & 2033
- Table 30: Global Hydration Products Revenue million Forecast, by Country 2020 & 2033
- Table 31: Turkey Hydration Products Revenue (million) Forecast, by Application 2020 & 2033
- Table 32: Israel Hydration Products Revenue (million) Forecast, by Application 2020 & 2033
- Table 33: GCC Hydration Products Revenue (million) Forecast, by Application 2020 & 2033
- Table 34: North Africa Hydration Products Revenue (million) Forecast, by Application 2020 & 2033
- Table 35: South Africa Hydration Products Revenue (million) Forecast, by Application 2020 & 2033
- Table 36: Rest of Middle East & Africa Hydration Products Revenue (million) Forecast, by Application 2020 & 2033
- Table 37: Global Hydration Products Revenue million Forecast, by Application 2020 & 2033
- Table 38: Global Hydration Products Revenue million Forecast, by Types 2020 & 2033
- Table 39: Global Hydration Products Revenue million Forecast, by Country 2020 & 2033
- Table 40: China Hydration Products Revenue (million) Forecast, by Application 2020 & 2033
- Table 41: India Hydration Products Revenue (million) Forecast, by Application 2020 & 2033
- Table 42: Japan Hydration Products Revenue (million) Forecast, by Application 2020 & 2033
- Table 43: South Korea Hydration Products Revenue (million) Forecast, by Application 2020 & 2033
- Table 44: ASEAN Hydration Products Revenue (million) Forecast, by Application 2020 & 2033
- Table 45: Oceania Hydration Products Revenue (million) Forecast, by Application 2020 & 2033
- Table 46: Rest of Asia Pacific Hydration Products Revenue (million) Forecast, by Application 2020 & 2033
Frequently Asked Questions
1. What is the projected Compound Annual Growth Rate (CAGR) of the Hydration Products?
The projected CAGR is approximately 6.1%.
2. Which companies are prominent players in the Hydration Products?
Key companies in the market include CamelBak, GEIGERRIG, HydraPak, Osprey.
3. What are the main segments of the Hydration Products?
The market segments include Application, Types.
4. Can you provide details about the market size?
The market size is estimated to be USD 801.9 million as of 2022.
5. What are some drivers contributing to market growth?
N/A
6. What are the notable trends driving market growth?
N/A
7. Are there any restraints impacting market growth?
N/A
8. Can you provide examples of recent developments in the market?
N/A
9. What pricing options are available for accessing the report?
Pricing options include single-user, multi-user, and enterprise licenses priced at USD 2900.00, USD 4350.00, and USD 5800.00 respectively.
10. Is the market size provided in terms of value or volume?
The market size is provided in terms of value, measured in million.
11. Are there any specific market keywords associated with the report?
Yes, the market keyword associated with the report is "Hydration Products," which aids in identifying and referencing the specific market segment covered.
12. How do I determine which pricing option suits my needs best?
The pricing options vary based on user requirements and access needs. Individual users may opt for single-user licenses, while businesses requiring broader access may choose multi-user or enterprise licenses for cost-effective access to the report.
13. Are there any additional resources or data provided in the Hydration Products report?
While the report offers comprehensive insights, it's advisable to review the specific contents or supplementary materials provided to ascertain if additional resources or data are available.
14. How can I stay updated on further developments or reports in the Hydration Products?
To stay informed about further developments, trends, and reports in the Hydration Products, consider subscribing to industry newsletters, following relevant companies and organizations, or regularly checking reputable industry news sources and publications.
Methodology
Step 1 - Identification of Relevant Samples Size from Population Database


Step 2 - Approaches for Defining Global Market Size (Value, Volume* & Price*)

Note*: In applicable scenarios
Step 3 - Data Sources
Primary Research
- Web Analytics
- Survey Reports
- Research Institute
- Latest Research Reports
- Opinion Leaders
Secondary Research
- Annual Reports
- White Paper
- Latest Press Release
- Industry Association
- Paid Database
- Investor Presentations

Step 4 - Data Triangulation
Involves using different sources of information in order to increase the validity of a study
These sources are likely to be stakeholders in a program - participants, other researchers, program staff, other community members, and so on.
Then we put all data in single framework & apply various statistical tools to find out the dynamic on the market.
During the analysis stage, feedback from the stakeholder groups would be compared to determine areas of agreement as well as areas of divergence