

Key Insights
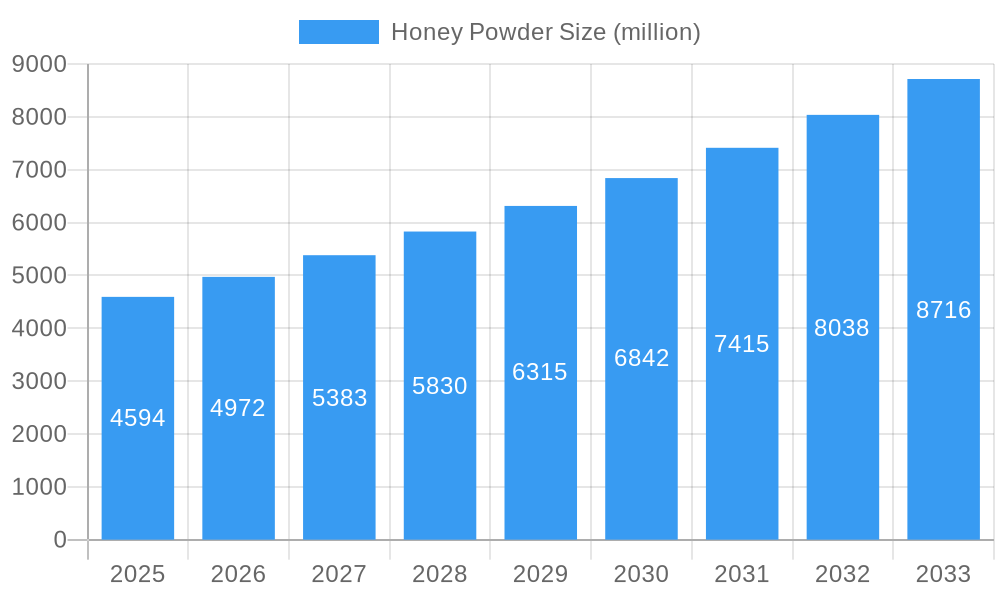
The global honey powder market, estimated at 323.7 million in 2025, is poised for significant expansion, projected to achieve a compound annual growth rate (CAGR) of 4.7% from 2025 to 2033. This growth trajectory is underpinned by rising consumer preference for convenient, shelf-stable, and versatile natural sweeteners. Honey powder's extended shelf life over liquid honey makes it an attractive ingredient for food manufacturers and consumers. The increasing demand for natural and healthy food options further fuels market expansion. Moreover, its widespread application in food and beverages, including baked goods, confectionery, and drinks, creates substantial market opportunities. The growing segment of health-conscious consumers actively seeking natural alternatives to refined sugars represents another key growth driver. Leading companies such as Cargill, ADM, Nestle, and Ingredion are actively pursuing product innovation and market expansion, contributing to the sector's dynamism.
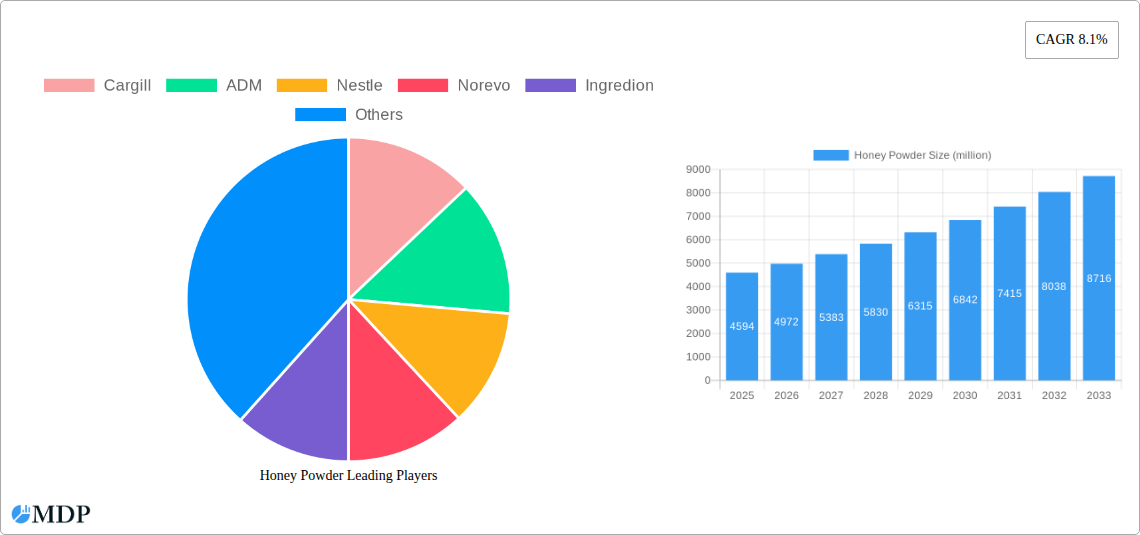
Honey Powder Market Size (In Million)
Despite this positive outlook, the honey powder market encounters certain challenges. Volatility in honey production, influenced by climate change and bee health, can affect raw material availability and pricing, potentially impacting market growth. Competition from alternative natural and artificial sweeteners may also present a restraint. Nonetheless, the market's overall trajectory remains favorable, driven by the increasing adoption of natural sweeteners and ongoing innovation in the food and beverage industry. Potential market segmentation by product type (e.g., raw vs. processed honey powder), application (e.g., food, beverages, dietary supplements), and geography is vital for stakeholders to identify and capitalize on specific growth avenues within this evolving market.
Honey Powder Company Market Share
Honey Powder Market Report: A Comprehensive Analysis (2019-2033)
This in-depth report provides a comprehensive analysis of the global honey powder market, projecting a market value exceeding $XX million by 2033. The study covers the period from 2019 to 2033, with a base year of 2025 and a forecast period from 2025 to 2033. This report is invaluable for industry stakeholders, including manufacturers, investors, and regulatory bodies, offering actionable insights to navigate the dynamic landscape of this burgeoning market. Key players analyzed include Cargill, ADM, Nestlé, Norevo, Ingredion, Tate & Lyle, Agrana Group, Avebe, Nowamyl, Woodland Foods, and Augason Farms.
Honey Powder Market Dynamics & Concentration
The global honey powder market exhibits a moderately concentrated structure, with a few major players holding significant market share. The market share of the top five companies in 2024 is estimated at xx%. Innovation is a key driver, with companies continuously developing new processing techniques to enhance product quality and expand applications. Regulatory frameworks, particularly those concerning food safety and labeling, significantly influence market dynamics. Product substitutes, such as other sweeteners and flavorings, pose a competitive challenge. End-user trends, particularly the growing demand for convenient and healthy food products, are fueling market growth. Furthermore, M&A activities within the industry are expected to increase, potentially leading to further consolidation.
- Market Concentration: Top 5 players hold approximately xx% market share (2024).
- Innovation Drivers: Development of improved processing techniques, functional honey powders.
- Regulatory Frameworks: Food safety standards, labeling regulations impact product development and market access.
- Product Substitutes: Artificial sweeteners, other natural sweeteners pose competition.
- End-User Trends: Growing demand for convenient and healthy food and beverages.
- M&A Activity: xx major mergers and acquisitions recorded between 2019 and 2024.
Honey Powder Industry Trends & Analysis
The honey powder market is experiencing robust growth, driven by a compound annual growth rate (CAGR) of xx% during the forecast period (2025-2033). This growth is primarily fueled by increasing consumer demand for natural and convenient sweeteners, particularly in the food and beverage industries. Technological advancements, such as spray drying and freeze drying techniques, are improving honey powder quality and yield. Changing consumer preferences, including a growing awareness of the health benefits of honey, are further boosting market demand. The competitive landscape is characterized by intense rivalry amongst established players and emerging companies, leading to continuous product innovation and pricing pressures. Market penetration in key regions is expected to increase significantly in the coming years, driven by rising disposable incomes and changing dietary habits.
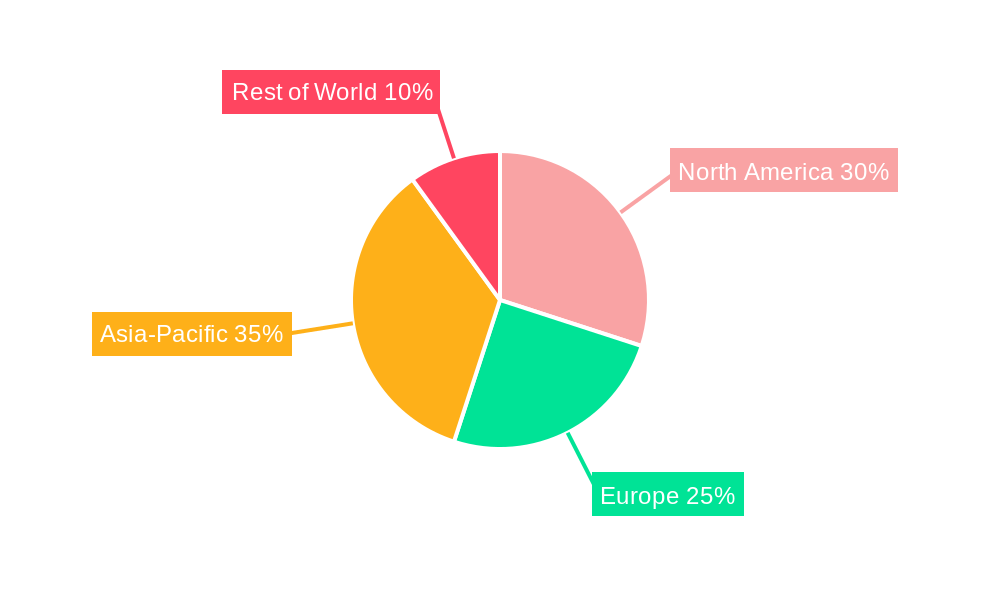
Leading Markets & Segments in Honey Powder
The North American region currently dominates the honey powder market, driven primarily by high per capita consumption of honey and a well-established food processing industry. This dominance is underpinned by factors such as strong economic growth, well-developed infrastructure, and favorable consumer preferences towards natural food products. The European market is also a significant contributor, showing substantial growth potential due to increasing health consciousness and the rising demand for honey-based functional food and beverage products.
- Key Drivers for North American Dominance:
- High per capita consumption of honey.
- Advanced food processing infrastructure.
- Strong economic growth and disposable incomes.
- Favorable regulatory environment.
- Key Drivers for European Market Growth:
- Growing health consciousness and preference for natural sweeteners.
- Increasing demand for functional foods and beverages.
- Expanding food and beverage industry.
Honey Powder Product Developments
Recent product innovations focus on enhancing the functional properties of honey powder, such as improving its solubility, stability, and shelf life. New applications are constantly being explored, expanding its use beyond traditional food and beverage applications into areas such as pharmaceuticals and cosmetics. Competitive advantages are being established through proprietary processing technologies, resulting in superior product quality and cost-effectiveness. Key technological trends include the development of nano-encapsulation techniques to enhance the bioavailability of honey's bioactive compounds and the exploration of sustainable processing methods to minimize environmental impact.
Key Drivers of Honey Powder Growth
The honey powder market's growth is driven by several factors, including increasing consumer demand for convenient, natural sweeteners in food and beverages. Technological advancements enabling efficient and cost-effective production of high-quality honey powder further accelerate market expansion. Favorable government regulations supporting the use of natural ingredients in food products also contribute significantly. Furthermore, growing health consciousness among consumers and the recognition of honey's functional benefits, such as its antioxidant and antimicrobial properties, fuel market demand.
Challenges in the Honey Powder Market
Significant challenges impacting the honey powder market include fluctuations in honey prices due to climate change and bee colony health issues. Supply chain disruptions can affect production volumes and negatively impact market stability. Intense competition among existing players necessitates continuous innovation and cost optimization to maintain market share. Strict regulatory requirements regarding food safety and labeling increase production costs and compliance burdens. These factors together create complex challenges for market players, limiting profitability and potentially slowing growth.
Emerging Opportunities in Honey Powder
The honey powder market presents significant opportunities for growth. Technological advancements in processing and preservation methods can improve product quality and shelf life, expanding market access. Strategic partnerships between honey producers and food manufacturers can lead to the development of innovative products and applications. Expanding into new geographical markets with untapped potential can further fuel market growth. Finally, exploring new applications of honey powder in specialized areas like pharmaceuticals and cosmetics can offer additional revenue streams.
Leading Players in the Honey Powder Sector
- Cargill
- ADM
- Nestlé
- Norevo
- Ingredion
- Tate & Lyle
- Agrana Group
- Avebe
- Nowamyl
- Woodland Foods
- Augason Farms
Key Milestones in Honey Powder Industry
- 2020: Introduction of a new spray-drying technology by a major player resulting in improved honey powder quality.
- 2022: Significant investment in honey powder production capacity by a leading manufacturer.
- 2023: Launch of a new line of honey powder-based functional food products by a multinational company.
- 2024: Several key mergers and acquisitions within the honey processing industry further consolidate the market.
Strategic Outlook for Honey Powder Market
The honey powder market is poised for substantial growth in the coming years. Continued innovation in processing techniques, coupled with an expanding range of applications and growing consumer demand for natural sweeteners, will drive market expansion. Strategic alliances and mergers & acquisitions will play a significant role in shaping the competitive landscape. By focusing on product differentiation, sustainable practices, and market diversification, companies can maximize their growth potential within this dynamic market.
Honey Powder Segmentation
-
1. Application
- 1.1. Cakes
- 1.2. Biscuits
- 1.3. Dessert
- 1.4. Dairy Products
- 1.5. Others
-
2. Type
- 2.1. Granulated Honey
- 2.2. Powdered Honey
Honey Powder Segmentation By Geography
-
1. North America
- 1.1. United States
- 1.2. Canada
- 1.3. Mexico
-
2. South America
- 2.1. Brazil
- 2.2. Argentina
- 2.3. Rest of South America
-
3. Europe
- 3.1. United Kingdom
- 3.2. Germany
- 3.3. France
- 3.4. Italy
- 3.5. Spain
- 3.6. Russia
- 3.7. Benelux
- 3.8. Nordics
- 3.9. Rest of Europe
-
4. Middle East & Africa
- 4.1. Turkey
- 4.2. Israel
- 4.3. GCC
- 4.4. North Africa
- 4.5. South Africa
- 4.6. Rest of Middle East & Africa
-
5. Asia Pacific
- 5.1. China
- 5.2. India
- 5.3. Japan
- 5.4. South Korea
- 5.5. ASEAN
- 5.6. Oceania
- 5.7. Rest of Asia Pacific
Honey Powder Regional Market Share
Geographic Coverage of Honey Powder
Honey Powder REPORT HIGHLIGHTS
| Aspects | Details |
|---|---|
| Study Period | 2020-2034 |
| Base Year | 2025 |
| Estimated Year | 2026 |
| Forecast Period | 2026-2034 |
| Historical Period | 2020-2025 |
| Growth Rate | CAGR of 4.7% from 2020-2034 |
| Segmentation |
|
Table of Contents
- 1. Introduction
- 1.1. Research Scope
- 1.2. Market Segmentation
- 1.3. Research Methodology
- 1.4. Definitions and Assumptions
- 2. Executive Summary
- 2.1. Introduction
- 3. Market Dynamics
- 3.1. Introduction
- 3.2. Market Drivers
- 3.3. Market Restrains
- 3.4. Market Trends
- 4. Market Factor Analysis
- 4.1. Porters Five Forces
- 4.2. Supply/Value Chain
- 4.3. PESTEL analysis
- 4.4. Market Entropy
- 4.5. Patent/Trademark Analysis
- 5. Global Honey Powder Analysis, Insights and Forecast, 2020-2032
- 5.1. Market Analysis, Insights and Forecast - by Application
- 5.1.1. Cakes
- 5.1.2. Biscuits
- 5.1.3. Dessert
- 5.1.4. Dairy Products
- 5.1.5. Others
- 5.2. Market Analysis, Insights and Forecast - by Type
- 5.2.1. Granulated Honey
- 5.2.2. Powdered Honey
- 5.3. Market Analysis, Insights and Forecast - by Region
- 5.3.1. North America
- 5.3.2. South America
- 5.3.3. Europe
- 5.3.4. Middle East & Africa
- 5.3.5. Asia Pacific
- 5.1. Market Analysis, Insights and Forecast - by Application
- 6. North America Honey Powder Analysis, Insights and Forecast, 2020-2032
- 6.1. Market Analysis, Insights and Forecast - by Application
- 6.1.1. Cakes
- 6.1.2. Biscuits
- 6.1.3. Dessert
- 6.1.4. Dairy Products
- 6.1.5. Others
- 6.2. Market Analysis, Insights and Forecast - by Type
- 6.2.1. Granulated Honey
- 6.2.2. Powdered Honey
- 6.1. Market Analysis, Insights and Forecast - by Application
- 7. South America Honey Powder Analysis, Insights and Forecast, 2020-2032
- 7.1. Market Analysis, Insights and Forecast - by Application
- 7.1.1. Cakes
- 7.1.2. Biscuits
- 7.1.3. Dessert
- 7.1.4. Dairy Products
- 7.1.5. Others
- 7.2. Market Analysis, Insights and Forecast - by Type
- 7.2.1. Granulated Honey
- 7.2.2. Powdered Honey
- 7.1. Market Analysis, Insights and Forecast - by Application
- 8. Europe Honey Powder Analysis, Insights and Forecast, 2020-2032
- 8.1. Market Analysis, Insights and Forecast - by Application
- 8.1.1. Cakes
- 8.1.2. Biscuits
- 8.1.3. Dessert
- 8.1.4. Dairy Products
- 8.1.5. Others
- 8.2. Market Analysis, Insights and Forecast - by Type
- 8.2.1. Granulated Honey
- 8.2.2. Powdered Honey
- 8.1. Market Analysis, Insights and Forecast - by Application
- 9. Middle East & Africa Honey Powder Analysis, Insights and Forecast, 2020-2032
- 9.1. Market Analysis, Insights and Forecast - by Application
- 9.1.1. Cakes
- 9.1.2. Biscuits
- 9.1.3. Dessert
- 9.1.4. Dairy Products
- 9.1.5. Others
- 9.2. Market Analysis, Insights and Forecast - by Type
- 9.2.1. Granulated Honey
- 9.2.2. Powdered Honey
- 9.1. Market Analysis, Insights and Forecast - by Application
- 10. Asia Pacific Honey Powder Analysis, Insights and Forecast, 2020-2032
- 10.1. Market Analysis, Insights and Forecast - by Application
- 10.1.1. Cakes
- 10.1.2. Biscuits
- 10.1.3. Dessert
- 10.1.4. Dairy Products
- 10.1.5. Others
- 10.2. Market Analysis, Insights and Forecast - by Type
- 10.2.1. Granulated Honey
- 10.2.2. Powdered Honey
- 10.1. Market Analysis, Insights and Forecast - by Application
- 11. Competitive Analysis
- 11.1. Global Market Share Analysis 2025
- 11.2. Company Profiles
- 11.2.1 Cargill
- 11.2.1.1. Overview
- 11.2.1.2. Products
- 11.2.1.3. SWOT Analysis
- 11.2.1.4. Recent Developments
- 11.2.1.5. Financials (Based on Availability)
- 11.2.2 ADM
- 11.2.2.1. Overview
- 11.2.2.2. Products
- 11.2.2.3. SWOT Analysis
- 11.2.2.4. Recent Developments
- 11.2.2.5. Financials (Based on Availability)
- 11.2.3 Nestle
- 11.2.3.1. Overview
- 11.2.3.2. Products
- 11.2.3.3. SWOT Analysis
- 11.2.3.4. Recent Developments
- 11.2.3.5. Financials (Based on Availability)
- 11.2.4 Norevo
- 11.2.4.1. Overview
- 11.2.4.2. Products
- 11.2.4.3. SWOT Analysis
- 11.2.4.4. Recent Developments
- 11.2.4.5. Financials (Based on Availability)
- 11.2.5 Ingredion
- 11.2.5.1. Overview
- 11.2.5.2. Products
- 11.2.5.3. SWOT Analysis
- 11.2.5.4. Recent Developments
- 11.2.5.5. Financials (Based on Availability)
- 11.2.6 Tate & Lyle
- 11.2.6.1. Overview
- 11.2.6.2. Products
- 11.2.6.3. SWOT Analysis
- 11.2.6.4. Recent Developments
- 11.2.6.5. Financials (Based on Availability)
- 11.2.7 Agrana Group
- 11.2.7.1. Overview
- 11.2.7.2. Products
- 11.2.7.3. SWOT Analysis
- 11.2.7.4. Recent Developments
- 11.2.7.5. Financials (Based on Availability)
- 11.2.8 Avebe
- 11.2.8.1. Overview
- 11.2.8.2. Products
- 11.2.8.3. SWOT Analysis
- 11.2.8.4. Recent Developments
- 11.2.8.5. Financials (Based on Availability)
- 11.2.9 Nowamyl
- 11.2.9.1. Overview
- 11.2.9.2. Products
- 11.2.9.3. SWOT Analysis
- 11.2.9.4. Recent Developments
- 11.2.9.5. Financials (Based on Availability)
- 11.2.10 Woodland Foods
- 11.2.10.1. Overview
- 11.2.10.2. Products
- 11.2.10.3. SWOT Analysis
- 11.2.10.4. Recent Developments
- 11.2.10.5. Financials (Based on Availability)
- 11.2.11 Augason Farms
- 11.2.11.1. Overview
- 11.2.11.2. Products
- 11.2.11.3. SWOT Analysis
- 11.2.11.4. Recent Developments
- 11.2.11.5. Financials (Based on Availability)
- 11.2.1 Cargill
List of Figures
- Figure 1: Global Honey Powder Revenue Breakdown (million, %) by Region 2025 & 2033
- Figure 2: Global Honey Powder Volume Breakdown (K, %) by Region 2025 & 2033
- Figure 3: North America Honey Powder Revenue (million), by Application 2025 & 2033
- Figure 4: North America Honey Powder Volume (K), by Application 2025 & 2033
- Figure 5: North America Honey Powder Revenue Share (%), by Application 2025 & 2033
- Figure 6: North America Honey Powder Volume Share (%), by Application 2025 & 2033
- Figure 7: North America Honey Powder Revenue (million), by Type 2025 & 2033
- Figure 8: North America Honey Powder Volume (K), by Type 2025 & 2033
- Figure 9: North America Honey Powder Revenue Share (%), by Type 2025 & 2033
- Figure 10: North America Honey Powder Volume Share (%), by Type 2025 & 2033
- Figure 11: North America Honey Powder Revenue (million), by Country 2025 & 2033
- Figure 12: North America Honey Powder Volume (K), by Country 2025 & 2033
- Figure 13: North America Honey Powder Revenue Share (%), by Country 2025 & 2033
- Figure 14: North America Honey Powder Volume Share (%), by Country 2025 & 2033
- Figure 15: South America Honey Powder Revenue (million), by Application 2025 & 2033
- Figure 16: South America Honey Powder Volume (K), by Application 2025 & 2033
- Figure 17: South America Honey Powder Revenue Share (%), by Application 2025 & 2033
- Figure 18: South America Honey Powder Volume Share (%), by Application 2025 & 2033
- Figure 19: South America Honey Powder Revenue (million), by Type 2025 & 2033
- Figure 20: South America Honey Powder Volume (K), by Type 2025 & 2033
- Figure 21: South America Honey Powder Revenue Share (%), by Type 2025 & 2033
- Figure 22: South America Honey Powder Volume Share (%), by Type 2025 & 2033
- Figure 23: South America Honey Powder Revenue (million), by Country 2025 & 2033
- Figure 24: South America Honey Powder Volume (K), by Country 2025 & 2033
- Figure 25: South America Honey Powder Revenue Share (%), by Country 2025 & 2033
- Figure 26: South America Honey Powder Volume Share (%), by Country 2025 & 2033
- Figure 27: Europe Honey Powder Revenue (million), by Application 2025 & 2033
- Figure 28: Europe Honey Powder Volume (K), by Application 2025 & 2033
- Figure 29: Europe Honey Powder Revenue Share (%), by Application 2025 & 2033
- Figure 30: Europe Honey Powder Volume Share (%), by Application 2025 & 2033
- Figure 31: Europe Honey Powder Revenue (million), by Type 2025 & 2033
- Figure 32: Europe Honey Powder Volume (K), by Type 2025 & 2033
- Figure 33: Europe Honey Powder Revenue Share (%), by Type 2025 & 2033
- Figure 34: Europe Honey Powder Volume Share (%), by Type 2025 & 2033
- Figure 35: Europe Honey Powder Revenue (million), by Country 2025 & 2033
- Figure 36: Europe Honey Powder Volume (K), by Country 2025 & 2033
- Figure 37: Europe Honey Powder Revenue Share (%), by Country 2025 & 2033
- Figure 38: Europe Honey Powder Volume Share (%), by Country 2025 & 2033
- Figure 39: Middle East & Africa Honey Powder Revenue (million), by Application 2025 & 2033
- Figure 40: Middle East & Africa Honey Powder Volume (K), by Application 2025 & 2033
- Figure 41: Middle East & Africa Honey Powder Revenue Share (%), by Application 2025 & 2033
- Figure 42: Middle East & Africa Honey Powder Volume Share (%), by Application 2025 & 2033
- Figure 43: Middle East & Africa Honey Powder Revenue (million), by Type 2025 & 2033
- Figure 44: Middle East & Africa Honey Powder Volume (K), by Type 2025 & 2033
- Figure 45: Middle East & Africa Honey Powder Revenue Share (%), by Type 2025 & 2033
- Figure 46: Middle East & Africa Honey Powder Volume Share (%), by Type 2025 & 2033
- Figure 47: Middle East & Africa Honey Powder Revenue (million), by Country 2025 & 2033
- Figure 48: Middle East & Africa Honey Powder Volume (K), by Country 2025 & 2033
- Figure 49: Middle East & Africa Honey Powder Revenue Share (%), by Country 2025 & 2033
- Figure 50: Middle East & Africa Honey Powder Volume Share (%), by Country 2025 & 2033
- Figure 51: Asia Pacific Honey Powder Revenue (million), by Application 2025 & 2033
- Figure 52: Asia Pacific Honey Powder Volume (K), by Application 2025 & 2033
- Figure 53: Asia Pacific Honey Powder Revenue Share (%), by Application 2025 & 2033
- Figure 54: Asia Pacific Honey Powder Volume Share (%), by Application 2025 & 2033
- Figure 55: Asia Pacific Honey Powder Revenue (million), by Type 2025 & 2033
- Figure 56: Asia Pacific Honey Powder Volume (K), by Type 2025 & 2033
- Figure 57: Asia Pacific Honey Powder Revenue Share (%), by Type 2025 & 2033
- Figure 58: Asia Pacific Honey Powder Volume Share (%), by Type 2025 & 2033
- Figure 59: Asia Pacific Honey Powder Revenue (million), by Country 2025 & 2033
- Figure 60: Asia Pacific Honey Powder Volume (K), by Country 2025 & 2033
- Figure 61: Asia Pacific Honey Powder Revenue Share (%), by Country 2025 & 2033
- Figure 62: Asia Pacific Honey Powder Volume Share (%), by Country 2025 & 2033
List of Tables
- Table 1: Global Honey Powder Revenue million Forecast, by Application 2020 & 2033
- Table 2: Global Honey Powder Volume K Forecast, by Application 2020 & 2033
- Table 3: Global Honey Powder Revenue million Forecast, by Type 2020 & 2033
- Table 4: Global Honey Powder Volume K Forecast, by Type 2020 & 2033
- Table 5: Global Honey Powder Revenue million Forecast, by Region 2020 & 2033
- Table 6: Global Honey Powder Volume K Forecast, by Region 2020 & 2033
- Table 7: Global Honey Powder Revenue million Forecast, by Application 2020 & 2033
- Table 8: Global Honey Powder Volume K Forecast, by Application 2020 & 2033
- Table 9: Global Honey Powder Revenue million Forecast, by Type 2020 & 2033
- Table 10: Global Honey Powder Volume K Forecast, by Type 2020 & 2033
- Table 11: Global Honey Powder Revenue million Forecast, by Country 2020 & 2033
- Table 12: Global Honey Powder Volume K Forecast, by Country 2020 & 2033
- Table 13: United States Honey Powder Revenue (million) Forecast, by Application 2020 & 2033
- Table 14: United States Honey Powder Volume (K) Forecast, by Application 2020 & 2033
- Table 15: Canada Honey Powder Revenue (million) Forecast, by Application 2020 & 2033
- Table 16: Canada Honey Powder Volume (K) Forecast, by Application 2020 & 2033
- Table 17: Mexico Honey Powder Revenue (million) Forecast, by Application 2020 & 2033
- Table 18: Mexico Honey Powder Volume (K) Forecast, by Application 2020 & 2033
- Table 19: Global Honey Powder Revenue million Forecast, by Application 2020 & 2033
- Table 20: Global Honey Powder Volume K Forecast, by Application 2020 & 2033
- Table 21: Global Honey Powder Revenue million Forecast, by Type 2020 & 2033
- Table 22: Global Honey Powder Volume K Forecast, by Type 2020 & 2033
- Table 23: Global Honey Powder Revenue million Forecast, by Country 2020 & 2033
- Table 24: Global Honey Powder Volume K Forecast, by Country 2020 & 2033
- Table 25: Brazil Honey Powder Revenue (million) Forecast, by Application 2020 & 2033
- Table 26: Brazil Honey Powder Volume (K) Forecast, by Application 2020 & 2033
- Table 27: Argentina Honey Powder Revenue (million) Forecast, by Application 2020 & 2033
- Table 28: Argentina Honey Powder Volume (K) Forecast, by Application 2020 & 2033
- Table 29: Rest of South America Honey Powder Revenue (million) Forecast, by Application 2020 & 2033
- Table 30: Rest of South America Honey Powder Volume (K) Forecast, by Application 2020 & 2033
- Table 31: Global Honey Powder Revenue million Forecast, by Application 2020 & 2033
- Table 32: Global Honey Powder Volume K Forecast, by Application 2020 & 2033
- Table 33: Global Honey Powder Revenue million Forecast, by Type 2020 & 2033
- Table 34: Global Honey Powder Volume K Forecast, by Type 2020 & 2033
- Table 35: Global Honey Powder Revenue million Forecast, by Country 2020 & 2033
- Table 36: Global Honey Powder Volume K Forecast, by Country 2020 & 2033
- Table 37: United Kingdom Honey Powder Revenue (million) Forecast, by Application 2020 & 2033
- Table 38: United Kingdom Honey Powder Volume (K) Forecast, by Application 2020 & 2033
- Table 39: Germany Honey Powder Revenue (million) Forecast, by Application 2020 & 2033
- Table 40: Germany Honey Powder Volume (K) Forecast, by Application 2020 & 2033
- Table 41: France Honey Powder Revenue (million) Forecast, by Application 2020 & 2033
- Table 42: France Honey Powder Volume (K) Forecast, by Application 2020 & 2033
- Table 43: Italy Honey Powder Revenue (million) Forecast, by Application 2020 & 2033
- Table 44: Italy Honey Powder Volume (K) Forecast, by Application 2020 & 2033
- Table 45: Spain Honey Powder Revenue (million) Forecast, by Application 2020 & 2033
- Table 46: Spain Honey Powder Volume (K) Forecast, by Application 2020 & 2033
- Table 47: Russia Honey Powder Revenue (million) Forecast, by Application 2020 & 2033
- Table 48: Russia Honey Powder Volume (K) Forecast, by Application 2020 & 2033
- Table 49: Benelux Honey Powder Revenue (million) Forecast, by Application 2020 & 2033
- Table 50: Benelux Honey Powder Volume (K) Forecast, by Application 2020 & 2033
- Table 51: Nordics Honey Powder Revenue (million) Forecast, by Application 2020 & 2033
- Table 52: Nordics Honey Powder Volume (K) Forecast, by Application 2020 & 2033
- Table 53: Rest of Europe Honey Powder Revenue (million) Forecast, by Application 2020 & 2033
- Table 54: Rest of Europe Honey Powder Volume (K) Forecast, by Application 2020 & 2033
- Table 55: Global Honey Powder Revenue million Forecast, by Application 2020 & 2033
- Table 56: Global Honey Powder Volume K Forecast, by Application 2020 & 2033
- Table 57: Global Honey Powder Revenue million Forecast, by Type 2020 & 2033
- Table 58: Global Honey Powder Volume K Forecast, by Type 2020 & 2033
- Table 59: Global Honey Powder Revenue million Forecast, by Country 2020 & 2033
- Table 60: Global Honey Powder Volume K Forecast, by Country 2020 & 2033
- Table 61: Turkey Honey Powder Revenue (million) Forecast, by Application 2020 & 2033
- Table 62: Turkey Honey Powder Volume (K) Forecast, by Application 2020 & 2033
- Table 63: Israel Honey Powder Revenue (million) Forecast, by Application 2020 & 2033
- Table 64: Israel Honey Powder Volume (K) Forecast, by Application 2020 & 2033
- Table 65: GCC Honey Powder Revenue (million) Forecast, by Application 2020 & 2033
- Table 66: GCC Honey Powder Volume (K) Forecast, by Application 2020 & 2033
- Table 67: North Africa Honey Powder Revenue (million) Forecast, by Application 2020 & 2033
- Table 68: North Africa Honey Powder Volume (K) Forecast, by Application 2020 & 2033
- Table 69: South Africa Honey Powder Revenue (million) Forecast, by Application 2020 & 2033
- Table 70: South Africa Honey Powder Volume (K) Forecast, by Application 2020 & 2033
- Table 71: Rest of Middle East & Africa Honey Powder Revenue (million) Forecast, by Application 2020 & 2033
- Table 72: Rest of Middle East & Africa Honey Powder Volume (K) Forecast, by Application 2020 & 2033
- Table 73: Global Honey Powder Revenue million Forecast, by Application 2020 & 2033
- Table 74: Global Honey Powder Volume K Forecast, by Application 2020 & 2033
- Table 75: Global Honey Powder Revenue million Forecast, by Type 2020 & 2033
- Table 76: Global Honey Powder Volume K Forecast, by Type 2020 & 2033
- Table 77: Global Honey Powder Revenue million Forecast, by Country 2020 & 2033
- Table 78: Global Honey Powder Volume K Forecast, by Country 2020 & 2033
- Table 79: China Honey Powder Revenue (million) Forecast, by Application 2020 & 2033
- Table 80: China Honey Powder Volume (K) Forecast, by Application 2020 & 2033
- Table 81: India Honey Powder Revenue (million) Forecast, by Application 2020 & 2033
- Table 82: India Honey Powder Volume (K) Forecast, by Application 2020 & 2033
- Table 83: Japan Honey Powder Revenue (million) Forecast, by Application 2020 & 2033
- Table 84: Japan Honey Powder Volume (K) Forecast, by Application 2020 & 2033
- Table 85: South Korea Honey Powder Revenue (million) Forecast, by Application 2020 & 2033
- Table 86: South Korea Honey Powder Volume (K) Forecast, by Application 2020 & 2033
- Table 87: ASEAN Honey Powder Revenue (million) Forecast, by Application 2020 & 2033
- Table 88: ASEAN Honey Powder Volume (K) Forecast, by Application 2020 & 2033
- Table 89: Oceania Honey Powder Revenue (million) Forecast, by Application 2020 & 2033
- Table 90: Oceania Honey Powder Volume (K) Forecast, by Application 2020 & 2033
- Table 91: Rest of Asia Pacific Honey Powder Revenue (million) Forecast, by Application 2020 & 2033
- Table 92: Rest of Asia Pacific Honey Powder Volume (K) Forecast, by Application 2020 & 2033
Frequently Asked Questions
1. What is the projected Compound Annual Growth Rate (CAGR) of the Honey Powder?
The projected CAGR is approximately 4.7%.
2. Which companies are prominent players in the Honey Powder?
Key companies in the market include Cargill, ADM, Nestle, Norevo, Ingredion, Tate & Lyle, Agrana Group, Avebe, Nowamyl, Woodland Foods, Augason Farms.
3. What are the main segments of the Honey Powder?
The market segments include Application, Type.
4. Can you provide details about the market size?
The market size is estimated to be USD 323.7 million as of 2022.
5. What are some drivers contributing to market growth?
N/A
6. What are the notable trends driving market growth?
N/A
7. Are there any restraints impacting market growth?
N/A
8. Can you provide examples of recent developments in the market?
N/A
9. What pricing options are available for accessing the report?
Pricing options include single-user, multi-user, and enterprise licenses priced at USD 3950.00, USD 5925.00, and USD 7900.00 respectively.
10. Is the market size provided in terms of value or volume?
The market size is provided in terms of value, measured in million and volume, measured in K.
11. Are there any specific market keywords associated with the report?
Yes, the market keyword associated with the report is "Honey Powder," which aids in identifying and referencing the specific market segment covered.
12. How do I determine which pricing option suits my needs best?
The pricing options vary based on user requirements and access needs. Individual users may opt for single-user licenses, while businesses requiring broader access may choose multi-user or enterprise licenses for cost-effective access to the report.
13. Are there any additional resources or data provided in the Honey Powder report?
While the report offers comprehensive insights, it's advisable to review the specific contents or supplementary materials provided to ascertain if additional resources or data are available.
14. How can I stay updated on further developments or reports in the Honey Powder?
To stay informed about further developments, trends, and reports in the Honey Powder, consider subscribing to industry newsletters, following relevant companies and organizations, or regularly checking reputable industry news sources and publications.
Methodology
Step 1 - Identification of Relevant Samples Size from Population Database


Step 2 - Approaches for Defining Global Market Size (Value, Volume* & Price*)

Note*: In applicable scenarios
Step 3 - Data Sources
Primary Research
- Web Analytics
- Survey Reports
- Research Institute
- Latest Research Reports
- Opinion Leaders
Secondary Research
- Annual Reports
- White Paper
- Latest Press Release
- Industry Association
- Paid Database
- Investor Presentations

Step 4 - Data Triangulation
Involves using different sources of information in order to increase the validity of a study
These sources are likely to be stakeholders in a program - participants, other researchers, program staff, other community members, and so on.
Then we put all data in single framework & apply various statistical tools to find out the dynamic on the market.
During the analysis stage, feedback from the stakeholder groups would be compared to determine areas of agreement as well as areas of divergence