

Key Insights
The global Growing Up Milk market is experiencing robust expansion, projected to reach an estimated market size of approximately \$55,000 million by 2025, with a significant Compound Annual Growth Rate (CAGR) of around 7.5% anticipated through 2033. This growth is primarily fueled by increasing parental awareness regarding the crucial role of specialized nutrition for toddlers and young children's cognitive and physical development. Key market drivers include rising disposable incomes in emerging economies, a growing preference for fortified milk formulas that offer essential vitamins and minerals beyond regular milk, and the expanding distribution networks that enhance product accessibility. The market's trajectory also benefits from continuous product innovation, with manufacturers introducing formulations tailored to specific dietary needs, such as lactose-free or organic options, thereby catering to a wider consumer base. The increasing urbanization and associated lifestyle changes, leading to busier parenting schedules, also contribute to the demand for convenient and nutritionally complete growing-up milk solutions.
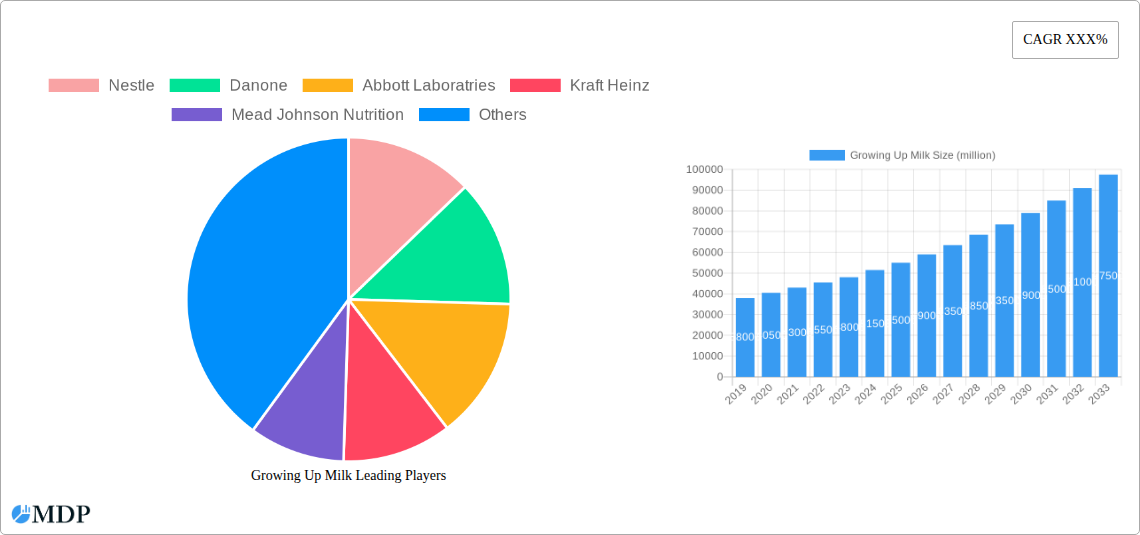
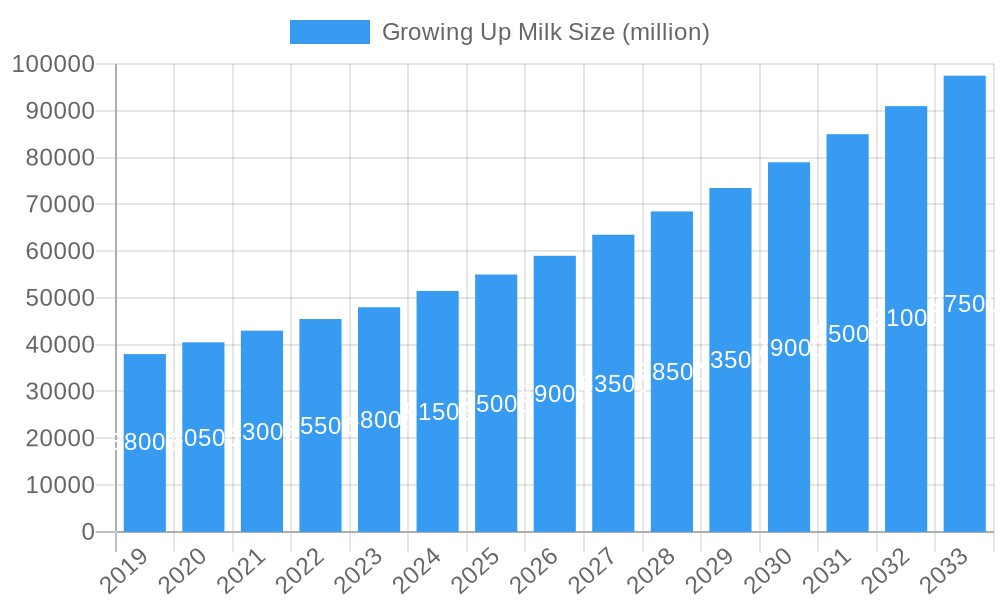
Growing Up Milk Market Size (In Billion)
Further analysis reveals that the market is segmented by application and type. The "Online Stores" segment is poised for substantial growth, mirroring the broader e-commerce trend, offering convenience and wider product selection for parents. Conversely, "Offline Stores" continue to hold a significant share, driven by impulse purchases and the trust parents place in traditional retail environments. In terms of type, both "Plant Based" and "Animal Based" milk formulations are witnessing demand, with plant-based options gaining traction among parents seeking alternatives due to ethical concerns, allergies, or perceived health benefits. Key players like Nestle, Danone, and Abbott Laboratories are actively investing in research and development, strategic partnerships, and aggressive marketing campaigns to capture a larger share of this dynamic and evolving market. Geographically, the Asia Pacific region, particularly China and India, is expected to be a major growth engine due to its large young population and increasing adoption of premium infant nutrition products.
Growing Up Milk Company Market Share
Growing Up Milk Market Research Report: 2019-2033 - Unlocking Global Growth & Innovation
This comprehensive Growing Up Milk market report offers an in-depth analysis of a dynamic and rapidly evolving global sector. Covering the historical period 2019-2024 and projecting through 2033, with a base year of 2025 and an estimated year of 2025, this report is an essential resource for industry stakeholders seeking to understand market dynamics, identify growth opportunities, and formulate winning strategies.
With a projected market size expected to reach hundreds of millions, the growing up milk industry is experiencing significant expansion driven by increasing parental awareness of infant and toddler nutrition, rising disposable incomes, and a growing demand for specialized milk formulations. This report delves into the intricacies of this market, providing actionable insights for manufacturers, suppliers, investors, and policymakers.
Our rigorous research methodology ensures accurate and reliable data, empowering you to make informed business decisions. Explore the competitive landscape, understand consumer preferences, and navigate the regulatory environment to capitalize on the vast potential of the growing up milk market.
Growing Up Milk Market Dynamics & Concentration
The global Growing Up Milk market exhibits a moderate to high concentration, with a few key players holding a significant market share. Major companies like Nestle, Danone, and Abbott Laboratories are at the forefront, continuously investing in research and development to drive innovation. Regulatory frameworks, such as stringent food safety standards and labeling requirements in regions like Europe and North America, play a crucial role in shaping market entry and product development. Product substitutes, including organic milk alternatives and specialized infant formula, present a competitive challenge, requiring manufacturers to differentiate their offerings. End-user trends are increasingly leaning towards convenient, ready-to-drink formats and formulations catering to specific dietary needs, such as lactose-free or plant-based options. Mergers and acquisitions (M&A) activities are also observed as larger companies seek to expand their portfolios and geographical reach. For instance, the past five years have seen an estimated 50 M&A deals within the broader infant nutrition sector, reflecting a strategic consolidation.
Growing Up Milk Industry Trends & Analysis
The Growing Up Milk industry is poised for robust expansion, projected to achieve a Compound Annual Growth Rate (CAGR) of approximately 6.5% during the forecast period. This growth is primarily fueled by a confluence of factors. Increasing parental awareness regarding the critical role of nutrition in early childhood development is a paramount driver. As global disposable incomes rise, particularly in emerging economies, more families are able to invest in premium and specialized growing-up milk products designed to meet the evolving nutritional needs of toddlers and young children. Technological disruptions are also playing a significant role, with advancements in food processing and fortification leading to the development of more sophisticated and bioavailable nutrient profiles. The demand for plant-based growing-up milk, driven by ethical, environmental, and allergy-related concerns, is witnessing a substantial surge, significantly impacting market penetration for these alternatives. Furthermore, innovative packaging solutions that enhance convenience and shelf-life are contributing to market growth. The competitive dynamics are characterized by intense product innovation, strategic marketing campaigns targeting health-conscious parents, and expanding distribution networks, both online and offline. The market penetration of growing-up milk is estimated to be over 70% in developed economies and is rapidly increasing in developing regions. The total addressable market size is projected to reach over $150,000 million by 2033.
Leading Markets & Segments in Growing Up Milk
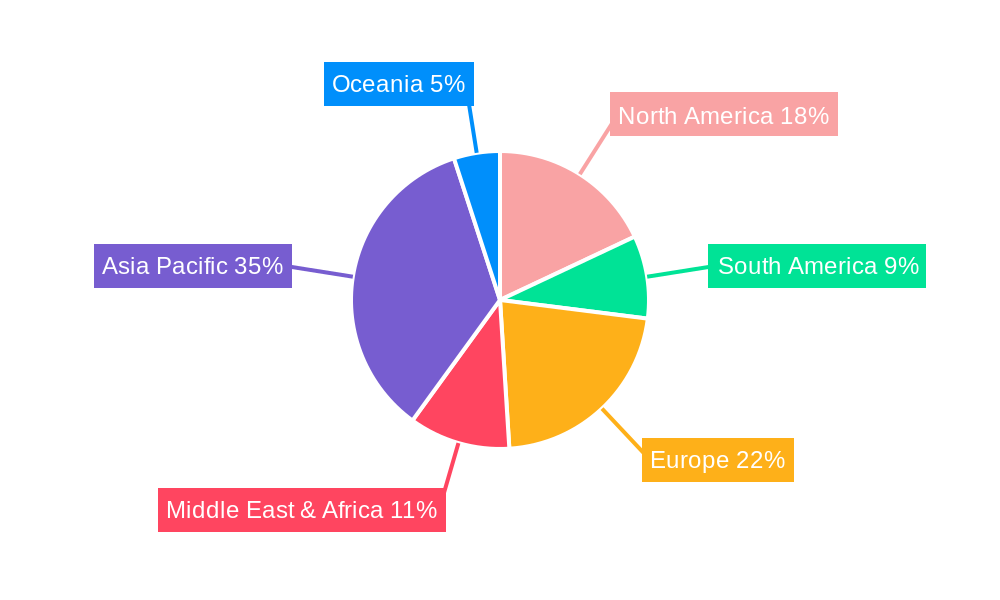
The Asia-Pacific region, particularly China, stands out as the dominant market for growing-up milk, accounting for an estimated 40% of the global market share. This dominance is attributed to a large and growing young population, a burgeoning middle class with increasing purchasing power, and a strong cultural emphasis on providing the best nutrition for children. Within this region, urban centers are primary hubs for consumption due to higher income levels and greater access to modern retail channels.
Application: Offline Stores continue to hold a significant share, estimated at around 75% of total sales, driven by traditional consumer shopping habits and the trust associated with established retail chains. However, Online Stores are rapidly gaining traction, projected to account for over 25% of sales by 2033, fueled by the convenience of e-commerce and the widespread adoption of digital platforms by parents.
In terms of Type, Animal-Based growing-up milk remains the largest segment, representing an estimated 85% of the market. This is due to its long-standing familiarity and perceived comprehensive nutritional profile. Nevertheless, the Plant-Based segment is experiencing exponential growth, driven by rising veganism, lactose intolerance, and concerns about dairy allergies. This segment is projected to capture a substantial 15% market share by 2033.
Key drivers for the dominance of these markets and segments include:
- Economic Policies: Favorable government policies promoting infant nutrition and child welfare in countries like China and India have spurred market growth.
- Infrastructure: Robust retail and e-commerce infrastructure in developed and rapidly developing nations ensures accessibility to growing-up milk products.
- Consumer Preferences: Evolving consumer trends towards health and wellness, coupled with an increasing understanding of specialized nutritional needs, are shaping demand for specific product types and delivery channels.
- Technological Advancements: Innovations in product formulation and distribution technologies are making a wider range of options available and more accessible.
Growing Up Milk Product Developments
Product innovations in the growing-up milk sector are primarily focused on enhancing nutritional value and catering to specific dietary requirements. Key developments include the incorporation of probiotics and prebiotics for gut health, omega-3 fatty acids (DHA/ARA) for cognitive development, and a wider array of vitamins and minerals essential for this age group. The rise of plant-based alternatives, utilizing ingredients like soy, almond, oat, and pea protein, offers a significant competitive advantage for brands addressing vegan lifestyles and dairy sensitivities. Brands are also emphasizing the convenience of ready-to-drink formats and developing formulations with reduced sugar content. These advancements aim to align with evolving parental concerns for optimal child development and well-being.
Key Drivers of Growing Up Milk Growth
The Growing Up Milk market is propelled by several key drivers. Firstly, increasing parental awareness of the crucial role of tailored nutrition during early childhood is a primary catalyst, leading to a higher demand for specialized formulas beyond standard milk. Secondly, the rising global disposable incomes, especially in emerging economies, enable more families to afford premium and fortified growing-up milk products. Thirdly, significant technological advancements in food science and processing allow for the development of formulations with enhanced bioavailability of nutrients and improved digestive properties. Regulatory support in many countries, promoting infant and child health through nutritional guidelines, also plays a supportive role.
Challenges in the Growing Up Milk Market
Despite the promising growth trajectory, the Growing Up Milk market faces several challenges. Stringent regulatory hurdles and evolving food safety standards across different regions can pose significant barriers to market entry and product approvals, increasing compliance costs. Intense competition from established players and the proliferation of substitute products, including fresh milk and other nutritional beverages, can put pressure on pricing and market share. Supply chain complexities, particularly in ensuring product quality and freshness across global distribution networks, present logistical challenges. Furthermore, negative publicity or consumer concerns regarding specific ingredients or product recalls can swiftly impact brand reputation and sales. The estimated impact of these challenges on overall market expansion can be around 10-15% annually.
Emerging Opportunities in Growing Up Milk
Emerging opportunities in the Growing Up Milk market are abundant, driven by innovative product development and evolving consumer demands. The rapidly expanding plant-based segment presents a significant avenue for growth, catering to the increasing number of families adopting vegan or vegetarian lifestyles, or those with dairy allergies. Technological breakthroughs in gut microbiome research are opening doors for the development of probiotics and prebiotics-enhanced formulas, targeting improved digestive health. Strategic partnerships with healthcare professionals, pediatricians, and early childhood nutritionists can build trust and drive product recommendations. Furthermore, expansion into underserved emerging markets with growing middle classes and increasing awareness of infant nutrition offers substantial untapped potential.
Leading Players in the Growing Up Milk Sector
- Nestle
- Danone
- Abbott Laboratories
- Kraft Heinz
- Mead Johnson Nutrition
- Fonterra
- Arla Foods
- FrieslandCampina
- Hain Celestial
- Meiji Holdings
- Bellamy's Australia
- Topfer
- HiPP
- Holle
- Westland Milk Products
- H&H Group
- Hero Group
- Perrigo
- Yili
- Mengniu
Key Milestones in Growing Up Milk Industry
- 2019: Increased consumer interest in organic and non-GMO growing-up milk formulations.
- 2020: Significant rise in online sales channels for infant nutrition products due to global events.
- 2021: Growing emphasis on the inclusion of DHA and ARA for cognitive development in product formulations.
- 2022: Expansion of plant-based growing-up milk options with a wider variety of protein sources.
- 2023: Increased focus on sustainable sourcing and packaging in the infant nutrition industry.
- 2024: Introduction of growing-up milk formulations tailored for specific dietary needs and allergies.
- 2025 (Projected): Enhanced integration of probiotics and prebiotics for gut health support.
- 2026-2030 (Projected): Continued innovation in personalized nutrition and functional ingredients.
- 2031-2033 (Projected): Greater adoption of smart packaging and supply chain technologies.
Strategic Outlook for Growing Up Milk Market
The strategic outlook for the Growing Up Milk market is highly positive, characterized by sustained growth and innovation. Key growth accelerators include the continued rise of health-conscious parents seeking specialized nutritional solutions, the expanding demand for plant-based alternatives, and the increasing adoption of e-commerce for convenient purchasing. Companies that focus on product differentiation through science-backed formulations, address specific nutritional needs, and invest in sustainable practices will be well-positioned for success. Strategic market expansion into developing economies, coupled with robust digital marketing and direct-to-consumer strategies, will be crucial for capturing market share. The future of the growing-up milk market lies in its ability to adapt to evolving consumer preferences and leverage technological advancements to deliver superior nutritional outcomes for young children.
Growing Up Milk Segmentation
-
1. Application
- 1.1. Online Stores
- 1.2. Offine Stores
-
2. Type
- 2.1. Plant Based
- 2.2. Animal Based
Growing Up Milk Segmentation By Geography
-
1. North America
- 1.1. United States
- 1.2. Canada
- 1.3. Mexico
-
2. South America
- 2.1. Brazil
- 2.2. Argentina
- 2.3. Rest of South America
-
3. Europe
- 3.1. United Kingdom
- 3.2. Germany
- 3.3. France
- 3.4. Italy
- 3.5. Spain
- 3.6. Russia
- 3.7. Benelux
- 3.8. Nordics
- 3.9. Rest of Europe
-
4. Middle East & Africa
- 4.1. Turkey
- 4.2. Israel
- 4.3. GCC
- 4.4. North Africa
- 4.5. South Africa
- 4.6. Rest of Middle East & Africa
-
5. Asia Pacific
- 5.1. China
- 5.2. India
- 5.3. Japan
- 5.4. South Korea
- 5.5. ASEAN
- 5.6. Oceania
- 5.7. Rest of Asia Pacific
Growing Up Milk Regional Market Share
Geographic Coverage of Growing Up Milk
Growing Up Milk REPORT HIGHLIGHTS
| Aspects | Details |
|---|---|
| Study Period | 2020-2034 |
| Base Year | 2025 |
| Estimated Year | 2026 |
| Forecast Period | 2026-2034 |
| Historical Period | 2020-2025 |
| Growth Rate | CAGR of 6.1% from 2020-2034 |
| Segmentation |
|
Table of Contents
- 1. Introduction
- 1.1. Research Scope
- 1.2. Market Segmentation
- 1.3. Research Methodology
- 1.4. Definitions and Assumptions
- 2. Executive Summary
- 2.1. Introduction
- 3. Market Dynamics
- 3.1. Introduction
- 3.2. Market Drivers
- 3.3. Market Restrains
- 3.4. Market Trends
- 4. Market Factor Analysis
- 4.1. Porters Five Forces
- 4.2. Supply/Value Chain
- 4.3. PESTEL analysis
- 4.4. Market Entropy
- 4.5. Patent/Trademark Analysis
- 5. Global Growing Up Milk Analysis, Insights and Forecast, 2020-2032
- 5.1. Market Analysis, Insights and Forecast - by Application
- 5.1.1. Online Stores
- 5.1.2. Offine Stores
- 5.2. Market Analysis, Insights and Forecast - by Type
- 5.2.1. Plant Based
- 5.2.2. Animal Based
- 5.3. Market Analysis, Insights and Forecast - by Region
- 5.3.1. North America
- 5.3.2. South America
- 5.3.3. Europe
- 5.3.4. Middle East & Africa
- 5.3.5. Asia Pacific
- 5.1. Market Analysis, Insights and Forecast - by Application
- 6. North America Growing Up Milk Analysis, Insights and Forecast, 2020-2032
- 6.1. Market Analysis, Insights and Forecast - by Application
- 6.1.1. Online Stores
- 6.1.2. Offine Stores
- 6.2. Market Analysis, Insights and Forecast - by Type
- 6.2.1. Plant Based
- 6.2.2. Animal Based
- 6.1. Market Analysis, Insights and Forecast - by Application
- 7. South America Growing Up Milk Analysis, Insights and Forecast, 2020-2032
- 7.1. Market Analysis, Insights and Forecast - by Application
- 7.1.1. Online Stores
- 7.1.2. Offine Stores
- 7.2. Market Analysis, Insights and Forecast - by Type
- 7.2.1. Plant Based
- 7.2.2. Animal Based
- 7.1. Market Analysis, Insights and Forecast - by Application
- 8. Europe Growing Up Milk Analysis, Insights and Forecast, 2020-2032
- 8.1. Market Analysis, Insights and Forecast - by Application
- 8.1.1. Online Stores
- 8.1.2. Offine Stores
- 8.2. Market Analysis, Insights and Forecast - by Type
- 8.2.1. Plant Based
- 8.2.2. Animal Based
- 8.1. Market Analysis, Insights and Forecast - by Application
- 9. Middle East & Africa Growing Up Milk Analysis, Insights and Forecast, 2020-2032
- 9.1. Market Analysis, Insights and Forecast - by Application
- 9.1.1. Online Stores
- 9.1.2. Offine Stores
- 9.2. Market Analysis, Insights and Forecast - by Type
- 9.2.1. Plant Based
- 9.2.2. Animal Based
- 9.1. Market Analysis, Insights and Forecast - by Application
- 10. Asia Pacific Growing Up Milk Analysis, Insights and Forecast, 2020-2032
- 10.1. Market Analysis, Insights and Forecast - by Application
- 10.1.1. Online Stores
- 10.1.2. Offine Stores
- 10.2. Market Analysis, Insights and Forecast - by Type
- 10.2.1. Plant Based
- 10.2.2. Animal Based
- 10.1. Market Analysis, Insights and Forecast - by Application
- 11. Competitive Analysis
- 11.1. Global Market Share Analysis 2025
- 11.2. Company Profiles
- 11.2.1 Nestle
- 11.2.1.1. Overview
- 11.2.1.2. Products
- 11.2.1.3. SWOT Analysis
- 11.2.1.4. Recent Developments
- 11.2.1.5. Financials (Based on Availability)
- 11.2.2 Danone
- 11.2.2.1. Overview
- 11.2.2.2. Products
- 11.2.2.3. SWOT Analysis
- 11.2.2.4. Recent Developments
- 11.2.2.5. Financials (Based on Availability)
- 11.2.3 Abbott Laboratries
- 11.2.3.1. Overview
- 11.2.3.2. Products
- 11.2.3.3. SWOT Analysis
- 11.2.3.4. Recent Developments
- 11.2.3.5. Financials (Based on Availability)
- 11.2.4 Kraft Heinz
- 11.2.4.1. Overview
- 11.2.4.2. Products
- 11.2.4.3. SWOT Analysis
- 11.2.4.4. Recent Developments
- 11.2.4.5. Financials (Based on Availability)
- 11.2.5 Mead Johnson Nutrition
- 11.2.5.1. Overview
- 11.2.5.2. Products
- 11.2.5.3. SWOT Analysis
- 11.2.5.4. Recent Developments
- 11.2.5.5. Financials (Based on Availability)
- 11.2.6 Fonterra
- 11.2.6.1. Overview
- 11.2.6.2. Products
- 11.2.6.3. SWOT Analysis
- 11.2.6.4. Recent Developments
- 11.2.6.5. Financials (Based on Availability)
- 11.2.7 Arla Foods
- 11.2.7.1. Overview
- 11.2.7.2. Products
- 11.2.7.3. SWOT Analysis
- 11.2.7.4. Recent Developments
- 11.2.7.5. Financials (Based on Availability)
- 11.2.8 FrieslandCampina
- 11.2.8.1. Overview
- 11.2.8.2. Products
- 11.2.8.3. SWOT Analysis
- 11.2.8.4. Recent Developments
- 11.2.8.5. Financials (Based on Availability)
- 11.2.9 Hain Celestial
- 11.2.9.1. Overview
- 11.2.9.2. Products
- 11.2.9.3. SWOT Analysis
- 11.2.9.4. Recent Developments
- 11.2.9.5. Financials (Based on Availability)
- 11.2.10 Meiji Holdings
- 11.2.10.1. Overview
- 11.2.10.2. Products
- 11.2.10.3. SWOT Analysis
- 11.2.10.4. Recent Developments
- 11.2.10.5. Financials (Based on Availability)
- 11.2.11 Bellamy's Australia
- 11.2.11.1. Overview
- 11.2.11.2. Products
- 11.2.11.3. SWOT Analysis
- 11.2.11.4. Recent Developments
- 11.2.11.5. Financials (Based on Availability)
- 11.2.12 Topfer
- 11.2.12.1. Overview
- 11.2.12.2. Products
- 11.2.12.3. SWOT Analysis
- 11.2.12.4. Recent Developments
- 11.2.12.5. Financials (Based on Availability)
- 11.2.13 HiPP
- 11.2.13.1. Overview
- 11.2.13.2. Products
- 11.2.13.3. SWOT Analysis
- 11.2.13.4. Recent Developments
- 11.2.13.5. Financials (Based on Availability)
- 11.2.14 Holle
- 11.2.14.1. Overview
- 11.2.14.2. Products
- 11.2.14.3. SWOT Analysis
- 11.2.14.4. Recent Developments
- 11.2.14.5. Financials (Based on Availability)
- 11.2.15 Westland Milk Products
- 11.2.15.1. Overview
- 11.2.15.2. Products
- 11.2.15.3. SWOT Analysis
- 11.2.15.4. Recent Developments
- 11.2.15.5. Financials (Based on Availability)
- 11.2.16 H&H Group
- 11.2.16.1. Overview
- 11.2.16.2. Products
- 11.2.16.3. SWOT Analysis
- 11.2.16.4. Recent Developments
- 11.2.16.5. Financials (Based on Availability)
- 11.2.17 Hero Group
- 11.2.17.1. Overview
- 11.2.17.2. Products
- 11.2.17.3. SWOT Analysis
- 11.2.17.4. Recent Developments
- 11.2.17.5. Financials (Based on Availability)
- 11.2.18 Perrigo
- 11.2.18.1. Overview
- 11.2.18.2. Products
- 11.2.18.3. SWOT Analysis
- 11.2.18.4. Recent Developments
- 11.2.18.5. Financials (Based on Availability)
- 11.2.19 Yili
- 11.2.19.1. Overview
- 11.2.19.2. Products
- 11.2.19.3. SWOT Analysis
- 11.2.19.4. Recent Developments
- 11.2.19.5. Financials (Based on Availability)
- 11.2.20 Mengniu
- 11.2.20.1. Overview
- 11.2.20.2. Products
- 11.2.20.3. SWOT Analysis
- 11.2.20.4. Recent Developments
- 11.2.20.5. Financials (Based on Availability)
- 11.2.1 Nestle
List of Figures
- Figure 1: Global Growing Up Milk Revenue Breakdown (undefined, %) by Region 2025 & 2033
- Figure 2: Global Growing Up Milk Volume Breakdown (K, %) by Region 2025 & 2033
- Figure 3: North America Growing Up Milk Revenue (undefined), by Application 2025 & 2033
- Figure 4: North America Growing Up Milk Volume (K), by Application 2025 & 2033
- Figure 5: North America Growing Up Milk Revenue Share (%), by Application 2025 & 2033
- Figure 6: North America Growing Up Milk Volume Share (%), by Application 2025 & 2033
- Figure 7: North America Growing Up Milk Revenue (undefined), by Type 2025 & 2033
- Figure 8: North America Growing Up Milk Volume (K), by Type 2025 & 2033
- Figure 9: North America Growing Up Milk Revenue Share (%), by Type 2025 & 2033
- Figure 10: North America Growing Up Milk Volume Share (%), by Type 2025 & 2033
- Figure 11: North America Growing Up Milk Revenue (undefined), by Country 2025 & 2033
- Figure 12: North America Growing Up Milk Volume (K), by Country 2025 & 2033
- Figure 13: North America Growing Up Milk Revenue Share (%), by Country 2025 & 2033
- Figure 14: North America Growing Up Milk Volume Share (%), by Country 2025 & 2033
- Figure 15: South America Growing Up Milk Revenue (undefined), by Application 2025 & 2033
- Figure 16: South America Growing Up Milk Volume (K), by Application 2025 & 2033
- Figure 17: South America Growing Up Milk Revenue Share (%), by Application 2025 & 2033
- Figure 18: South America Growing Up Milk Volume Share (%), by Application 2025 & 2033
- Figure 19: South America Growing Up Milk Revenue (undefined), by Type 2025 & 2033
- Figure 20: South America Growing Up Milk Volume (K), by Type 2025 & 2033
- Figure 21: South America Growing Up Milk Revenue Share (%), by Type 2025 & 2033
- Figure 22: South America Growing Up Milk Volume Share (%), by Type 2025 & 2033
- Figure 23: South America Growing Up Milk Revenue (undefined), by Country 2025 & 2033
- Figure 24: South America Growing Up Milk Volume (K), by Country 2025 & 2033
- Figure 25: South America Growing Up Milk Revenue Share (%), by Country 2025 & 2033
- Figure 26: South America Growing Up Milk Volume Share (%), by Country 2025 & 2033
- Figure 27: Europe Growing Up Milk Revenue (undefined), by Application 2025 & 2033
- Figure 28: Europe Growing Up Milk Volume (K), by Application 2025 & 2033
- Figure 29: Europe Growing Up Milk Revenue Share (%), by Application 2025 & 2033
- Figure 30: Europe Growing Up Milk Volume Share (%), by Application 2025 & 2033
- Figure 31: Europe Growing Up Milk Revenue (undefined), by Type 2025 & 2033
- Figure 32: Europe Growing Up Milk Volume (K), by Type 2025 & 2033
- Figure 33: Europe Growing Up Milk Revenue Share (%), by Type 2025 & 2033
- Figure 34: Europe Growing Up Milk Volume Share (%), by Type 2025 & 2033
- Figure 35: Europe Growing Up Milk Revenue (undefined), by Country 2025 & 2033
- Figure 36: Europe Growing Up Milk Volume (K), by Country 2025 & 2033
- Figure 37: Europe Growing Up Milk Revenue Share (%), by Country 2025 & 2033
- Figure 38: Europe Growing Up Milk Volume Share (%), by Country 2025 & 2033
- Figure 39: Middle East & Africa Growing Up Milk Revenue (undefined), by Application 2025 & 2033
- Figure 40: Middle East & Africa Growing Up Milk Volume (K), by Application 2025 & 2033
- Figure 41: Middle East & Africa Growing Up Milk Revenue Share (%), by Application 2025 & 2033
- Figure 42: Middle East & Africa Growing Up Milk Volume Share (%), by Application 2025 & 2033
- Figure 43: Middle East & Africa Growing Up Milk Revenue (undefined), by Type 2025 & 2033
- Figure 44: Middle East & Africa Growing Up Milk Volume (K), by Type 2025 & 2033
- Figure 45: Middle East & Africa Growing Up Milk Revenue Share (%), by Type 2025 & 2033
- Figure 46: Middle East & Africa Growing Up Milk Volume Share (%), by Type 2025 & 2033
- Figure 47: Middle East & Africa Growing Up Milk Revenue (undefined), by Country 2025 & 2033
- Figure 48: Middle East & Africa Growing Up Milk Volume (K), by Country 2025 & 2033
- Figure 49: Middle East & Africa Growing Up Milk Revenue Share (%), by Country 2025 & 2033
- Figure 50: Middle East & Africa Growing Up Milk Volume Share (%), by Country 2025 & 2033
- Figure 51: Asia Pacific Growing Up Milk Revenue (undefined), by Application 2025 & 2033
- Figure 52: Asia Pacific Growing Up Milk Volume (K), by Application 2025 & 2033
- Figure 53: Asia Pacific Growing Up Milk Revenue Share (%), by Application 2025 & 2033
- Figure 54: Asia Pacific Growing Up Milk Volume Share (%), by Application 2025 & 2033
- Figure 55: Asia Pacific Growing Up Milk Revenue (undefined), by Type 2025 & 2033
- Figure 56: Asia Pacific Growing Up Milk Volume (K), by Type 2025 & 2033
- Figure 57: Asia Pacific Growing Up Milk Revenue Share (%), by Type 2025 & 2033
- Figure 58: Asia Pacific Growing Up Milk Volume Share (%), by Type 2025 & 2033
- Figure 59: Asia Pacific Growing Up Milk Revenue (undefined), by Country 2025 & 2033
- Figure 60: Asia Pacific Growing Up Milk Volume (K), by Country 2025 & 2033
- Figure 61: Asia Pacific Growing Up Milk Revenue Share (%), by Country 2025 & 2033
- Figure 62: Asia Pacific Growing Up Milk Volume Share (%), by Country 2025 & 2033
List of Tables
- Table 1: Global Growing Up Milk Revenue undefined Forecast, by Application 2020 & 2033
- Table 2: Global Growing Up Milk Volume K Forecast, by Application 2020 & 2033
- Table 3: Global Growing Up Milk Revenue undefined Forecast, by Type 2020 & 2033
- Table 4: Global Growing Up Milk Volume K Forecast, by Type 2020 & 2033
- Table 5: Global Growing Up Milk Revenue undefined Forecast, by Region 2020 & 2033
- Table 6: Global Growing Up Milk Volume K Forecast, by Region 2020 & 2033
- Table 7: Global Growing Up Milk Revenue undefined Forecast, by Application 2020 & 2033
- Table 8: Global Growing Up Milk Volume K Forecast, by Application 2020 & 2033
- Table 9: Global Growing Up Milk Revenue undefined Forecast, by Type 2020 & 2033
- Table 10: Global Growing Up Milk Volume K Forecast, by Type 2020 & 2033
- Table 11: Global Growing Up Milk Revenue undefined Forecast, by Country 2020 & 2033
- Table 12: Global Growing Up Milk Volume K Forecast, by Country 2020 & 2033
- Table 13: United States Growing Up Milk Revenue (undefined) Forecast, by Application 2020 & 2033
- Table 14: United States Growing Up Milk Volume (K) Forecast, by Application 2020 & 2033
- Table 15: Canada Growing Up Milk Revenue (undefined) Forecast, by Application 2020 & 2033
- Table 16: Canada Growing Up Milk Volume (K) Forecast, by Application 2020 & 2033
- Table 17: Mexico Growing Up Milk Revenue (undefined) Forecast, by Application 2020 & 2033
- Table 18: Mexico Growing Up Milk Volume (K) Forecast, by Application 2020 & 2033
- Table 19: Global Growing Up Milk Revenue undefined Forecast, by Application 2020 & 2033
- Table 20: Global Growing Up Milk Volume K Forecast, by Application 2020 & 2033
- Table 21: Global Growing Up Milk Revenue undefined Forecast, by Type 2020 & 2033
- Table 22: Global Growing Up Milk Volume K Forecast, by Type 2020 & 2033
- Table 23: Global Growing Up Milk Revenue undefined Forecast, by Country 2020 & 2033
- Table 24: Global Growing Up Milk Volume K Forecast, by Country 2020 & 2033
- Table 25: Brazil Growing Up Milk Revenue (undefined) Forecast, by Application 2020 & 2033
- Table 26: Brazil Growing Up Milk Volume (K) Forecast, by Application 2020 & 2033
- Table 27: Argentina Growing Up Milk Revenue (undefined) Forecast, by Application 2020 & 2033
- Table 28: Argentina Growing Up Milk Volume (K) Forecast, by Application 2020 & 2033
- Table 29: Rest of South America Growing Up Milk Revenue (undefined) Forecast, by Application 2020 & 2033
- Table 30: Rest of South America Growing Up Milk Volume (K) Forecast, by Application 2020 & 2033
- Table 31: Global Growing Up Milk Revenue undefined Forecast, by Application 2020 & 2033
- Table 32: Global Growing Up Milk Volume K Forecast, by Application 2020 & 2033
- Table 33: Global Growing Up Milk Revenue undefined Forecast, by Type 2020 & 2033
- Table 34: Global Growing Up Milk Volume K Forecast, by Type 2020 & 2033
- Table 35: Global Growing Up Milk Revenue undefined Forecast, by Country 2020 & 2033
- Table 36: Global Growing Up Milk Volume K Forecast, by Country 2020 & 2033
- Table 37: United Kingdom Growing Up Milk Revenue (undefined) Forecast, by Application 2020 & 2033
- Table 38: United Kingdom Growing Up Milk Volume (K) Forecast, by Application 2020 & 2033
- Table 39: Germany Growing Up Milk Revenue (undefined) Forecast, by Application 2020 & 2033
- Table 40: Germany Growing Up Milk Volume (K) Forecast, by Application 2020 & 2033
- Table 41: France Growing Up Milk Revenue (undefined) Forecast, by Application 2020 & 2033
- Table 42: France Growing Up Milk Volume (K) Forecast, by Application 2020 & 2033
- Table 43: Italy Growing Up Milk Revenue (undefined) Forecast, by Application 2020 & 2033
- Table 44: Italy Growing Up Milk Volume (K) Forecast, by Application 2020 & 2033
- Table 45: Spain Growing Up Milk Revenue (undefined) Forecast, by Application 2020 & 2033
- Table 46: Spain Growing Up Milk Volume (K) Forecast, by Application 2020 & 2033
- Table 47: Russia Growing Up Milk Revenue (undefined) Forecast, by Application 2020 & 2033
- Table 48: Russia Growing Up Milk Volume (K) Forecast, by Application 2020 & 2033
- Table 49: Benelux Growing Up Milk Revenue (undefined) Forecast, by Application 2020 & 2033
- Table 50: Benelux Growing Up Milk Volume (K) Forecast, by Application 2020 & 2033
- Table 51: Nordics Growing Up Milk Revenue (undefined) Forecast, by Application 2020 & 2033
- Table 52: Nordics Growing Up Milk Volume (K) Forecast, by Application 2020 & 2033
- Table 53: Rest of Europe Growing Up Milk Revenue (undefined) Forecast, by Application 2020 & 2033
- Table 54: Rest of Europe Growing Up Milk Volume (K) Forecast, by Application 2020 & 2033
- Table 55: Global Growing Up Milk Revenue undefined Forecast, by Application 2020 & 2033
- Table 56: Global Growing Up Milk Volume K Forecast, by Application 2020 & 2033
- Table 57: Global Growing Up Milk Revenue undefined Forecast, by Type 2020 & 2033
- Table 58: Global Growing Up Milk Volume K Forecast, by Type 2020 & 2033
- Table 59: Global Growing Up Milk Revenue undefined Forecast, by Country 2020 & 2033
- Table 60: Global Growing Up Milk Volume K Forecast, by Country 2020 & 2033
- Table 61: Turkey Growing Up Milk Revenue (undefined) Forecast, by Application 2020 & 2033
- Table 62: Turkey Growing Up Milk Volume (K) Forecast, by Application 2020 & 2033
- Table 63: Israel Growing Up Milk Revenue (undefined) Forecast, by Application 2020 & 2033
- Table 64: Israel Growing Up Milk Volume (K) Forecast, by Application 2020 & 2033
- Table 65: GCC Growing Up Milk Revenue (undefined) Forecast, by Application 2020 & 2033
- Table 66: GCC Growing Up Milk Volume (K) Forecast, by Application 2020 & 2033
- Table 67: North Africa Growing Up Milk Revenue (undefined) Forecast, by Application 2020 & 2033
- Table 68: North Africa Growing Up Milk Volume (K) Forecast, by Application 2020 & 2033
- Table 69: South Africa Growing Up Milk Revenue (undefined) Forecast, by Application 2020 & 2033
- Table 70: South Africa Growing Up Milk Volume (K) Forecast, by Application 2020 & 2033
- Table 71: Rest of Middle East & Africa Growing Up Milk Revenue (undefined) Forecast, by Application 2020 & 2033
- Table 72: Rest of Middle East & Africa Growing Up Milk Volume (K) Forecast, by Application 2020 & 2033
- Table 73: Global Growing Up Milk Revenue undefined Forecast, by Application 2020 & 2033
- Table 74: Global Growing Up Milk Volume K Forecast, by Application 2020 & 2033
- Table 75: Global Growing Up Milk Revenue undefined Forecast, by Type 2020 & 2033
- Table 76: Global Growing Up Milk Volume K Forecast, by Type 2020 & 2033
- Table 77: Global Growing Up Milk Revenue undefined Forecast, by Country 2020 & 2033
- Table 78: Global Growing Up Milk Volume K Forecast, by Country 2020 & 2033
- Table 79: China Growing Up Milk Revenue (undefined) Forecast, by Application 2020 & 2033
- Table 80: China Growing Up Milk Volume (K) Forecast, by Application 2020 & 2033
- Table 81: India Growing Up Milk Revenue (undefined) Forecast, by Application 2020 & 2033
- Table 82: India Growing Up Milk Volume (K) Forecast, by Application 2020 & 2033
- Table 83: Japan Growing Up Milk Revenue (undefined) Forecast, by Application 2020 & 2033
- Table 84: Japan Growing Up Milk Volume (K) Forecast, by Application 2020 & 2033
- Table 85: South Korea Growing Up Milk Revenue (undefined) Forecast, by Application 2020 & 2033
- Table 86: South Korea Growing Up Milk Volume (K) Forecast, by Application 2020 & 2033
- Table 87: ASEAN Growing Up Milk Revenue (undefined) Forecast, by Application 2020 & 2033
- Table 88: ASEAN Growing Up Milk Volume (K) Forecast, by Application 2020 & 2033
- Table 89: Oceania Growing Up Milk Revenue (undefined) Forecast, by Application 2020 & 2033
- Table 90: Oceania Growing Up Milk Volume (K) Forecast, by Application 2020 & 2033
- Table 91: Rest of Asia Pacific Growing Up Milk Revenue (undefined) Forecast, by Application 2020 & 2033
- Table 92: Rest of Asia Pacific Growing Up Milk Volume (K) Forecast, by Application 2020 & 2033
Frequently Asked Questions
1. What is the projected Compound Annual Growth Rate (CAGR) of the Growing Up Milk?
The projected CAGR is approximately 6.1%.
2. Which companies are prominent players in the Growing Up Milk?
Key companies in the market include Nestle, Danone, Abbott Laboratries, Kraft Heinz, Mead Johnson Nutrition, Fonterra, Arla Foods, FrieslandCampina, Hain Celestial, Meiji Holdings, Bellamy's Australia, Topfer, HiPP, Holle, Westland Milk Products, H&H Group, Hero Group, Perrigo, Yili, Mengniu.
3. What are the main segments of the Growing Up Milk?
The market segments include Application, Type.
4. Can you provide details about the market size?
The market size is estimated to be USD XXX N/A as of 2022.
5. What are some drivers contributing to market growth?
N/A
6. What are the notable trends driving market growth?
N/A
7. Are there any restraints impacting market growth?
N/A
8. Can you provide examples of recent developments in the market?
N/A
9. What pricing options are available for accessing the report?
Pricing options include single-user, multi-user, and enterprise licenses priced at USD 3950.00, USD 5925.00, and USD 7900.00 respectively.
10. Is the market size provided in terms of value or volume?
The market size is provided in terms of value, measured in N/A and volume, measured in K.
11. Are there any specific market keywords associated with the report?
Yes, the market keyword associated with the report is "Growing Up Milk," which aids in identifying and referencing the specific market segment covered.
12. How do I determine which pricing option suits my needs best?
The pricing options vary based on user requirements and access needs. Individual users may opt for single-user licenses, while businesses requiring broader access may choose multi-user or enterprise licenses for cost-effective access to the report.
13. Are there any additional resources or data provided in the Growing Up Milk report?
While the report offers comprehensive insights, it's advisable to review the specific contents or supplementary materials provided to ascertain if additional resources or data are available.
14. How can I stay updated on further developments or reports in the Growing Up Milk?
To stay informed about further developments, trends, and reports in the Growing Up Milk, consider subscribing to industry newsletters, following relevant companies and organizations, or regularly checking reputable industry news sources and publications.
Methodology
Step 1 - Identification of Relevant Samples Size from Population Database


Step 2 - Approaches for Defining Global Market Size (Value, Volume* & Price*)

Note*: In applicable scenarios
Step 3 - Data Sources
Primary Research
- Web Analytics
- Survey Reports
- Research Institute
- Latest Research Reports
- Opinion Leaders
Secondary Research
- Annual Reports
- White Paper
- Latest Press Release
- Industry Association
- Paid Database
- Investor Presentations

Step 4 - Data Triangulation
Involves using different sources of information in order to increase the validity of a study
These sources are likely to be stakeholders in a program - participants, other researchers, program staff, other community members, and so on.
Then we put all data in single framework & apply various statistical tools to find out the dynamic on the market.
During the analysis stage, feedback from the stakeholder groups would be compared to determine areas of agreement as well as areas of divergence